

Analys
SEB – Råvarukommentarer, 2 september 2013

Rekommendationer
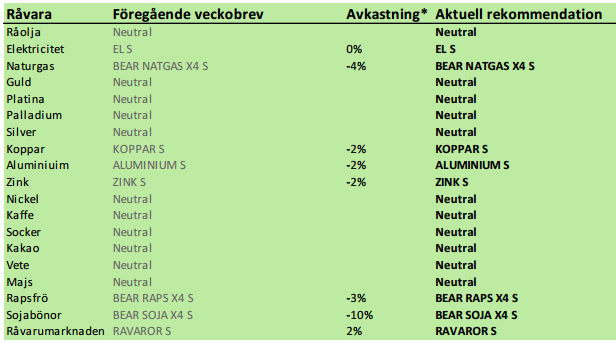
*) Avkastningen lämnar vi blank här eftersom det har varit ett två månaders uppehåll. Generellt sett har dock rekommendationerna varit lyckosamma med kraftiga nedgångar i priset på t ex spannmål och oljeväxter och prisuppgång på basmetaller.
Inledning
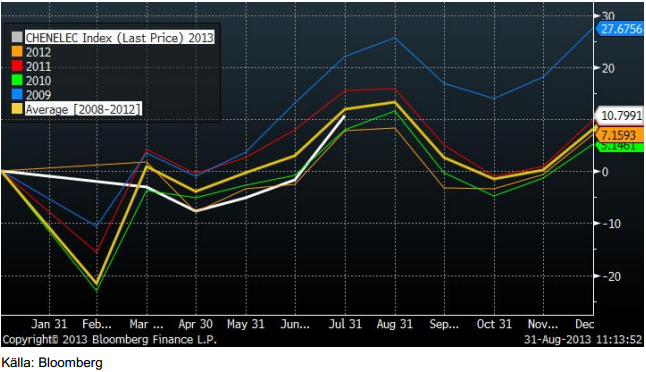
Makroekonomiska data har varit blandad med positiva IFO-siffror från Tyskland, men svag försäljningsutveckling för varaktiga varor i USA. Från USA har det å andra sidan kommit starkare ”consumer confidence” och BNP för andra kvartalet reviderades upp. Det har inte kommit någon viktig statistik från Kina, men vi ser faktiskt att elproduktionen, som tidigare sackat efter tidigare års utveckling, återhämtat sig. Elproduktionen i Kina är en indikator på hur det går i ekonomin, diagrammet nedan.
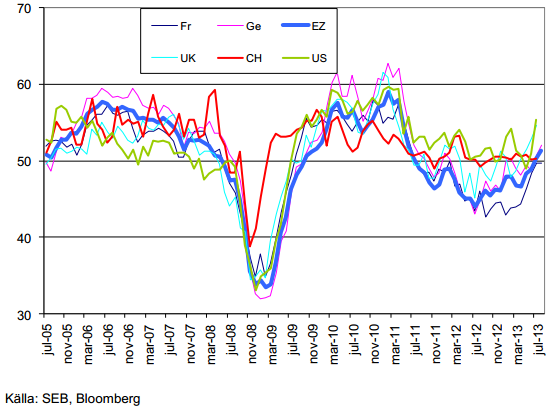
Nedan ser vi utvecklingen för PMI, en ledande konjunkturindikator, för några av världens viktigaste ekonomier. Notera hur det fortsätter att förbättra sig i Eurozonen och i USA, medan råvarulokomotivet Kina ligger fast vid 50, som indikerar varken tillväxt eller kontraktion.
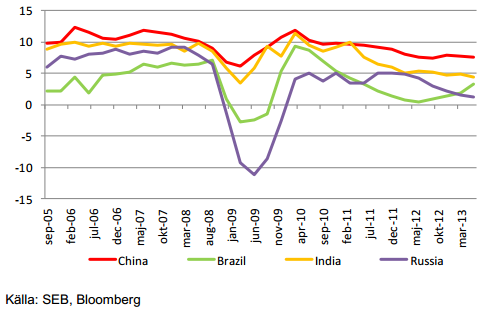
Nedan ser vi BNP-tillväxten i de fyra BRIC-länderna. Det kan vara svårt att tro, men Brasilien är faktiskt det enda BRIC-landet som ökat sin tillväxt de senaste kvartalen och har nu en högre tillväxt än Ryssland. Vi ser att Indiens tillväxt är den som minskat mest de senaste två åren. Kinas tillväxt är också i sjunkande trend.
Råolja – Brent
Oljepriset rusade uppåt i veckan i takt med publiceringen av det ena krigiska uttalandet efter det andra från USA:s regering. Det har dock hela tiden funnits röster som pekat på vikten av eftertänksamhet. Sarah Palin, som befinner sig på den högra sidan av Republikanerna sade t ex så här i fredags kväll ”So we’re bombing Syria because Syria is bombing Syria? And I’m the idiot?” I torsdags fick Storbritanniens premärminister nej av Parlamentet för ett angrepp på Syrien. I lördags sade USA:s president att han ville ha stöd av kongressen, vilket minst tar 10 dagar att få. Per Jönsson, UI, menar att detta antyder att det antagligen pågår en förhandling mellan USA och Syrien och de dramatiska uttalandena från Obamas administration ska kanske förstås utifrån detta. Marknaden verkar ha förstått detta och uppgången i oljepriset kom av sig.
Bankens oljeanalytiker anser att för oljemarknaden är Libyens problem att hålla igång ens en fraktion av sin produktionskapacitet är ett större omedelbart problem, än risken för en militär inblandning i Syrien.
Oljeprisuppgången vände precis vid de tekniska motstånden kring 117 dollar. I det mycket korta perspektivet av några dagar, är en rekyl ner mot 110 dollar trolig. Det förutsätter dock att inget militärt angrepp på Syrien görs, men det förefaller efter USA:s president Obamas tal i lördags vara osannolikt. Antagligen handlas oljepriset ner ordentligt med hänvisning till talet.
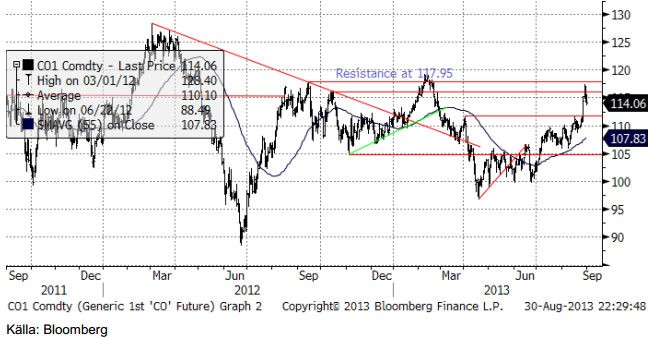
Spotkontrakt kallas det kontrakt som har kortast tid kvar till leverans. För brent är det just nu oktoberkontraktet. I kursdiagrammet ovan är det spotkontraktets pris som visas. Det handlas just nu i 114.06 dollar. November – kontraktet, som alltså förfaller och går i leverans en månad senare, handlas i 112.27 dollar. Skillnaden i pris mellan månaderna är alltså 1.56%. Om vi antar att ingenting händer med terminskurvan, utom att tiden går, kommer alltså novemberkontraktet på en månad att ha stigit med 1.56%. På årsbasis blir det 20.3%. Detta är just nu den riskpremie (priset på risk vad gäller oljeprisets variation), som oljeproducenter är villiga att betala investerare för att bära risken på oljepriset. Detta är också just nu den riskpremie som certifikat som t ex OLJA S ger innehavaren av det.
20% är en ovanligt hög riskpremie och därför ligger också i marknadens förväntningar att priset kommer att falla. De senaste åren har investerare i terminer, via OLJA S, kunnat erhålla ungefär 5%. Därtill kommer ränta på beloppet, minus avgiften, vilka tar ut varandra mer eller mindre. Därutöver har man alltså haft möjligheten att geopolitisk risk i Mellanöstern, ger vinst via prisuppgång. Aktier har svarat på oroligheterna med att falla i pris. En placering i OLJA S, samtidigt som den gett en god avkastning från riskpremien i terminskurvan, har också fungerat som ett skydd mot faktorer som får aktier på fall. Det är precis av den här anledningen som olja är bra att ha i en välbalanserad portfölj!
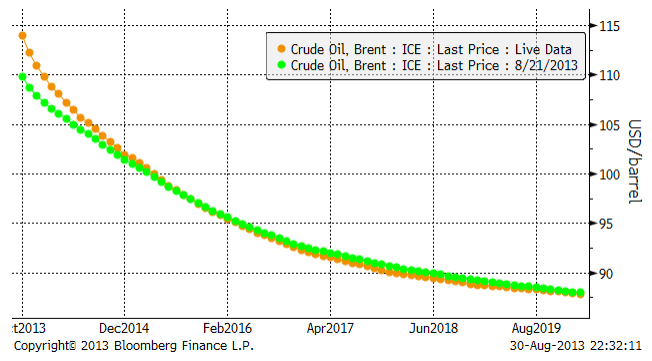
I diagrammet nedan ser vi hur oljeterminsmarknadens terminspriser ser ut framåt i tiden. Den brandgula kurvan visar hur det såg ut i fredags kväll och den gröna hur det såg ut veckan innan.
Råoljelagren i USA, ligger efter den starka importsiffran, på samma nivå som förra året. Till viss del kan detta ha sin orsak i oroligheterna i USA visavi Syrien, men det är också säsongsmässigt så att lagren vänder upp vid den här tiden på året inför höst och vinter.
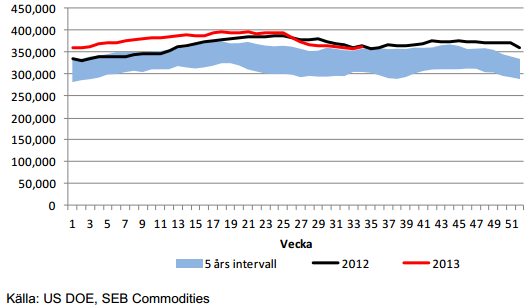
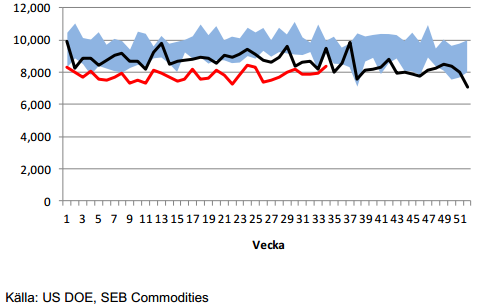
Importen år 2013 (röd) fortsätter att hålla sig under importen förra året (svart) och intervallet för de fem åren 2007-2011. Säsongsmässigt brukar man se en ökad import i den här veckan, och det såg vi också.
Vår vy är neutral.
Elektricitet
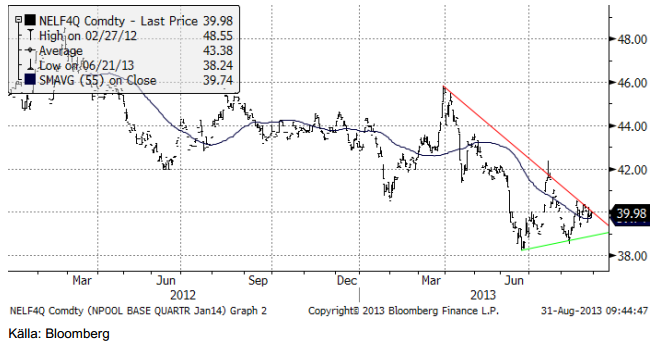
Nedan ser vi prisdiagrammet på det första kvartalets 2014 kontrakt. Vad vi ser är successivt lägre toppar sedan mars månad, och successivt högre bottnar sedan juni. Detta bildar en inom den tekniska analysen, klassiskt så kallad ”triangelformation”. Man ser dem ofta vid trendvändningar. I det här fallet är den huvudsakliga trenden nedåtriktad. Man bör alltid vänta på utbrott från triangeln, men med tanke på dels att priset är riktigt lågt i ett historiskt perspektiv och att det varit en varm och regnfattig sommar, med underskott i vattenmagasinen, ett år äldre kärnkraftverk, så skulle det inte förvåna om priset steg.
Den senaste veckan har priset rört sig ytterst lite, däremot har handeln varit livlig.
Vi ska se lite mer i perspektiv hur lågt elpriset är just nu. Nedan ser i spotkontraktet på ”årskontraktet” för el, dvs vad det skulle kosta att prissäkra ett helt kalenderår. Just nu avser spotkontraktet priset för att prissäkra leverans av el under hela år 2014. Diagrammet är på månadsbasis.
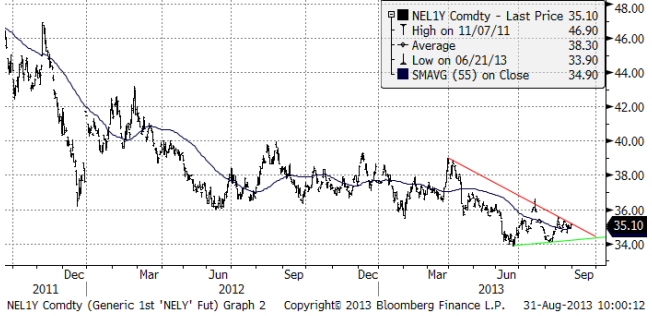
Vi tror att det är riktigt låga priser på el just nu. Det är orsakat av riktigt låga priser på kol, bottennivåer på utsläppsrätter och allmän lågkonjunktur. Även om ”tajmingen” kan missa, är elpriset nedtryckt av att alla faktorer är i botten. Det borde rimligtvis vara bättre att vara köpt än att vara såld elpriset. I synnerhet som tillväxten, t ex i USA tycks vara på väg tillbaka.
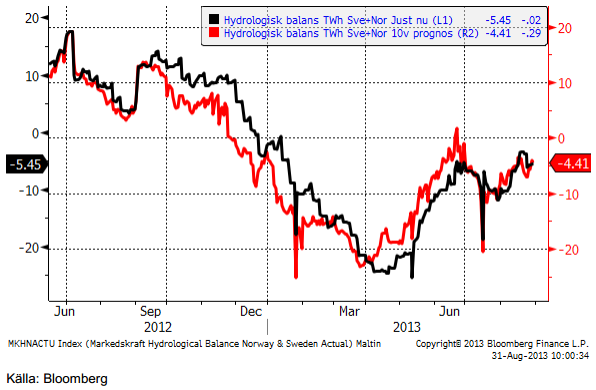
Hydrologisk balans ligger kvar på ett underkott (i förhållande till normala vattennivåer).
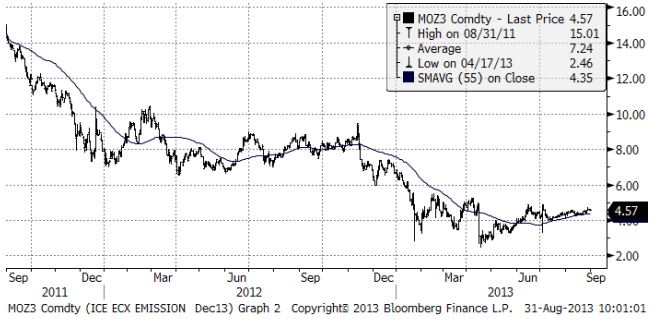
Marginalkostnaden för att producera el bestäms av priset på kol och priset på utsläppsrätter. Nedan ser vi priset på utsläppsrätter i euro / ton. Vi ser att priset bottnade i april. Sedan dess har en viss återhämtning och framförallt konsolidering ägt rum.
Vi rekommenderar alltså försiktigt köp av el, t ex EL S, som har mindre risk än BULL EL X4 S.
Naturgas
Naturgaspriset har varit fallande sedan maj, men har rekylerat upp i augusti. Vi tror att det handlar om just en rekyl och att priset kommer att vända ner igen.
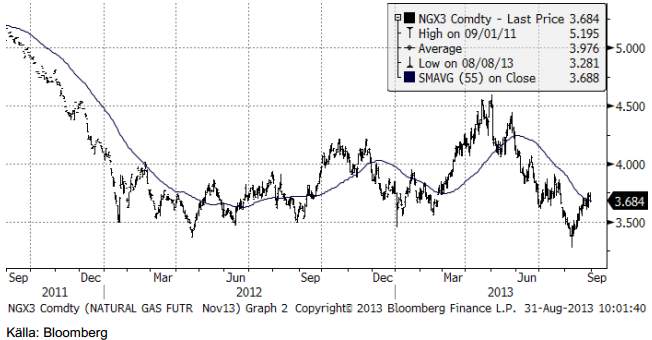
EIA räknar med att år 2013 blir det sjätte året på raken med rekordproduktion av naturgas i USA.
Guld & Silver
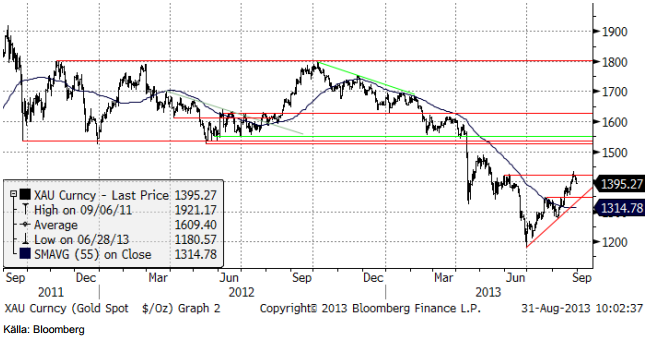
Guldpriset har rekylerat upp och nått upp till nivåer där rekylen torde stöta på motstånd i det korta perspektivet. USA:s president Obamas tal om Syrienkonflikten, längre beskriven under råoljeavsnittet ovan, torde få en klart negativ påverkan på guld- och silvermarknaderna i den kommande veckan.
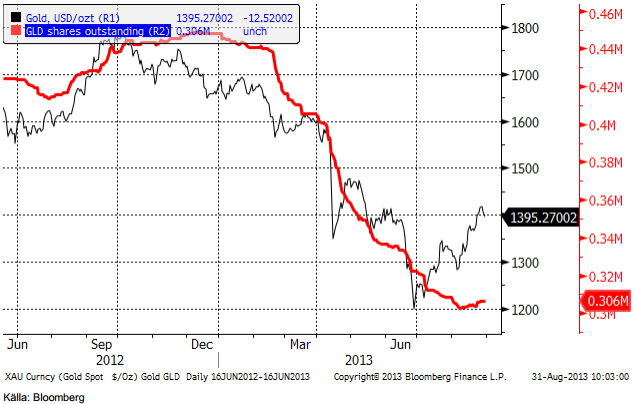
Den största börshandlade investeringsprodukten på guld, GLD, som investerare sålt av friskt under våren, har faktiskt attraherat nettoinflöden för första gången sedan november förra året. Vi ser antal GLD-bevis utestående i röd kurva nedan och guldpriset som den tunnare svarta.
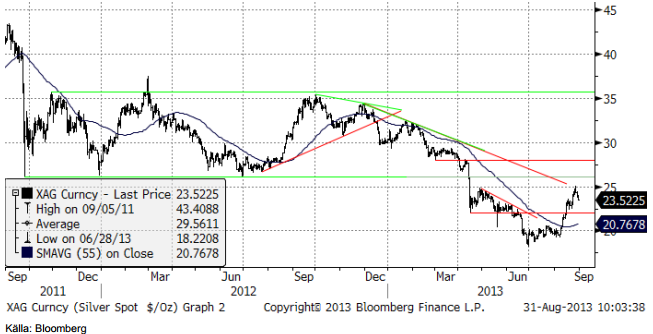
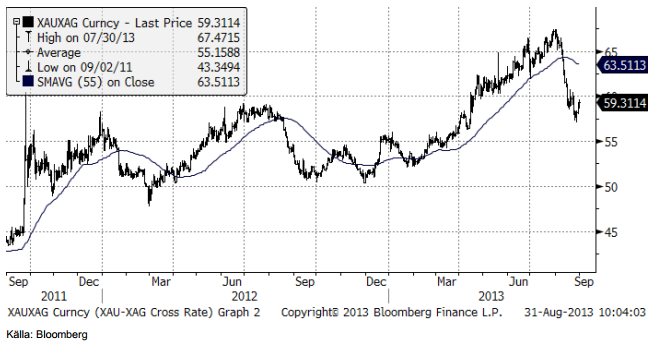
Nedan ser vi kursdiagrammet för silver i dollar per troy ounce. Prisuppgången i veckan stannade vid motståndet på 25 dollar, som nämndes i förra veckans brev. Nedgången lär få fortsatt fart när handeln öppnar igen natten till måndag.
Nedan ser vi kvoten mellan guldpriset och silverpriset. Silver har hämtat igen en del mark mot guldet sedan slutet av juli. Kanske är det dags att tappa lite mot guldet nu.
Platina & Palladium
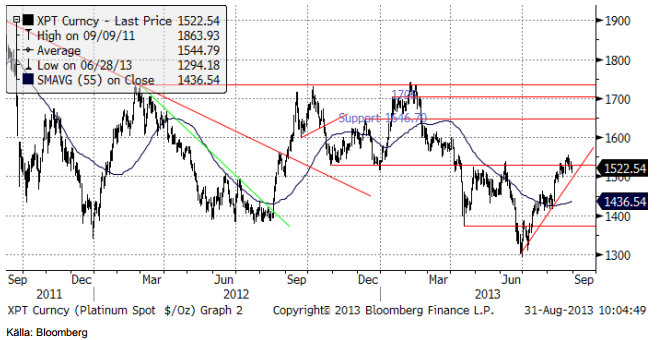
Platina har stigit upp till ett tekniskt motstånd, där priset har vänt ner tidigare i år. Stödet under trenden uppåt är intakt. Om veckan inleds med fallande priser för ädelmetaller, kan det bli ett test av stödlinjen. Bryts den, har vi återigen en säljsignal på platina.
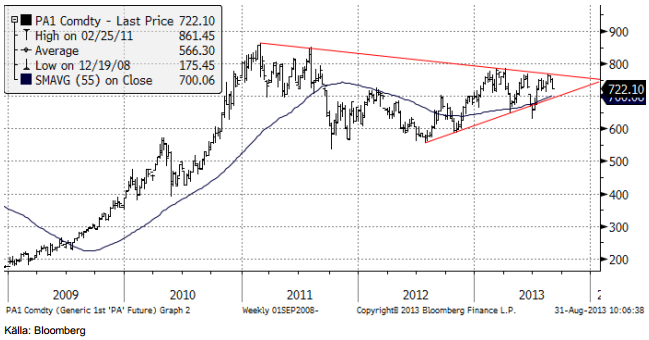
Palladiumpriset ligger precis under ett tekniskt motstånd. Det är en mycket spännande situation rent tekniskt. Motståndet har hållit så många gånger, att ett brott uppåt från den skulle signalera en större förändring i palladiummarknaden. Än så länge ser motståndet dock ut att hålla. Gissningsvis håller motståndet och priset rekylerar nedåt i det korta perspektivet. Skulle motståndet brytas uppåt, vill vi naturligtvis vara köpta palladium. Det finns även en stödlinje under, inritad i diagrammet nedan. Bryts den på nedsidan har vi istället en säljsignal. Priset kan då falla från 722 dollar till nästa stöd på 600 dollar, enligt teknisk analys.
Vi är för närvarande neutrala platina och palladium.
Koppar
De som tror på uppgång i kopparpriset pekar på att det ekonomiska läget i Kina håller på att förbättras och de första tecknen på en återhämtning i Europa. De ser detta som en bra anledning att köpa på nedgångar. De som tror på fortsatt nedgång i kopparpriset oroar sig för det ekonomiska hälsotillståndet i tillväxtmarknader som Indien, Brasilien, Ryssland och Indonesien. Effekten av osäkerheten har blivit en högre kursrörlighet. Vi håller mer på den grupp som tror på en uppgång i priset, eftersom fundamenta gradvis tycks förbättras. Vi tror att konsumenter av metallen också kommer att passa på att köpa på prisnedgångar. Å andra sidan hör vi också om producenter som är måna om att hedga om priserna kommer upp till runt 7400 dollar. Det ger oss en ”range” som ligger vid 7000 till 7500 dollar per ton och det är där priset har legat. Skulle priset gå över 7500 dollar, har vi en teknisk köpsignal, men som marknaden ser ut, är det nog en bättre idé att försöka köpa nära botten på prisintervallet, dvs om priset återigen går ner mot 7000 dollar.
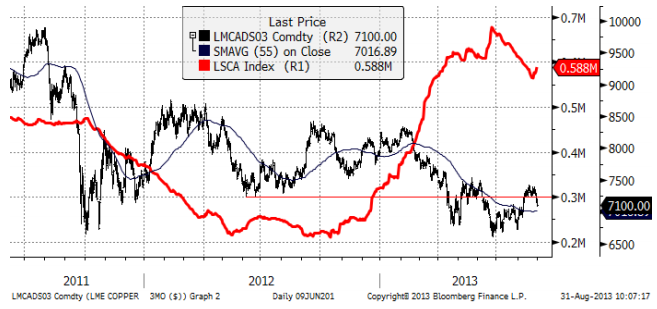
Vi förväntar oss fortsatt hög volatilitet. Vår kortsiktiga bedömning talar för uppsidan och vi rekommenderar därför köp av BULL KOPPAR X2 S eller X4 S.
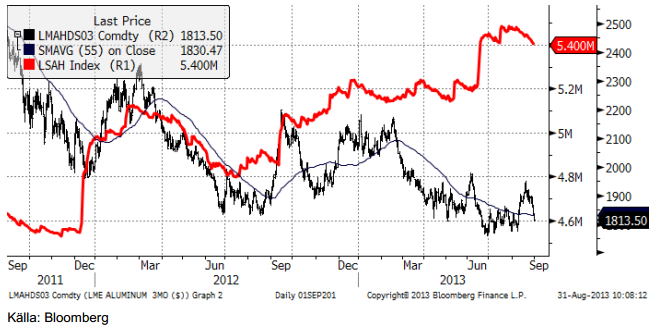
Aluminium
Premien (över LME-noteringen) för fysisk leverans av metal har fallit dramatiskt i veckan som gick. Det har även själva LME-noteringen. Detta är ett hårt slag för producenterna. I vår prognos för nästa år ligger stora produktionsneddragningar. Vi förväntar oss att producenter kommer att tillkännage produktionsneddragningar de kommande månaderna. En betydande andel av producenterna förlorar pengar vid dagens priser. Nu, när priemierna faller, och förmodligen kommer att falla ännu mer när LME:s förslag går igenom i oktober. Det är är inte helt säkert att LME:s lösning på problemet med premierna för fysisk aluminium går igenom, men det är mycket troligt. Då blir situationen ännu värre för producenterna.
Zink
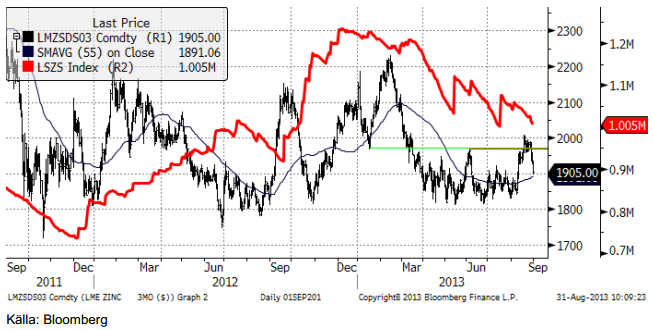
Sedan kursfallet under det första kvartalet, har zinkpriset fastnat i ett relativt smalt prisintervall mellan 1800 och 1950 dollar per ton. Uppgången sedan juli, som tillfälligt bröt 2000-nivån, ser ut att vara slutet på ”sidledeshandeln”. Efter flera år när det producerats mer än vad som konsumerats, har marknaden börjat komma i balans igen. Lagernivåerna vid LME har också börjat sjunka och uppgår nu till 1 miljon ton, vilket är enormt mycket, men drygt 200,000 ton mindre än för ett halvår sedan. Enligt ILZG var låg marknaden på ett överskott om 44,000 ton under det första halvåret, jämfört med 157,000 ton samma period förra året. Det långsiktiga ”bull-caset” för zink är baserat på att betydande gruvkapacitet stängs de kommande åren. Detta gäller fortfarande. 1.5 mt årlig produktionskapacitet väntas bli nedlagt under åren 2013 till 2016. Av detta tängs 450,000 tons kapacitet det kommande året.
Nickel
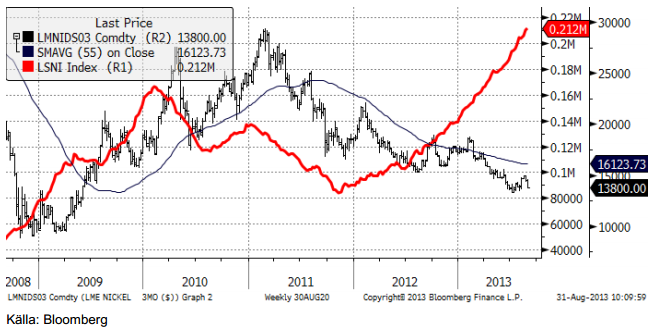
Det huvudsakliga temat för nickel är alltjämt överproduktionen av Nickel Pig Iron (”NPI”) i Kina. Den senaste RKEF-teknologin har sänkt marginalkostnaden för produktionen, vilket har satt ytterligare press på priserna. En effekt av den ökade produktionen av NPI i den rostfria stålindustrin, är ett överhäng av primärnickel i Kina. Rekordnivån på lagren vid LME 212,000 ton, har huvudsakligen orsakats av inleveranser till lagerhuset i Johor i Malaysia. Det materialet har antagligen exporterats från Kina. Nickelgruvor lider under dagens låga priser och marknaden behöver gruvnedläggningar för att återkomma i balans.
[box]SEB Veckobrev Veckans råvarukommentar är producerat av SEB Merchant Banking och publiceras i samarbete och med tillstånd på Råvarumarknaden.se[/box]
Disclaimer
The information in this document has been compiled by SEB Merchant Banking, a division within Skandinaviska Enskilda Banken AB (publ) (“SEB”).
Opinions contained in this report represent the bank’s present opinion only and are subject to change without notice. All information contained in this report has been compiled in good faith from sources believed to be reliable. However, no representation or warranty, expressed or implied, is made with respect to the completeness or accuracy of its contents and the information is not to be relied upon as authoritative. Anyone considering taking actions based upon the content of this document is urged to base his or her investment decisions upon such investigations as he or she deems necessary. This document is being provided as information only, and no specific actions are being solicited as a result of it; to the extent permitted by law, no liability whatsoever is accepted for any direct or consequential loss arising from use of this document or its contents.
About SEB
SEB is a public company incorporated in Stockholm, Sweden, with limited liability. It is a participant at major Nordic and other European Regulated Markets and Multilateral Trading Facilities (as well as some non-European equivalent markets) for trading in financial instruments, such as markets operated by NASDAQ OMX, NYSE Euronext, London Stock Exchange, Deutsche Börse, Swiss Exchanges, Turquoise and Chi-X. SEB is authorized and regulated by Finansinspektionen in Sweden; it is authorized and subject to limited regulation by the Financial Services Authority for the conduct of designated investment business in the UK, and is subject to the provisions of relevant regulators in all other jurisdictions where SEB conducts operations. SEB Merchant Banking. All rights reserved.

Market is starting to take US/Iran headlines with a pinch of salt. Brent crude rose $2.8/b yesterday to an official close of $112.1/b. But after that it traded as low as $108.05/b before ending late night at around $109.7/b. Through the day it traded in a range of $106.87 – 112.72/b amid a flurry of news or rumors from Iran and the US. ”US temporary sanctions during negotiations” (falls alarm). ”We will bomb Iran” (not anyhow),… etc. While the market is still fluctuating to this kind of news flow, it is starting to take such headlines with a pinch of salt.

We’ll see. Maybe, maybe not. The Brent M1 contract is trading at $110.2/b this morning which very close to the average ticks through yesterday of $110.4/b.
Trump with bearish, verbal intervention whenever Brent trades above $110/b it seems. What seems to be a pattern is that Trump states something like ”very good negotiations going on with Iran”, ”New leaders in Iran are great,..”, ”Great progress in negotiations,…”, ”Deal in sight,..” etc whenever the Brent M1 contract trades above $110/b. An effort to cool the market. These hot air verbal interventions from Trump used to have a heavy bearish impact on prices, but they now seems to have less and less effect unless they are backed by reality.
As far as we can see there has been no real progress in the negotiations between the US and Iran with both sides still standing by their previous demands.
Iran is getting stronger while the cease fire lasts making a return to war for Trump yet harder. Iran is naturally in constant preparation for a return to war given Trump’s steady threats of bombing Iran again. Iran is naturally doing what ever is possible to prepare for a return to war. And every day the cease fire lasts it is better prepared. This naturally makes it more and more difficult and dangerous for the US to return to warring activity versus Iran as the consequences for energy infrastructure in the Persian Gulf will be more and more severe the longer the cease fire lasts. Israel seems to see it this way as well. That the war is not won and that current frozen state of a cease fire gives Iran opportunity to rebuild military and politically.
Global inventories are drawing down day by day. How much? In the meantime the Strait of Hormuz stays closed. There is varying measures and estimates of how much global inventories are drawing down. Our rough estimate, back of the envelope, is that global inventories are drawing down by at least some 10 mb/d or about 300 mb/d in a balance between loss of supply versus demand destruction. Other estimates we see are a monthly draw of 250-270 mb/d. The IEA only ’measured’ a draw in global observable stocks of 117 mb in April with oil on water rising 53 mb while on shore stocks fell 170 mb. But global stocks are hard to measure with large invisible, unmeasured stocks. As such a back of the envelope approach may be better.
Oil products is what the world is consuming. Oil product prices likely to rise while product stocks fall. Strategic Petroleum Reserves (SPR) are predominantly crude oil. Discharging oil from OECD SPR stocks, a sharp reduction in Chinese crude imports and a reduction in global refinery throughput of 6-7 mb/d has helped to keep crude oil markets satisfactorily supplied. But global inventories are drawing down none the less. And oil products is really what the world is consuming. So if global refinery throughput stays subdued, then demand will eventually have to match the supply of oil products. The likely path forward this summer is a steady draw down in jet fuel, diesel and gasoline. Higher prices for these. Then, if possible, higher refinery throughput and higher usage of crude in response to very profitable refinery margins. And lastly sharper draw in crude stocks and higher prices for these. But some 6 mb/d of oil products used to be exported through the Strait of Hormuz. And it may not be so easy to ramp up refinery activity across the world to compensate. Especially as Ukraine continues to damage Russian refineries as well as Russian crude production and export facilities.
Watch oil product stocks and prices as well as Brent calendar 2027. What to watch for this summer is thus oil product inventories falling and oil product premiums to crude rising. Another measure to watch is the Brent crude 2027 contract as it rises steadily day by day as the Strait of Hormuz stays closed and global oil inventories decline. The latter is close to the highest level since the start of the war and keeps rising.
The Brent M1 contract and the Brent 2027 prices and current price of jet fuel in Europe (ARA). All in USD/b

Our back of the envelope calculation of the global shortage created by the closure of the Strait of Hormuz. Note that 3.5 mb/d of discharge from SPR is also a draw. Note also that ’Forced demand loss’ of 2.5 mb/d is probably temporary and will fall back towards zero as logistics are sorted out leaving ’Price demand loss’ to do the job of balancing the market. Thus a shortfall of at least 9 mb/d created by the closure. More if SPR discharge is included and more if Forced demand loss recedes.

Brent is climbing higher. Front-month is at USD 106.3/bl this morning, close to a weekly high and a USD 9/bl jump from Mondays open. This is the move we flagged as a risk earlier in the week: the market shifting from ”a deal is around the corner” to ”this is going to take longer than we thought”.

Analyst Commodities, SEB
During April, rest-of-year Brent remained remarkably stable around USD 90/bl. A stability which rested on one single assumption: the SoH reopens around 1 May. That assumption is now slowly falling apart.
As we highlighted yesterday: every week of delay beyond 1 May adds (theoretically) ish USD 5/bl to the rest-of-year average, as global inventories draw 100 million barrels per week. i.e., a mid-May reopening implies rest-of-year Brent closer to USD 100/bl, and anything pushing into June or July takes us meaningfully higher.
What’s changed in the last 48 hours:
#1: The US military has formally warned that clearing suspected sea mines from SoH could take up to six months. That is a completely different timescale from what the financial market is pricing. Even a political deal tomorrow does not immediately reopen the strait.
#2: Trump has shifted his tone from urgency to ”strategic patience”. In yesterday’s press conference: ”Don’t rush me… I want a great deal.” The market is reading this as a president no longer feeling pressured by timelines, with the naval blockade running in the background.
#3: So far, the military activity is escalating, not de-escalating. Axios reports Iran is laying more mines in SoH. The US 3rd carrier strike group (USS George H.W. Bush) is arriving with two countermine vessels. Trump yesterday ordered the US Navy to destroy any Iranian boats caught laying mines. While CNN reports that the Pentagon is actively drawing up plans to strike Iranian SoH capabilities and individual Iranian military leaders if the ceasefire collapses. i.e., NOT a attitude consistent with an imminent deal!
Spot crude and product prices eased off the early-April highs on a combination of system rerouting and deal optimism. Both now weakening. Goldman estimates April Gulf output is reduced by 14.5 mbl/d, or 57% of pre-war supply, a number that keeps getting worse the longer this drags on.
Demand-side adaptation is ongoing: S. Korea has cut its Middle East crude dependence from 69% to 56% by pulling more from the Americas and Africa, and Japan is kicking off a second round of SPR releases from 1 May. But SPRs are finite.
Ref. to the negotiations, we should not bet on speed. The current Iranian leadership is dominated by genuine hardliners willing to absorb economic pain and run the clock to extract concessions. That is not a setup for a rapid resolution. US/Israeli media briefings keep framing the delay as ”internal Iranian divisions”, the reality is more complicated and points toward weeks and months, not days.
Our point is that the complexity is large, and higher prices have only just started (given a scenario where the negotiations drag out in time). The market spent April leaning on the USD 90/bl rest-of-year assumption; that case is diminishing by the hour. If ”early May reopening” is replaced by ”June, July or later” over the next week or two, both crude and products have meaningful room to reprice higher from here. There is a high risk being short energy and betting on any immediate political resolution(!).
Down on Friday. Up on Monday. The Brent June crude oil contract traded down 5.1% last week to a close of $90.38/b. It reached a high of $103.87/b last Monday and a low of $86.09/b on Friday as Iran announced that the Strait of Hormuz was fully open for transit. That quickly changed over the weekend as the US upheld its blockade of Iranian oil exports while Iran naturally responded by closing the SoH again. The US blew a hole in the engine room of the Iranian ship TOUSKA and took custody of the ship on Sunday. Brent crude is up 5.6% this morning to $95.4/b.
The cease-fire is expiring tomorrow. The US has said it will send a delegation for a second round of negotiations in Islamabad in Pakistan. But Iran has for now rejected a second round of talks as it views US demands as unrealistic and excessive while the US is also blocking the Strait of Hormuz.
While Brent is up 5% this morning, the financial market is still very optimistic that progress will be made. That talks will continue and that the SoH will fully open by the start of May which is consistent with a rest-of-year average Brent crude oil price of around $90/b with the market now trading that balance at around $88/b.
Financial optimism vs. physical deterioration. We have a divergence where the financial market is trading negotiations, improvements and resolution while at the same time the physical market is deteriorating day by day. Physical oil flows remain constrained by disrupted flows, longer voyage times and elevated freight and insurance costs.
Financial markets are betting that a US/Iranian resolution will save us in time from violent shortages down the road. But every day that the SoH remains closed is bringing us closer to a potentially very painful point of shortages and much higher prices.
The US blockade is also a weapon of leverage against its European and Asian allies. When Iran closed the SoH it held the world economy as a hostage against the US. The US blockade of the SoH is of course blocking Iranian oil exports. But it is also an action of disruption directed towards Europe and Asia. The US has called for the rest of the world to engaged in the war with Iran: ”If you want oil from the Persian Gulf, then go and get it”. A risk is that the US plays brinkmanship with the global oil market directed towards its European and Asian allies and maybe even towards China to force them to engage and take part. Maybe unthinkable. But unthinkable has become the norm with Trump in the White House.


Sommarväder skapar prisrally på elbörsen
Oil product price pain is set to rise as the Strait of Hormuz stays closed into summer

Solkraften pressar elpriserna dagtid

Michel Gubel ger sin syn på oljemarknaden