

Analys
SEB Jordbruksprodukter, 9 juni 2014


 Odlingsvädret fortsätter att vara gynnsamt för att få fram en stor skörd av spannmål och oljeväxter på norra halvklotet. Priserna har fallit den senaste tiden, men fredagens handel på de amerikanska börserna slutade med förvånande styrka. Det är svårt att veta om detta beror på att handlare stänger korta positioner vid nivåer som ändå är nära historiska bottenpriser, inför en långhelg (de flesta länder har helgdag på måndag), eller om fredagens uppgång är starten på en rekyl uppåt. För att återkomma till odlingsvädret, kan detta ligga bakom uppgången i vetepriserna, då prognosen som ödets ironi visar onormalt mycket regn över Texas, Oklahoma och Kansas. Regn är inte nödvändigtvis bra just nu, när skörden där precis ska börja.
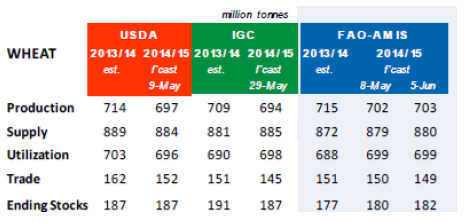
Veckan som kommer, blir händelserik med WASDE-rapport på onsdag. FAO/AMIS som rapporterade i torsdags justerar upp både produktion och utgående lager och det ger kanske en fingervisning om vad USDA kommer att göra.
Mjölkpriserna rasade på Fonterras International Dairy Trade i tisdags, men på EUREX står terminerna faktiskt högre än de gjorde för två veckor sedan.
Odlingsväder
Kina är något mindre torrt i prognosen för de kommande två veckorna än tidigare. Det har varit så ett bra tag, vilket borde få en effekt på skördens storlek. Monsunen i Indien är senare än vanligt och prognosen för nederbörden i Indien de kommande två veckorna är fortfarande att det är väsentligt torrare än normalt.
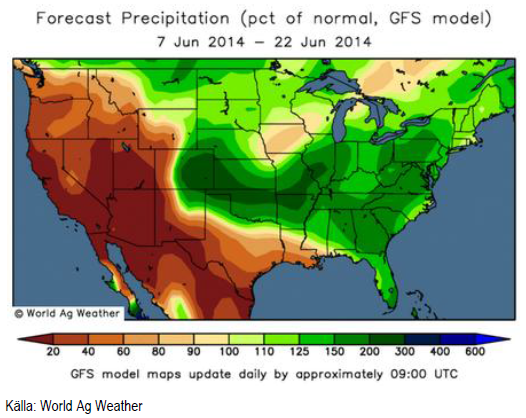
I USA väntas nederbörden över de tidigare torkdrabbade delstaterna Kansas, Texas och Oklahoma fortsätta att vara rikligare än normalt. Det kommer också att regna mer än normalt över corn belt och sojaodlingsområdena. De typiska ökendelstaterna i Sydvästern och i Kalifornien får desto mindre nederbörd.
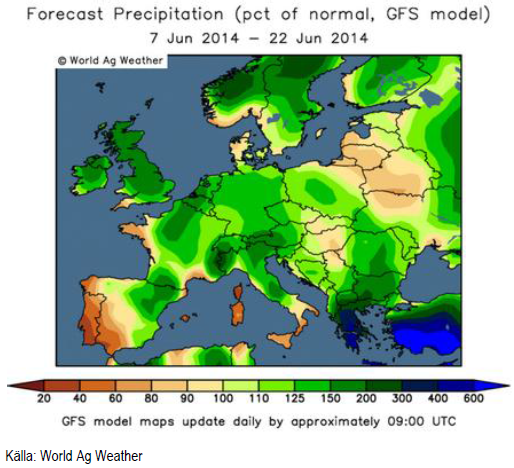
Europa fortsätter att vara mycket blötare än normalt. Grekland och Turkiet väntas få väsentligt mycket mer nederbörd än normalt, vilket knappast är bra för skörden där. Storbritannien, där en lovande skörd regnade bort totalt förra året, väntas få mer nederbörd än normalt fram till den 22 juni. Kontinentaleuropa verkar dock torka upp med normal eller något över normal nederbörd. Detta är inte typiskt för ett El Niño-år, som brukar innebära översvämning av de stora floderna i Europa. Mer om El Niño nedan. Över fjällen i Sverige och Norge väntas mer regn, vilket om inte annat kan sätta press på elpriset (igen).
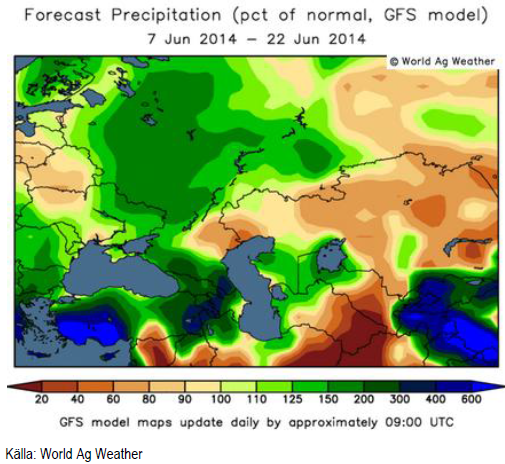
I veckan som gick fanns en oro för torrt och varmt väder i Ryssland. Som vi ser vänds detta i vart fall när det gäller nederbörden.
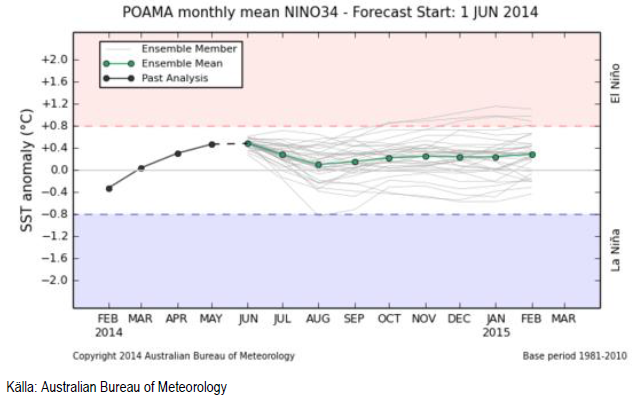
Nyheterna är fyllda av prognoser om ”70% sannolikhet för El Niño till augusti”. Trots att El Niño inte innebär en global odlingskatastrof, som ett La Niña kan göra, får nyhetsrapporteringen ändå utrymme såsom en katastrofnyhet.
Vi har tidigare skrivit att Australiensarna är de som av naturliga skäl, eftersom de berörs mest, är duktigast på att göra prognoser av ENSO. Vi har också noterat att de för två månader sedan sade att det var 70% sannolikhet för ett El Niño redan i juli. För en månad sedan hade de flyttat fram starten till från juli till augusti. I den senaste rapporten, som de just publicerat och som har 1 juni som prognosstart, har ännu lägre sannolikhet för El Niño. Ensembleprognosen som vi ser nedan, ligger nästan helt på normala nivåer. Inget El Niño alls! Om förändringen i prognosen håller i sig, ska man kanske snarare vara orolig för ett La Niña!
Vete
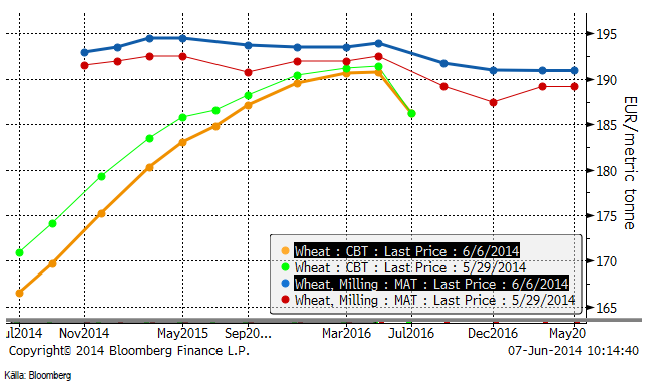
Matifvetet föll till 190 euro och uppehöll sig där några dagar. Det är inte många lantbrukare som vill sälja på de här nivåerna, men däremot en del på köparsidan som kan tycka att 190 är billigt. Fredagens handel slutade med en rejäl uppgång och marknaden stängde nära dagshögsta på 193 euro per ton. Orsaken till uppgången är kanske oro för att den onormalt rikliga nederbörden över Kansas, Oklahoma och Texas ska förstöra den lilla skörd som finns. Det kom också frostvarningar från Kanada.
Kommer priset upp lite till och det kan räcka med 195 euro nu, tror jag lantbrukare inte kommer att vänta längre. I vart fall någonstans i intervallet 195-200 kommer många att tycka att det är bra nog för att prissäkra.
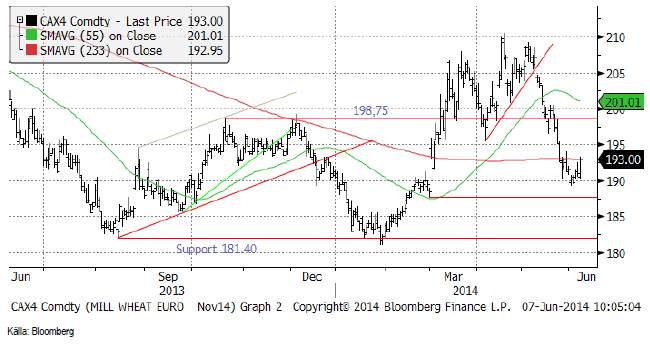
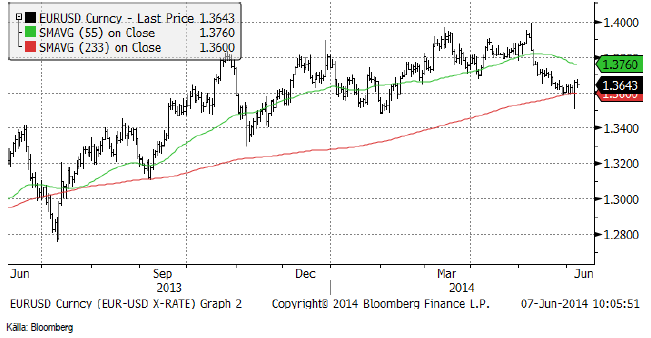
En viss del av Matifmarknadens styrka kom från eurons försvagning efter ECB:s sänkning av inlåningsräntan till negativ ränta i torsdags. Euron föll först kraftigt mot dollarn, men återhämtade sig dock ganska snabbt och stängde faktiskt på en högre nivå än dagen innan. Fredagens handel på valutamarknaden behöll i stort sett nivån.
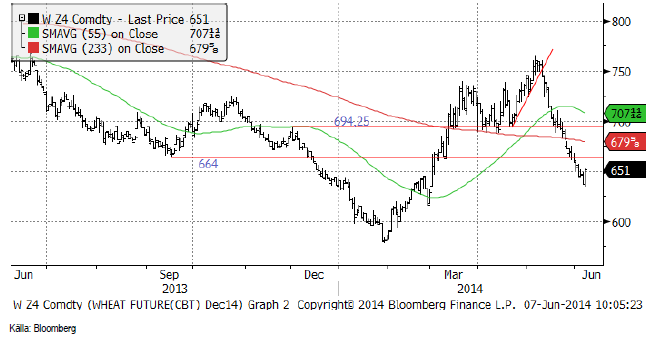
Chicagovetet (december), som inte fått stöd av svagare euro, föll ner till en botten i torsdags, men vände sedan rakt upp på fredagen och stängde på 651 cent. En rekyl uppåt, i första hand kanske mot 664 cent är trolig i veckan som kommer. Potentialen för en rekyl uppåt är större för Chicagovetet än för Matifvetet.
Nedan ser vi terminskurvorna för Chicagovete och Matif i fredags och veckan innan. Notera att Matif gått upp och Chicago har gått ner – för alla löptider på respektive terminsbörs. Det är bland annat av den här anledningen som potentialen för högre pris i veckan som kommer är större för Chicago än för Matif.
Andelen av USA:s höstvete i ”good/excellent condition” låg i förra måndagens rapport kvar på 30%. Detta är långt under genomsnittet för 2009-13 på drygt 45%, men inte så mycket lägre än förra årets 32%.
Nästa vecka kommer juni månads WASDE-rapport från det amerikanska jordbruksdepartementet. Några dagar innan brukar AMIS komma med sin rapport, som ger en liten vägledning om hur USDA:s siffror kan komma att förändra sig.
Nedan ser vi FAO/AMIS estimat för vete. Det är 1 mt högre produktion av vete pga nederbörden i torkdrabbade USA. Utgående lager höjs med 2 mt.
Fem analytiker som tillfrågats om estimat för EU-28:s skörd av vete gav ett medelestimat på 145.9 mt. Det är högre än EU:s eget estimat på 144.98 mt. Detta återspeglar den allmänna uppfattningen just nu. Vädret fortsätter att vara gynnsamt i stort sett i hela EU. ADM:s dotterbolag Toepfer estimerar att skörden av vete (exklusive durum) i EU kan uppgå till 139.16 mt, 2.3% mer än förra året. Det är framförallt i Storbritannien som ökningen väntas ske (+26%) efter förra årets regnskadade skörd. Ökningar väntas också i Rumänien, Bulgarien, Danmark och i Sverige, enligt Toepfer.
De flesta verkar nu vara övertygade om att priset ska ner. Det är i sådana lägen man måste försöka tänka självständigt. Det finns flera varningstecken: Torkan i centrala Kina, den sena monsunen i Indien, regnen över Texas, Oklahoma, och Kansas, och så den oväntat blöta prognosen för Storbritannien.
Än så länge ligger vi dock kvar med säljrekommendation, men det mesta talar för en rekyl uppåt i veckan som kommer. Än så länge tycker jag man ska se den rekylen som ett tillfälle att sälja, men om detta kommer att vara lika bra får vi återkomma till om en vecka, när vi fått lite mer väderstatistik, en WASDE-rapport och kanske de första skörderapporterna.
Maltkorn
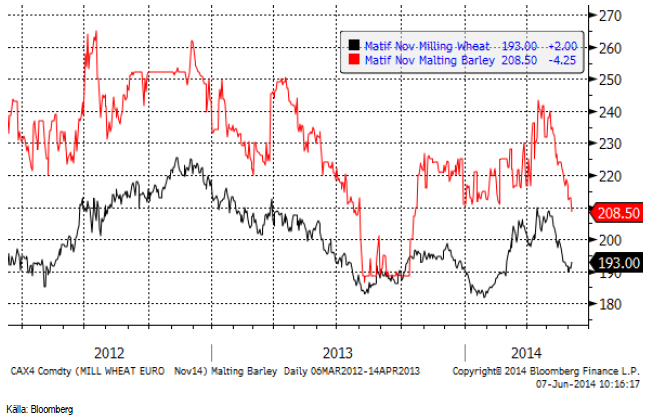
Maltkornsterminen för leverans i november har rasat i pris den senaste månaden, från 240 euro per ton till 208.50. Premien över Matifs vetetermin har också rasat och är nu bara 15 euro (från tidigare 30).
Majs
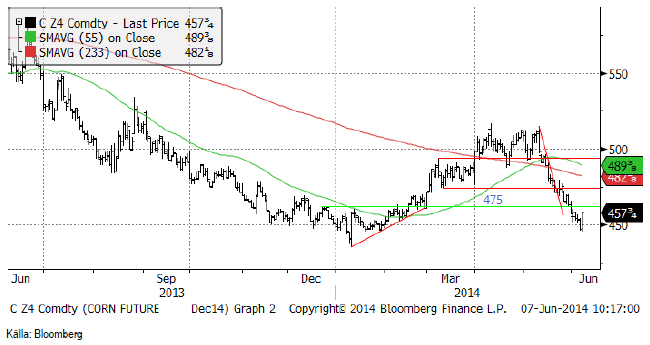
Decemberkontraktet på föll i torsdags till sin lägsta nivå sedan januari, men vände upp kraftigt i fredags. Någon bra förklaring till trendvändningen är svår att hitta. Många länder är på semester på måndag och kanske passade många på att stänga riskpositioner inför långhelgen när priset ändå var nästan nere vid årslägsta.
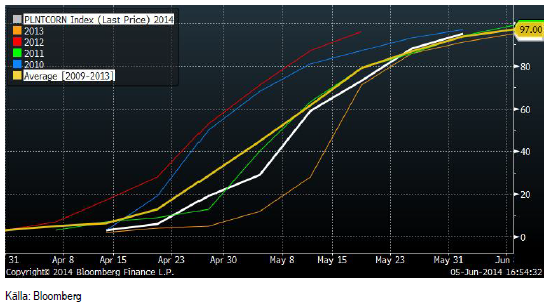
Sådden av majs i USA var per den 30 maj klar till 95%. Som vi ser är den senare delen av sådden klar i normal takt – eller faktiskt marginellt snabbare än ”normalt”. Det mesta var faktiskt sått före mitten av maj, vilket anses vara en garanti för att det ska bli avdrag på skördens storlek.
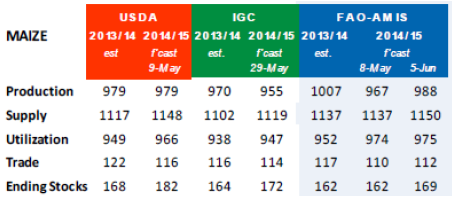
USDA rapporterar på onsdagen den 11 juni. Förväntningarna är att det mycket gynnsamma vädret i USA ska bära fram en rekordskörd på 13.939 miljarder bushel. FAO/AMIS rapport från tidigare i veckan återspeglar dessa förväntningar med en rätt stor höjning av global produktion av majs från 967 mt den 8 maj till 988 mt den 5 januari. AMIS justerar upp utgående lager från 162 mt till 169 mt.
På kort sikt kan det komma en rekyl uppåt, men priset på majs borde gå ner ännu mer och jag tror man ska se uppgångar som säljtillfällen. Crop condition börjar rapporteras den 9 juni.
Sojabönor
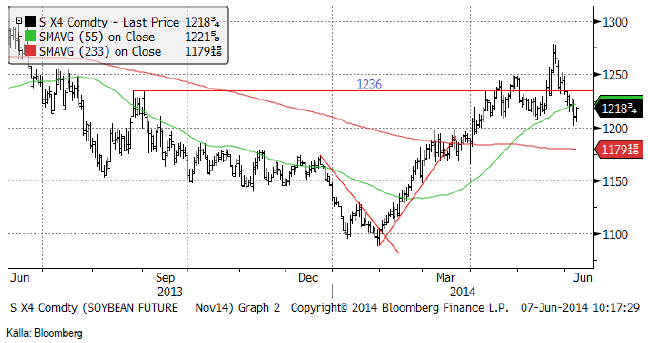
Med 36.5 miljoner färre grisar i Kina nu jämfört med november är det svårt att se varför sojamjöl ska fortsätta att haussa på pris över 400 dollar per short ton. Det tyckte marknaden också och vände ner från 1275 cent per bushel för novemberkontraktet till 1218 i fredags. Liksom vete och majs, steg priset inför stängning före helgen. Om detta betyder något inför veckan som kommer är svårt att säga. Det kan handla om spekulanter som stänger riskpositioner (kort) inför en långhelg.
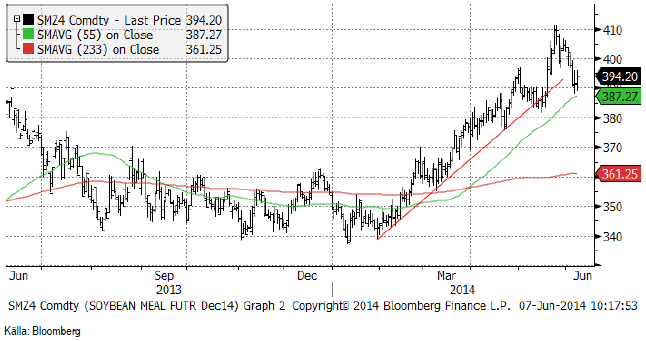
Sojamjölet föll tillbaka tilll 390 dollar, där marknaden fann stöd.
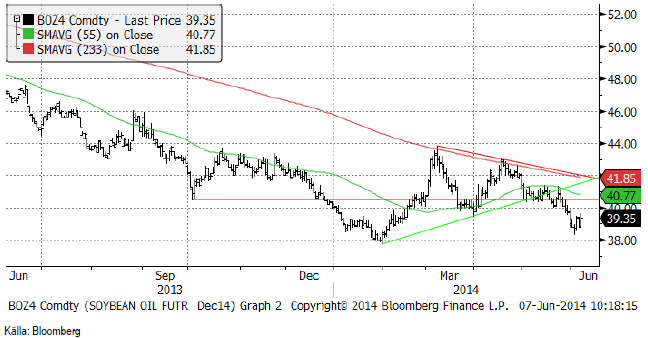
Sojaoljan har rent tekniskt brutit stödet det vilade mot, fallit ner nästan till stödet och den riktiga botten på 38 dollar. Därefter har en liten rekyl uppåt kommit. Det är ett klassiskt mönster. Om historien upprepar sig kommer vi att få se ett nytt test av botten på 38 och ett brott nedåt från den nivån.
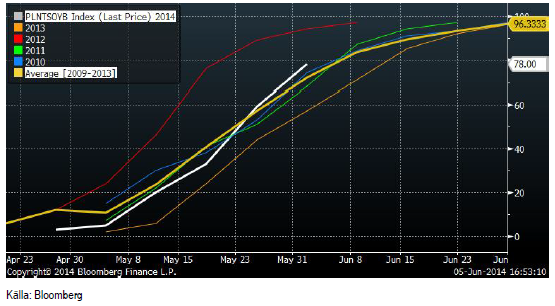
Sådden av sojabönor har kommit till 78% sått. Därmed är sådden praktiskt taget klar och detta något tidigare än ”normalt”.
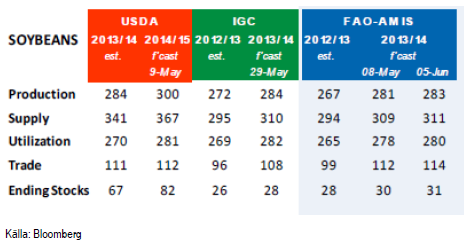
AMIS justerar upp även sojaskörden och justerar även upp utgående lager från 30 mt till 31 mt.
Vi tycker inte att något har förändrat sig. Konsumtionstillväxten i Kina borde fortsätta att mattas och skörden borde fortsätta att justeras upp. Gammal skörd är alltjämt ”tight” och det kanske hänger kvar så länge situationen i den är aktuell. Så vi fortsätter att rekommendera sälj på sojabönor (november). Crop condition för sojabönor börjar rapporteras den 9 juni.
Raps
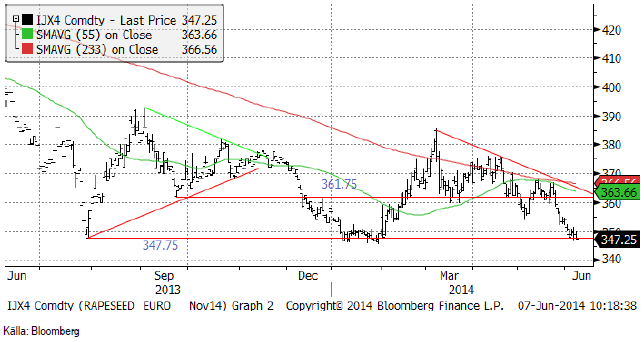
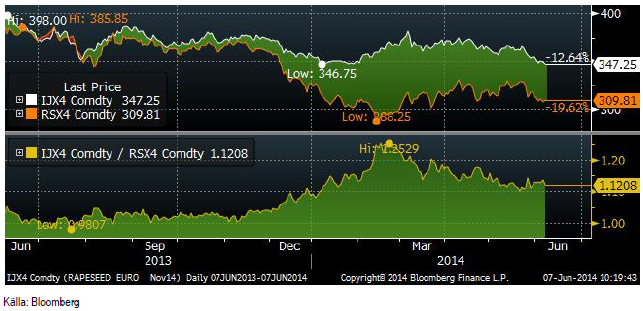
Novemberkontraktet på Matif föll hela vägen ner till ”den absoluta botten” på 347.75 euro. Faktum är, som vi ser i diagrammet nedan, att priset i fredags faktiskt stängde under den nivå som priset inte skulle kunna gå under. Det gjorde priset i och för sig även i januari, så vi har inte något riktigt brott nu. Det naturliga i lägen som dessa är att köpare tycker att det är billigt samtidigt som lantbrukare avhåller sig från att sälja därför att det är för billigt, i deras ögon. Så får vi en rekyl uppåt. Min till skillnad från läget i vete, tror jag inte att det är en lika allmän uppfattning bland lantbrukare att raps är för billigt på 347 euro. En del kan nog tänka sig att sälja även på den här nivån, så gissningsvis får vi nu ett brott nedåt och om det sker kan det gå fort utför.
Rapsterminerna handlas med contango, samtidigt som sojaterminerna handlas med mycket kraftig backwardation. Detta gäller inte bara gammal skörd – ny skörd, utan för flera år framöver. Detta är orimligt. Eftersom sojabönorna är den stora grödan, faller domen på rapsmarknaden. Det borde inte vara contango i den – och det gör att ju längre löptiden är på rapsterminerna, desto mer ”fel” ligger priset.
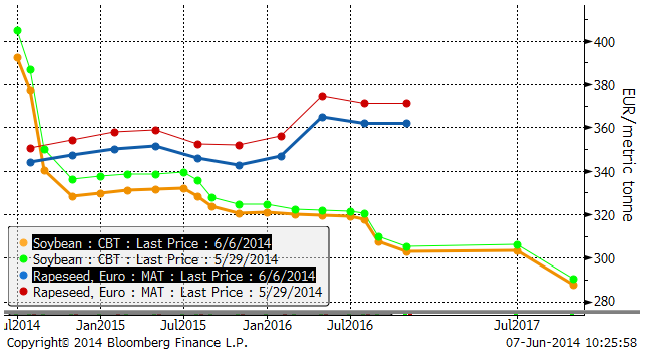
Skillnaden mellan kanadensisk canola i eurotermer och Matifs rapskontrakt (båda för novemberleverans) är på ungefär samma nivå som den varit den senaste månaden. Det verkar inte som om spreaden vill gå ihop längre.
Vi fortsätter med sälj på rapsfrö.
Potatis
För två veckor sedan när potatispriset befann sig i fritt fall vid 11.50 euro per deciton, skrev vi att priset troligtvis skulle fortsätta falla i det korta perspektivet. Prisfallet kunde ha nått till 10 euro, men det stannade upp vid 10.40. Därefter har trenden vänt, till en häftig rekyl. Antagligen är det stora konsumenter av industripotatis som tyckte att priset var gefundenes Fressen. Rekylen uppåt kan nog fortsätta några dagar, men på lite längre sikt är faktum att det regnar bra överallt i marknadsområdet och det gynnar volymen.
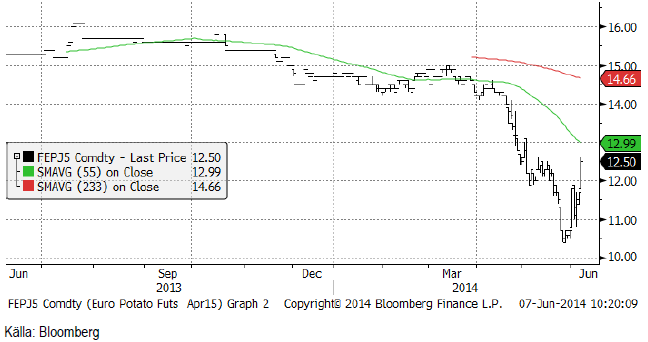
Nedan ser vi den senaste månadens avvikelse från normal nederbörd i Europa. I marknadsområdet där potatis odlas har det regnat mer än normalt, vilket ger en högre skörd.

På kort sikt är vi alltså positiva till potatisprisets utveckling, men med den prognos om nederbörd som finns, är det svårt att se någon stor prisuppgång. Från och med tisdag kan man investera i potatis på Stockholmsbörsen via SEB:s certifikat ”POTATIS S”, som följer aprilkontraktet 1 till 1.
Gris
Marknaden blev överraskad av att USDA hog slaughter-statistik i fredags kväll (20:00 svensk tid), kom in på 319,000 när de två veckor innan legat på 411,000.
The PigSite skrev i måndags om att Kina har 36.5 miljoner färre grisar på gårdarna än när man hade som mest, i november. Hjorden är 8.5% mindre än vid det rekordet. The PigSite rapporterar att detta beror på att uppfödare har svårt att täcka kostnaderna. Frågan är vem som äter allt sojamjöl till över 400 dollar per short ton?
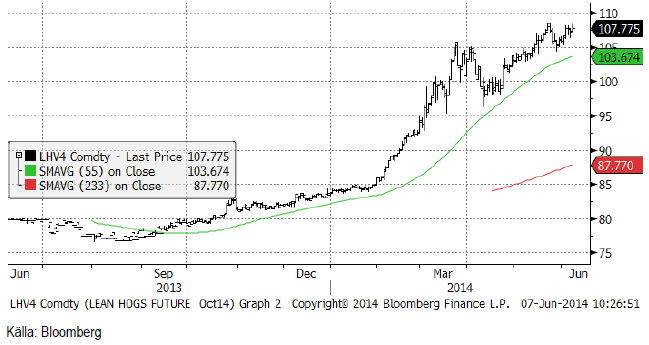
Spotkontraktet på EUREX Hogs sjönk från 1.63 euro per Kg för en vecka sedan till 1.61 euro i fredags.
Mjölk
Priserna på tisdagens Global Dairy Trade föll för åttonde gången i rad och nedgångsfasen tangerar därmed rekordet från hösten sommaren till hösten 2011. Prisfallet nu, överträffar faktiskt det förra rekordet genom att falla 25%, som är betydligt mer än då. WMP har fallit 29%, varav 8.5% i tisdags.
De höga priserna som har varit och de allmänna rosenröda förväntningar på att Kina ska sluka oändligt med mjölkprodukter, har stimulerat produktionen inte bara i EU, utan även Nya Zeeland och Australien. Säsongen 2013/14 slutade i Nya Zeeland förra helgen med en produktionsökning på 7%. Australiens produktion i april var 5.6% högre än förra året. Enligt USDA:s jordbruksattaché i Canberra, som publicerade en rapport på USDA FAS för en vecka sedan kommer Australiens produktion att öka med 5.3% till 9.9 miljarder kilo i år.
Kinas tillväxt sjunker och fastighetsmarknaden står inför ett trendskifte. Efter att ha varit en källa till förmögenhetsuppbyggnad har den nu blivit en förmögenhetsförstörare för den som råkar äga en fastighet.
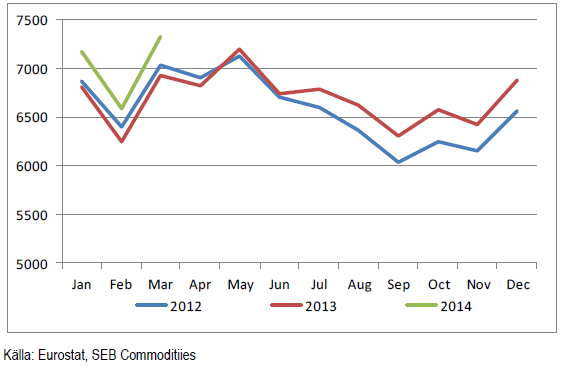
Produktionen ökar även i Europa. Nedan ser vi produktionen per månad i tusen ton mjölkråvara för några länder (Sverige, Finland, Danmark, Tyskland, Holland, Belgien och Frankrike) i norra Europa, Frankrike dock inkluderat. Det är i princip dessa länder som utgör marknadsområdet för EUREX terminshandel på smör och skummjölkspulver. Data sträcker sig fram till och med mars 2014. Produktionen i mars 2014 var 5.8% högre för dessa länder, som ligger i vad som börjar kallas för ”mjölkbältet” i Europa.
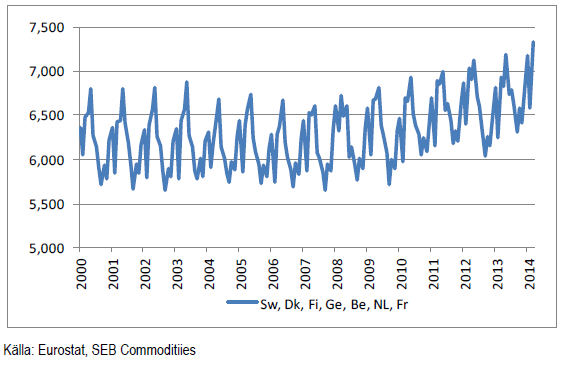
Mjölkbältet är inte någon ny företeelse, som det påstås då och då, orsakat av ”klimatförändringen”. Redan Tacitus skrev i Germania att germanerna höll sig med kor, huvudsakligen. Rom hade olivolja som bränsle, tvål och matolja. Germanerna hade smör, till ungefär samma ändamål. Klimatet i mjölkbältet har alltid gett mjölkproduktion en komparativ fördel och med dagens transportmöjligheter är det sannolikt att mjölkproduktionen i EU kommer att koncentreras till den delen som faktiskt för år 0 – år 1000 eKr behärskades av ko-älskande germaner, dvs Tyskland, Frankrike, Holland, Belgien, England, Danmark och södra Sverige. Även Polen och Irland får väl sägas höra till samma kultursfär, som också tillhör mjölkbältet.
Stimulansen till ökad produktion som de prisuppgången från botten 2012 gav, började märkas sommaren 2013. Ökningstakten accelererar nu, trots att priserna är lite lägre. Produktionsförändringar sker alltså med viss eftersläpning i förhållande till priset. Den högre produktionen nu bidrar nog också till att sätta press på priset.
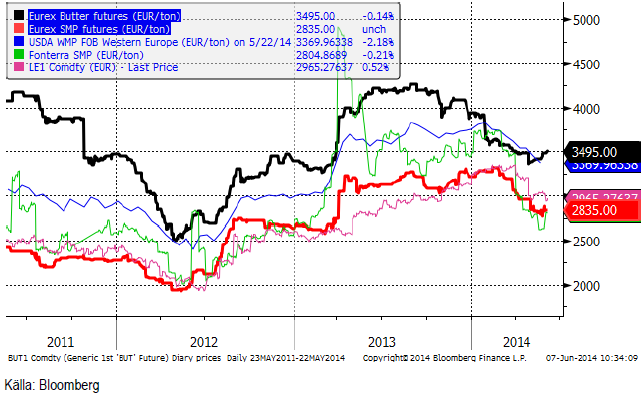
Vi har sett en ganska kraftig korrektion nedåt på skummjölkspulver och framförallt på smör även på Eurex. Vi ser prisutvecklingen nedan. Terminerna på smör har dock hämtat sig något från botten för ungefär en månad sedan. Som vi har sett på Arlanoteringen har denna bara för någon månad sedan börjat sjunka, trots att t ex smörpriset på terminsmarknaden toppade ur redan i slutet av sommaren förra året och SMP i början av året.
Terminspriserna på EUREX har gått upp de senaste två veckorna. Framförallt är det liksom förut terminer med längre löptider som går upp. Marknaden räknar troligtvis med att mejeriernas lägre avräkningspris nu, som görs med fördröjning i förhållande till terminsmarknaden, ska dämpa produktionsökningen. Det är dock inte säkert att detta sker, då allt fler hämtar sin prisinformation inte bara från mejeriernas aktuella pris utan även från terminsmarknaden på EUREX – där man alltså ser ganska attraktiva priser. Oktober månads pris kan man alltså sälja på över 3.90 kr / Kg. SEB ”bättrar” den köpkurs som finns på EUREX, så en mjölkbonde kan alltså sälja oktober månads termin för nästan 4 kr / Kg.
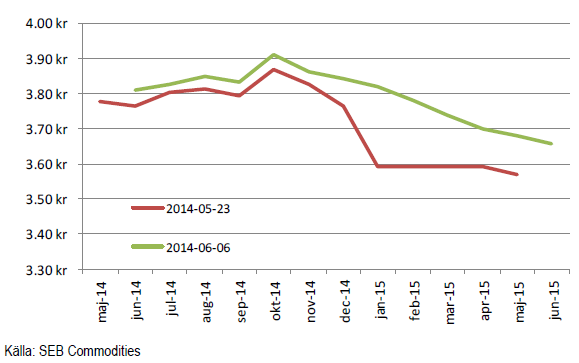
Läget är alltså bra för att prissäkra mjölk. Det är inte säkert att det alltid kommer att vara det.
Socker
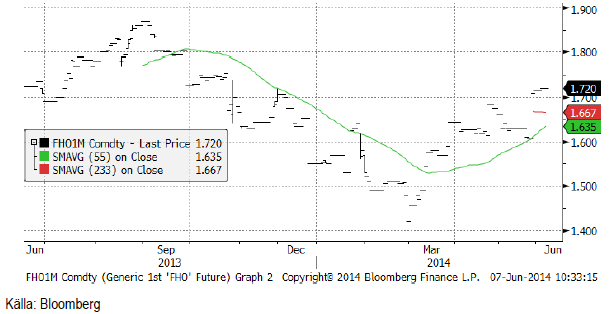
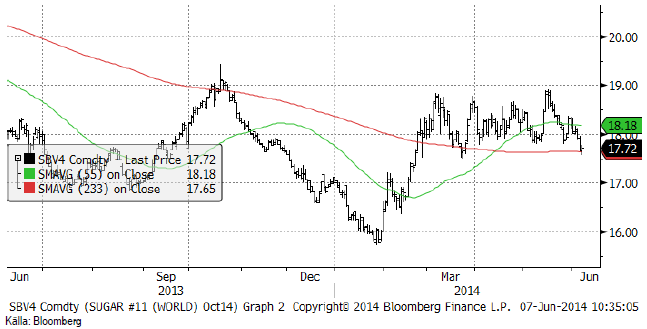
Vi går nu över från att följa juli-kontraktet på råsocker till att följa oktober-kontraktet, SBV4. Som vi ser lyckades inte priset gå över 19 cent vid det senaste försöket att stiga. Som vanligt när luften går ur ett försök att bryta sig ur dödläget blir motreaktionen å andra hållet lite kraftigare. Priset stängde i fredags på 17.72 cent per halvkilo. Priset ligger fortfarande inom den ”trading range” som priset pendlat inom sedan början på mars.
Brasiliens jordbruksminister Neri Geller sade i tisdags att regeringen överväger att öka inblandningen av etanol i bensinen från 25 till 27.5%. Förra veckan fattades beslut att öka inblandningen av biodiesel i dieseln till 7%.
I brist på nyheter av avgörande slag, fortsätter vi med neutral rekommendation.
[box]SEB Veckobrev Jordbruksprodukter är producerat av SEB Commodities Sales desk och publiceras i samarbete och med tillstånd på Råvarumarknaden.se[/box]
Detta marknadsföringsmaterial, framtaget av SEB’s Commodities Sales desk, har upprättats enbart i informationssyfte.
Även om innehållet är baserat på källor som SEB bedömt som tillförlitliga ansvarar SEB inte för fel eller brister i informationen. Den utgör inte oberoende, objektiv investeringsanalys och skyddas därför inte av de bestämmelser som SEB har infört för att förebygga potentiella intressekonflikter. Yttranden från SEB’s Commodities Sales desk kan vara oförenliga med tidigare publicerat material från SEB, då den senare hänvisas uppmanas du att läsa den fullständiga rapporten innan någon åtgärd vidtas.
Dokumentationen utgör inte någon investeringsrådgivning och tillhandahålls till dig utan hänsyn till dina investeringsmål. Du uppmanas att självständigt bedöma och komplettera uppgifterna i denna dokumentation och att basera dina investeringsbeslut på material som bedöms erforderligt. Alla framåtblickande uttalanden, åsikter och förväntningar är föremål för risker, osäkerheter och andra faktorer och kan orsaka att det faktiska resultatet avviker väsentligt från det förväntade. Historisk avkastning är ingen garanti för framtida resultat. Detta dokument utgör inte ett erbjudande att teckna några värdepapper eller andra finansiella instrument. SEB svarar inte för förlust eller skada – direkt eller indirekt, eller av vad slag det vara må – som kan uppkomma till följd av användandet av detta material eller dess innehåll.
Observera att det kan förekomma att SEB, dess ledamöter, dess anställda eller dess moder- och/eller dotterbolag vid olika tillfällen innehar, har innehaft eller kommer att inneha aktier, positioner, rådgivningsuppdrag i samband med corporate finance-transaktioner, investment- eller merchantbankinguppdrag och/eller lån i de bolag/finansiella instrument som nämns i materialet.
Materialet är avsett för mottagaren, all spridning, distribuering mångfaldigande eller annan användning av detta meddelande får inte ske utan SEB:s medgivande. Oaktat detta får SEB tillåta omfördelning av materialet till utvald tredje part i enlighet med gällande avtal. Materialet får inte spridas till fysiska eller juridiska personer som är medborgare eller har hemvist i ett land där sådan spridning är otillåten enligt tillämplig lag eller annan bestämmelse.
Skandinaviska Enskilda Banken AB (publ) är ett [publikt] aktiebolag och står under tillsyn av Finansinspektionen samt de lokala finansiella tillsynsmyndigheter i varje jurisdiktionen där SEB har filial eller dotterbolag.


The latest weekly report from the US DOE showed a substantial drawdown across key petroleum categories, adding more upside potential to the fundamental picture.

Commercial crude inventories (excl. SPR) fell by 5.8 million barrels, bringing total inventories down to 415.1 million barrels. Now sitting 11% below the five-year seasonal norm and placed in the lowest 2015-2022 range (see picture below).
Product inventories also tightened further last week. Gasoline inventories declined by 2.1 million barrels, with reductions seen in both finished gasoline and blending components. Current gasoline levels are about 3% below the five-year average for this time of year.
Among products, the most notable move came in diesel, where inventories dropped by almost 4.1 million barrels, deepening the deficit to around 20% below seasonal norms – continuing to underscore the persistent supply tightness in diesel markets.
The only area of inventory growth was in propane/propylene, which posted a significant 5.1-million-barrel build and now stands 9% above the five-year average.
Total commercial petroleum inventories (crude plus refined products) declined by 4.2 million barrels on the week, reinforcing the overall tightening of US crude and products.


A classic case of “buy the rumor, sell the news” played out in oil markets, as Brent crude has dropped sharply – down nearly USD 10 per barrel since yesterday evening – following Iran’s retaliatory strike on a U.S. air base in Qatar. The immediate reaction was: “That was it?” The strike followed a carefully calibrated, non-escalatory playbook, avoiding direct threats to energy infrastructure or disruption of shipping through the Strait of Hormuz – thus calming worst-case fears.
After Monday morning’s sharp spike to USD 81.4 per barrel, triggered by the U.S. bombing of Iranian nuclear facilities, oil prices drifted sideways in anticipation of a potential Iranian response. That response came with advance warning and caused limited physical damage. Early this morning, both the U.S. President and Iranian state media announced a ceasefire, effectively placing a lid on the immediate conflict risk – at least for now.
As a result, Brent crude has now fallen by a total of USD 12 from Monday’s peak, currently trading around USD 69 per barrel.
Looking beyond geopolitics, the market will now shift its focus to the upcoming OPEC+ meeting in early July. Saudi Arabia’s decision to increase output earlier this year – despite falling prices – has drawn renewed attention considering recent developments. Some suggest this was a response to U.S. pressure to offset potential Iranian supply losses.
However, consensus is that the move was driven more by internal OPEC+ dynamics. After years of curbing production to support prices, Riyadh had grown frustrated with quota-busting by several members (notably Kazakhstan). With Saudi Arabia cutting up to 2 million barrels per day – roughly 2% of global supply – returns were diminishing, and the risk of losing market share was rising. The production increase is widely seen as an effort to reassert leadership and restore discipline within the group.
That said, the FT recently stated that, the Saudis remain wary of past missteps. In 2018, Riyadh ramped up output at Trump’s request ahead of Iran sanctions, only to see prices collapse when the U.S. granted broad waivers – triggering oversupply. Officials have reportedly made it clear they don’t intend to repeat that mistake.
The recent visit by President Trump to Saudi Arabia, which included agreements on AI, defense, and nuclear cooperation, suggests a broader strategic alignment. This has fueled speculation about a quiet “pump-for-politics” deal behind recent production moves.
Looking ahead, oil prices have now retraced the entire rally sparked by the June 13 Israel–Iran escalation. This retreat provides more political and policy space for both the U.S. and Saudi Arabia. Specifically, it makes it easier for Riyadh to scale back its three recent production hikes of 411,000 barrels each, potentially returning to more moderate increases of 137,000 barrels for August and September.
In short: with no major loss of Iranian supply to the market, OPEC+ – led by Saudi Arabia – no longer needs to compensate for a disruption that hasn’t materialized, especially not to please the U.S. at the cost of its own market strategy. As the Saudis themselves have signaled, they are unlikely to repeat previous mistakes.
Conclusion: With Brent now in the high USD 60s, buying oil looks fundamentally justified. The geopolitical premium has deflated, but tensions between Israel and Iran remain unresolved – and the risk of missteps and renewed escalation still lingers. In fact, even this morning, reports have emerged of renewed missile fire despite the declared “truce.” The path forward may be calmer – but it is far from stable.
Analys
A muted price reaction. Market looks relaxed, but it is still on edge waiting for what Iran will do
Brent crossed the 80-line this morning but quickly fell back assigning limited probability for Iran choosing to close the Strait of Hormuz. Brent traded in a range of USD 70.56 – 79.04/b last week as the market fluctuated between ”Iran wants a deal” and ”US is about to attack Iran”. At the end of the week though, Donald Trump managed to convince markets (and probably also Iran) that he would make a decision within two weeks. I.e. no imminent attack. Previously when when he has talked about ”making a decision within two weeks” he has often ended up doing nothing in the end. The oil market relaxed as a result and the week ended at USD 77.01/b which is just USD 6/b above the year to date average of USD 71/b.

Brent jumped to USD 81.4/b this morning, the highest since mid-January, but then quickly fell back to a current price of USD 78.2/b which is only up 1.5% versus the close on Friday. As such the market is pricing a fairly low probability that Iran will actually close the Strait of Hormuz. Probably because it will hurt Iranian oil exports as well as the global oil market.
It was however all smoke and mirrors. Deception. The US attacked Iran on Saturday. The attack involved 125 warplanes, submarines and surface warships and 14 bunker buster bombs were dropped on Iranian nuclear sites including Fordow, Natanz and Isfahan. In response the Iranian Parliament voted in support of closing the Strait of Hormuz where some 17 mb of crude and products is transported to the global market every day plus significant volumes of LNG. This is however merely an advise to the Supreme leader Ayatollah Ali Khamenei and the Supreme National Security Council which sits with the final and actual decision.
No supply of oil is lost yet. It is about the risk of Iran closing the Strait of Hormuz or not. So far not a single drop of oil supply has been lost to the global market. The price at the moment is all about the assessed risk of loss of supply. Will Iran choose to choke of the Strait of Hormuz or not? That is the big question. It would be painful for US consumers, for Donald Trump’s voter base, for the global economy but also for Iran and its population which relies on oil exports and income from selling oil out of that Strait as well. As such it is not a no-brainer choice for Iran to close the Strait for oil exports. And looking at the il price this morning it is clear that the oil market doesn’t assign a very high probability of it happening. It is however probably well within the capability of Iran to close the Strait off with rockets, mines, air-drones and possibly sea-drones. Just look at how Ukraine has been able to control and damage the Russian Black Sea fleet.
What to do about the highly enriched uranium which has gone missing? While the US and Israel can celebrate their destruction of Iranian nuclear facilities they are also scratching their heads over what to do with the lost Iranian nuclear material. Iran had 408 kg of highly enriched uranium (IAEA). Almost weapons grade. Enough for some 10 nuclear warheads. It seems to have been transported out of Fordow before the attack this weekend.
The market is still on edge. USD 80-something/b seems sensible while we wait. The oil market reaction to this weekend’s events is very muted so far. The market is still on edge awaiting what Iran will do. Because Iran will do something. But what and when? An oil price of 80-something seems like a sensible level until something do happen.


USA ska införa 50 procent tull på koppar

Ryska staten siktar på att konfiskera en av landets största guldproducenter

Hur säkrar vi Sveriges tillgång till kritiska metaller och mineral i en ny geopolitisk verklighet?

Lundin Mining ska bli en av de tio största kopparproducenterna i världen

Sommarvädret styr elpriset i Sverige

Mahvie Minerals växlar spår – satsar fullt ut på guld

Uppgången i oljepriset planade ut under helgen

Låga elpriser i sommar – men mellersta Sverige får en ökning

Oljan, guldet och marknadens oroande tystnad
A muted price reaction. Market looks relaxed, but it is still on edge waiting for what Iran will do
-
 Nyheter3 veckor sedan
Mahvie Minerals växlar spår – satsar fullt ut på guld
-
 Nyheter4 veckor sedan
Uppgången i oljepriset planade ut under helgen
-
 Nyheter4 veckor sedan
Låga elpriser i sommar – men mellersta Sverige får en ökning
-
 Nyheter3 veckor sedan
Oljan, guldet och marknadens oroande tystnad
-
Analys3 veckor sedan
A muted price reaction. Market looks relaxed, but it is still on edge waiting for what Iran will do
-

 Nyheter3 veckor sedan
Jonas Lindvall är tillbaka med ett nytt oljebolag, Perthro, som ska börsnoteras
-
Analys4 veckor sedan
Very relaxed at USD 75/b. Risk barometer will likely fluctuate to higher levels with Brent into the 80ies or higher coming 2-3 weeks
-

 Nyheter3 veckor sedan
Domstolen ger klartecken till Lappland Guldprospektering