

Analys
SEB – Råvarukommentarer, 9 juni 2014

Rekommendationer
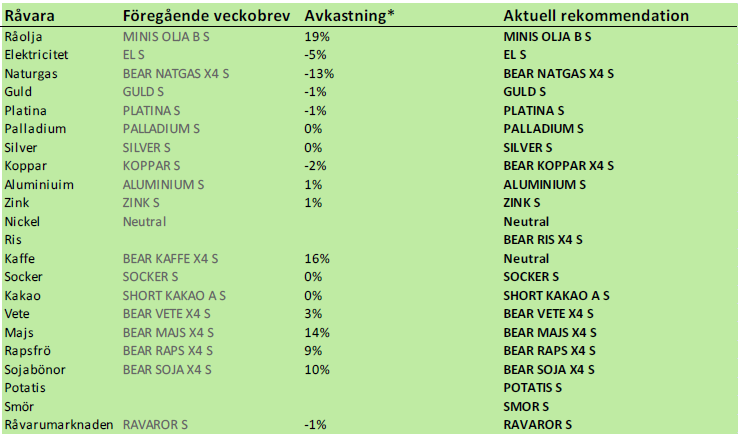
Kort sammanfattning
Den här veckan finns tre nya råvaror att placera i. Det är ris, potatis och smör. Vi rekommenderar sälj på ris, och köp på potatis och smör, alltså BEAR RIS X4 S, POTATIS S och SMOR S.
Nyheterna på kopparmarknaden är kortsiktigt negativa, men långsiktigt positiva. I övrigt var det ganska lugnt på basmetallmarknaden. På ädelmetallmarknaden noterar vi ett fall i guldpriset, men styrka i silver, platina och palladium. Vi tror att prisfallet i guld berodde på en stor säljorder vars påverkan på marknaden kanske ännu inte är slut.
Vi har sett stora prisfall på spannmål och oljeväxter. Jag tror att prisfallet fortsätter på raps och sojabönor, medan det kan bli en rekyl uppåt på vete och majs. Globalt odlingsväder är överlag bra, men priserna har justerats ner och det börjar dyka upp orosmoln på väderhimlen.
Råolja – Brent
Marknadsbedömare har den senaste tiden varit tämligen positiva till olja, som dock genbördat genom att sjunka i pris. Oljepriset tycks vara stadigt etablerat inom ett intervall om 105 – 112 dollar per fat.
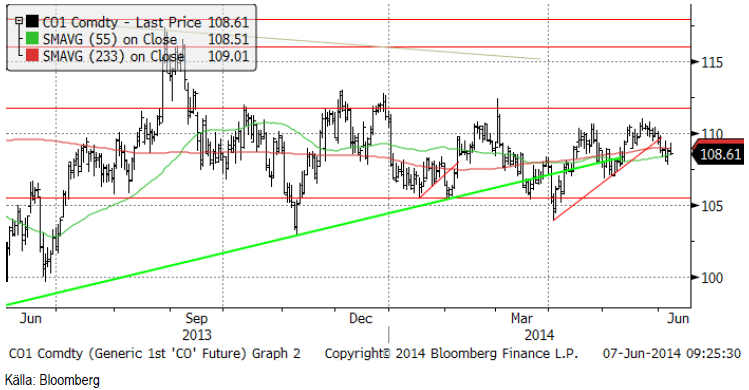
Råoljelagren fortsätter att minska, enligt säsongens kända mönster. Lagren är dock i nivå med förra årets rekordhöga nivåer.
Vi rekommenderar en kort position i olja, t ex med MINIS OLJA B S eller MINIS OLJA A S.
Elektricitet
Fjärde kvartalets eltermin får vi studera nu, när certifikatens underliggande terminskontrakt är rullat in i den. Nedan ser vi ett kursdiagram. Brottet uppåt följdes inte av en ny trend uppåt, utan var en ur teknisk synvinkel så kallat falskt utbrott. Besvikelsen över sådana brukar kunna leda till en (över) reaktion åt andra hållet, i det här fallet nedåt. Vi har sett marknaden sjunka förra veckan och stöd finns precis under. Skulle detta brytas, kan vi nog få en lite längre nedgång kanske mot 31 euro från 32.26 i fredags.
GFS-prognosen för nederbörden de kommande två veckorna visar som vi ser nedan under Odlingsväder, ökad nederbörd över de norska och svenska fjällen.
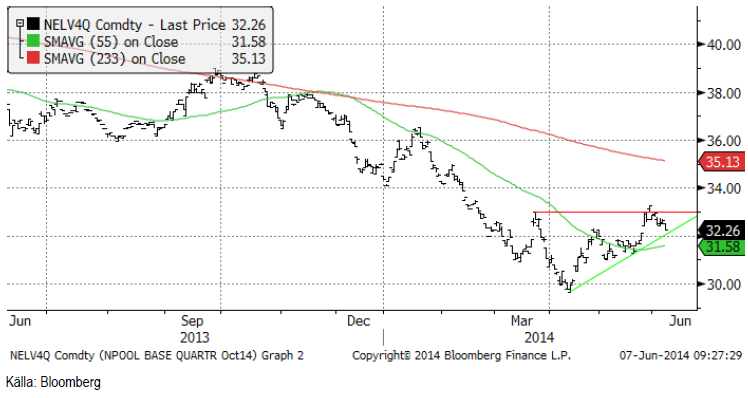
Vi behåller köprekommendationen, men skulle det tekniska stödet (grön linje i diagrammet ovan) brytas, går vi över till neutral.
Naturgas
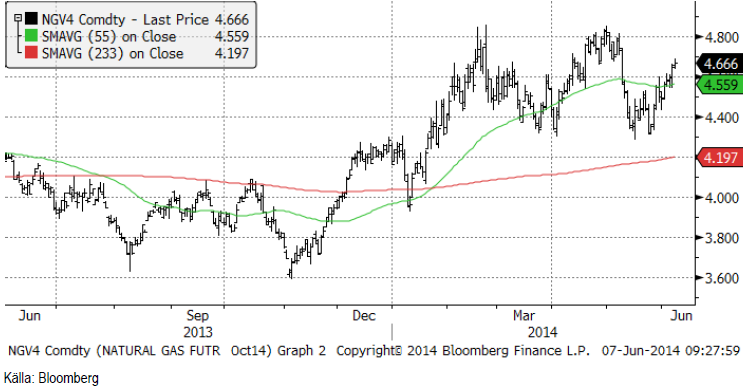
Vi lämnar nu julikontraktet på naturgas och tittar på oktoberkontraktet, NGV4. Detta ser ut att vara på väg uppåt, kanske till 4.80 dollar per MMBtu. Där tror vi det kan vara läge att sälja naturgas.
Koppar
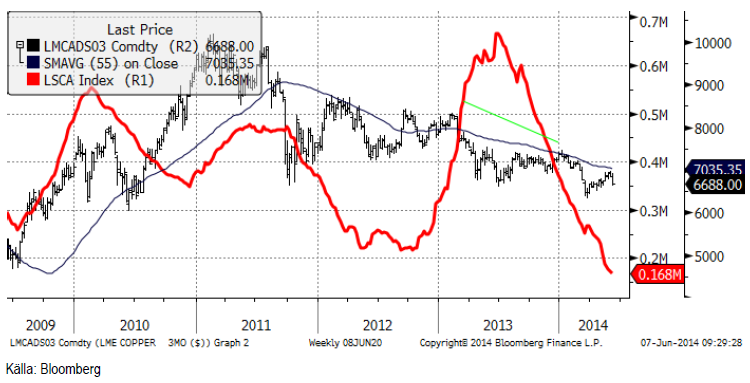
Tremånadersterminen föll med 2% i veckan som gick. Orsaken är att hamnen i Qingdao i Kina har inlett undersökning av metall som är pantsatt som säkerhet för de ”finansieringsaffärer”. Misstanken är att metall i lager pantsatts i mer än en finansieringsaffär. Det är mycket populärt att belåna råvaror i lager i Kina och stora mängder råvaror, allt från sojabönor till järnmalm är lagrade mot billig finansiering på det här sättet. Det är något förvånande att detta sker, eftersom det inte finns något terminspåslag i flera av de här råvarorna längre. Det borde alltså inte gå att tjäna pengar på att låna pengar, köpa metall och sälja den på termin. Undersökningen av hamnen i Qingdao kanske är början på slutet på den här metallefterfrågan – och det fick alltså kopparmarknaden på fall. Ungefär 1 miljon ton koppar kan ligga ”låst” i kinesiska finansieringsaffärer (utanför LME:s och Shanghaibörsens lager) enligt Goldman Sachs.
Den andra stora nyheten på kopparmarknaden har mer långsiktiga implikationer. Chefen för det chilenska statliga koppargruvebolaget Codelco fick sparken av styrelsen i veckan som gick. Styrelsen representerar den nya socialistiska regeringen som tillträdde i april under ledning av Bachelet. VD:n för Codelco Thomas Keller som tillträdde för två år sedan ville effektivisera gruvdriften, hålla lönekostnaderna under kontroll och genomföra det största investeringsprogrammet sedan Codelco bildades 1976 med syfte att behålla produktionen intakt. Bland annat ville han utveckla underjordsdrift vid dagbrottsgruvan Chuquicamata, en gruva som dåvarande presidenten Salvador Allende exproprierade (stal med andra ord) år 1971 från de båda amerikanska gruvbolagen Anaconda Corp och Kennecott Corp.
Vinsterna från Codelco (med av ovan beskrivna förklarliga skäl lågt ”capex”) har till mindre del gått till återinvestering i gruvproduktionen. Huvuddelen har gått till sociala projekt i landet och en viss del har fonderats, på liknande sätt som många oljeländer gjort. Priset på koppar har dock sedan 2011 fallit så lågt att Codelco bara nätt och jämnt går runt, vilket skapat en politiskt svår situation. Den nya regeringen prioriterar uppenbarligen ett kassaflöde från bolaget på bekostnad av framtida intäkter.
Detta borde återspegla sig i högre terminspriser för leverans i framtiden.
Av dessa två nyheter i veckan, är Kinas undersökning av finansieringsaffärerna kortsiktigt negativ, men den Chilenska historien positiv. Det innebär, tycker vi, att man ska utnyttja kortsiktig svaghet i marknaden till att gå lång.
Tekniskt ser det ut som kopparmarknadens uppgång är över. Det är möjligt att priset faller ner till botten för året och testar den nivån. Kortsiktigt bör man undvika att sälja och vi rekommenderar neutral eller en kort position i t ex BEAR KOPPAR X4 S.
Aluminium
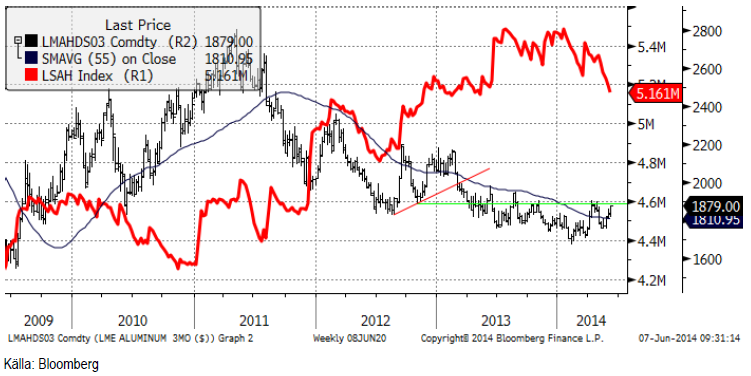
Aluminium har tagit sig upp till motståndet vid 1900 dollar per ton. Lagren vid LME minskar kraftigt, men från mycket hög nivå.
Vi fortsätter alltså med köprekommendation på ALUMINIUM S.
Zink
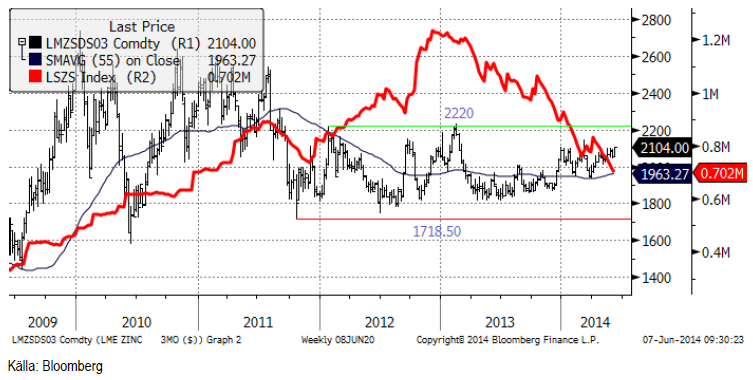
Zinkmarknaden stärktes i veckan som gick, samtidigt som lagren fortsatte falla. Vi behåller köprekommendationen på zink och rekommendationen av ZINK S.
Nickel
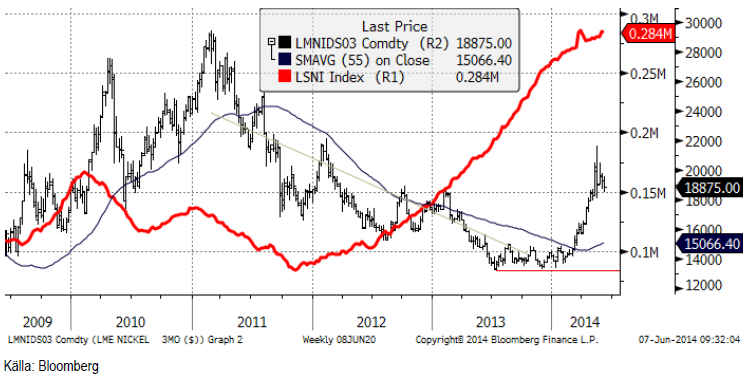
Nedan ser vi hur nickelpriset utvecklat sig de senaste fem åren. Efter den uppgång som blev följden av Indonesiens exportstopp, har marknaden lugnat ner sig. Även om exportstoppet innebar att den traditionella metoden att tillverka rostfritt stål som innebär priser på minst 16,000 dollar per ton på nickel är motiverat, har priset kommit upp så pass mycket att det i det korta perspektivet kan ha en del fallhöjd på 18,875 dollar per ton. Den lugna marknaden kanske bara är lugnet före stormen igen, så vi väljer att hålla fast vid förra veckobrevets neutral-rekommendation.
Guld
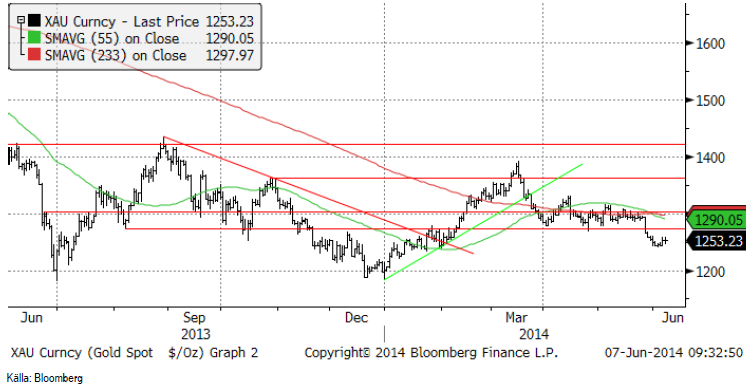
Guldmarknaden föll kraftigt för en dryg vecka sedan. Beteendet i marknaden tyder på att det var en stor försäljning från någon aktör, troligtvis en spekulant, eftersom både guld och platina påverkades samtidigt, men bara de två. Silver och palladium påverkades inte alls vid detta tillfälle. Vi tror inte att det var ett gruvbolag som sålde, eftersom de normalt sett inte prissäkrar och vanligtvis inte producerar både guld och platina. Vi tror alltså att nedgången från 1300 på guldet beror på ”market impact” från en kundorder. Frågan är om denna ”market impact” är historia nu, eller om det finns ytterligare lite nedsida.
När ECB sänkte räntan till negativ (men behöll reporäntan över nollan) i veckan, fick det guldpriset att stiga – i dollar. Euron föll först kraftigt mot dollarn men återhämtade sig sedan helt. Att guldpriset steg beror på att det finns de som tolkade ECB:s beslut som att ECB inte riktigt har kontroll över situationen i EU. Budgetunderskottet i t ex Frankrike beter sig precis som för ett år sedan, nästan exakt. Det syns alltså inte alls några tecken på någon sparsamhet. Räntorna i Spanien och Italien är dock tillbaka nere på riktigt låga nivåer, som om allt var säkert igen. Några i guldmarknaden tyckte inte det, och handlade upp guldet i torsdags och fredags.
Vi tycker inte att något har förändrats i grund och botten och är fortsatt försiktigt positiva till guldet.
Vi rekommenderar köp av GULD S.
Silver
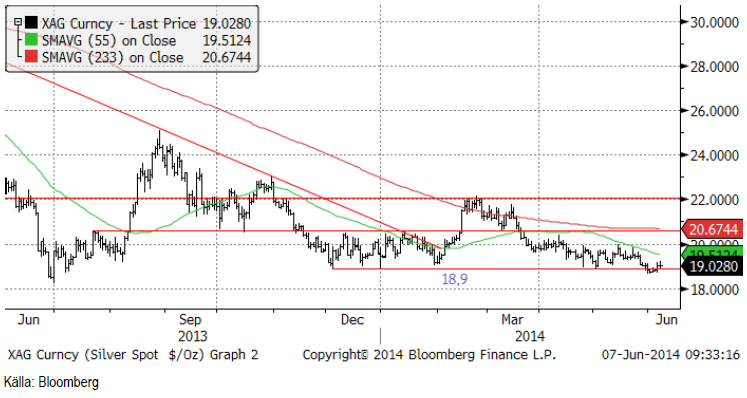
Silverpriset gick ner till stödet på 18.90 dollar per uns. Trots ett litet genombrott, föll inte priset, utan fyndköpare kom in och lyfte upp marknaden i samband med ECB:s räntebeslut. Vi tror att det var rätt och att man bör köpa silver nu.
Nedan ser vi ett diagram över priset på guld uttryckt i silver. Silver, som är billigt i förhållande till guld, har vunnit mark i förhållande till guldet. Vi tycker dock fortfarande att silver är mer köpvärt än guld.
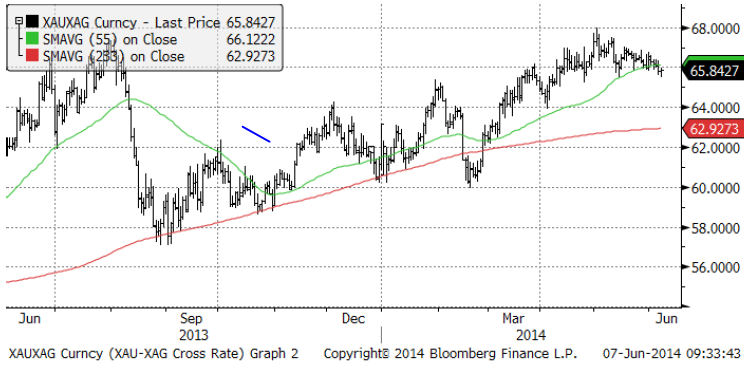
Vi anser att silver är mer köpvärt än guld och skulle vilja köpa på de här nivåerna. Vi rekommenderar köp av SILVER S.
Platina & Palladium
Strejkerna pågår fortfarande i Sydafrika. ECB-beslutet fick priset på platina att vända uppåt. Vi är fortsatt positiva till platina.
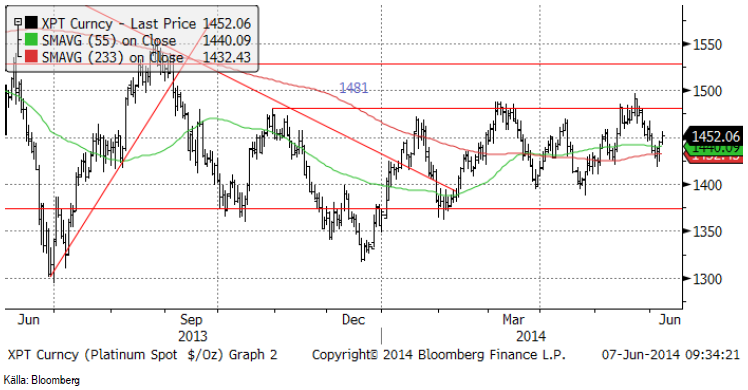
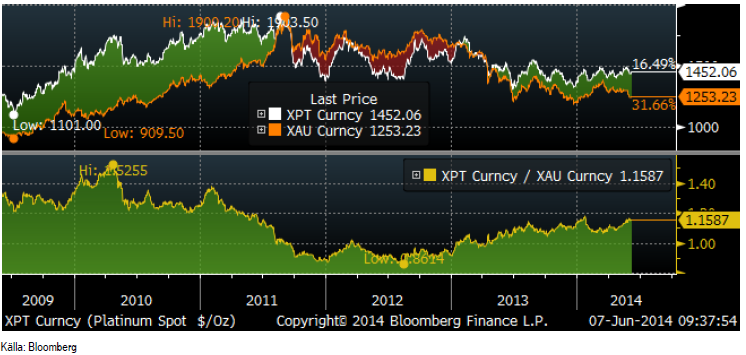
I diagrammet nedan ser vi hur platinapriset utvecklat sig i förhållande till guldpriset. Sedan 2012 har platina varit en bättre placering än guld.
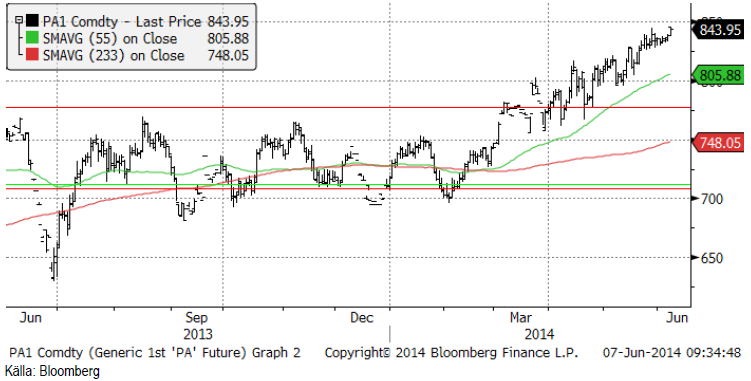
Prisdiagrammet på palladium ser vi nedan. Analytikern William Tankard från GFMS sade vid ett lunchseminarium på SEB att han trodde att palladium skulle handlas på samma nivå som platina om några år.
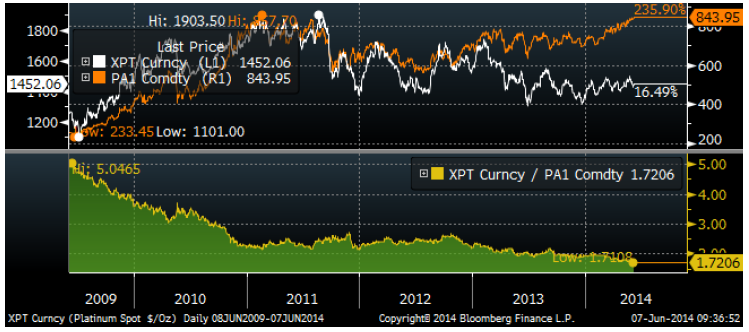
Nedanför ser vi fem års historik på skillnaden mellan platina och palladium. Vi ser att platina har gått från att vara 5 gånger dyrare än palladium. Just nu är försprånget 72%, men GFMS väntar sig att detta ska försvinna helt inom några år.
Vi rekommenderar köp av PLATINA S och PALLADIUM S.
Ris
Priset på ris (novemberkontraktet på CME) inledde juni månad med ett kraftigt prisfall från 14.50 till 14 cent per pund. Bakom ligger statistik om hög produktion både i Thailand och att USA:s ris är i utmärkt kondition.
Thailands export av ris under 2014 kommer att stiga till 9 miljoner ton enligt estimat från Thai Rice Exporters Association. I februari estimerades exporten till 7.5 miljoner ton. Om detta besannas kommer Thailand att gå om Indien som världens största exportör av ris.
USA:s risskörd var enligt crop condition-rapporten i månadags till 69% i good/excellent kondition.
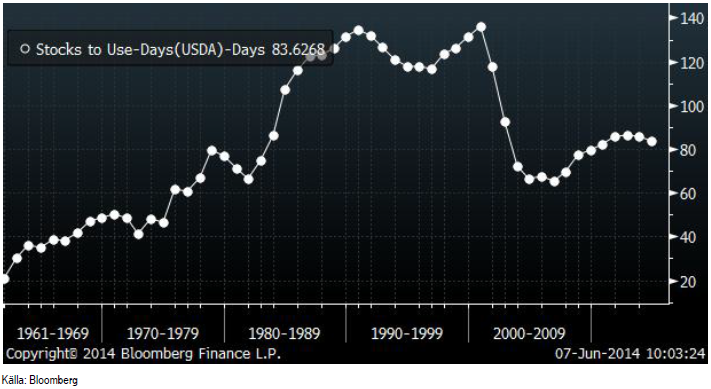
Globala lager innan årets skörd på norra halvklotet kommer redan att vara på den högsta nivån på 12 år enligt USDA:s senaste WASDE-rapport förra månaden. Priset på 5% brutna korn Thailändskt vitt ris, den asiatiska marknadens bechmark, har fallit med 28% det senaste året och med 62% från pristoppen år 2008.
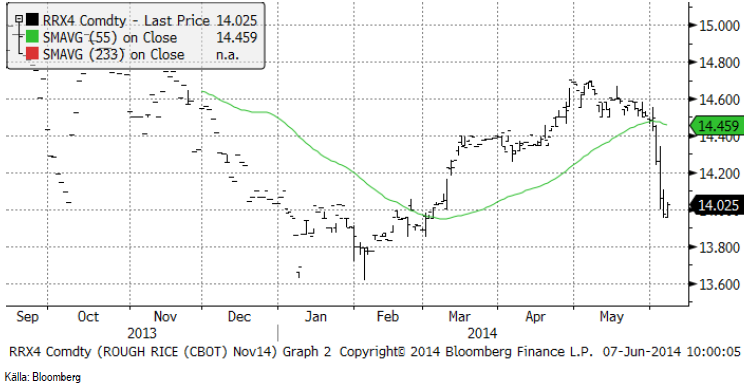
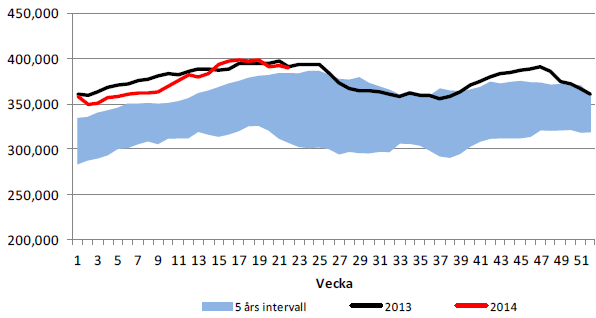
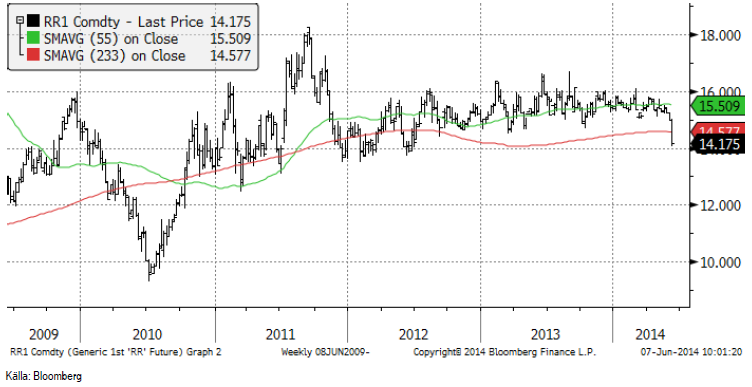
Nedan ser vi ett veckochart över prisutvecklingen de senaste fem åren. Som vi ser har priset varit ganska stabilt ända fram till förra veckan.
Nedan ser vi globala utgående lager i antal dagars konsumtion. Den sista punkten är baserad på estimatet i den senaste WASDE-rapporten från USDA (förra månaden).
Vi inleder bevakningen av rismarknaden med att rekommendera köp av BEAR RIS X4 S.
Kaffe
Den brasilianska kaffeskörden som började lite smått i april är nu i full fart. ”Vädret är idealiskt för att skörda, torka och rensa” rapporterar Flavour Coffee från Rio. Kaffebönderna har sålt en hel del av skörden, och det rapporteras från lokala firmor att de i veckan varit mindre intresserade av att sälja, eftersom priset gått ner.
Jordbruksdepartementet i Brasilien sade i tisdags att de första skörderapporterna tyder på att skörden kan bli högre än de 44.6 miljoner säckar som CONAB rapporterade vid förra månadens uppdatering av estimatet. Nederbörden den senaste månaden tycks ha minskat skadeverkningarna av torkan som drabbade Minas Gerais och Espirito Santo i januari och februari, den värsta torkan på 50 år. Jordbruksministern sade också att odlarna har tagit väl hand om sina kaffeträd, så Brasilien får en rekordskörd nästa år”.
Det finns också nyheter som är mer positiva för priset. Volcafé publicerade en rapport i veckan med ett estimat att kaffemarknaden går mot ett underskott på 11.3 miljoner säckar för marknadsföringsåret 2014/15, vilket huvudsakligen beror på den lägre produktionen av arabica i Brasilien. De estimerar att lagren faller från 51.5 miljoner säckar 2013/14 till 40.2 miljoner. Global produktion sjunker från 153.4 miljoner säckar 2013/14 till 140.2 miljoner säckar 2014/15. Samtidigt stiger konsumtionen från 148.7 till 151.5 miljoner säckar. Volcafé avslutar rapporten med att säga att kaffeefterfrågan stiger så fort att lagren vid slutet av 2014/15 kommer att vara på historiskt låga nivåer. Volcafés analytiker heter Kona Haque och vi har stort förtroende för henne, men hon har också haft en tendens att extrapolera trender lite för länge. T ex höll hon kvar säljrekommendationen på kaffe ganska länge i vintras, när andra började köpa för att kaffe var billigt i ett fundamentalt perspektiv.
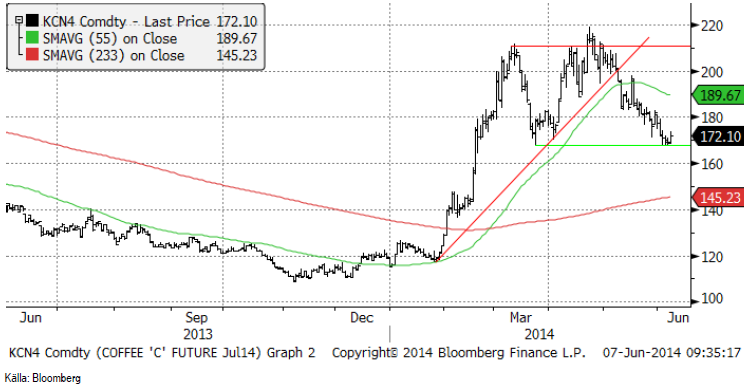
Tekniskt har stödet vid 168 cent hållit för juli-terminen och fredagens handel innebar kanske starten på en rekyl uppåt. Prisuppgången på kaffemarknaden har inte riktigt slagit igenom i konsumentledet och därmed inte heller påverkat konsumtionen, trots att det nästan är ett halvår sedan torkan drabbade Brasilien. Om det stämmer att bönderna inte vill sälja (just nu) vid 170 cent, så kanske priset kan gå upp lite grand.
Vi har haft en försiktig säljrekommendation, men går nu över till neutral.
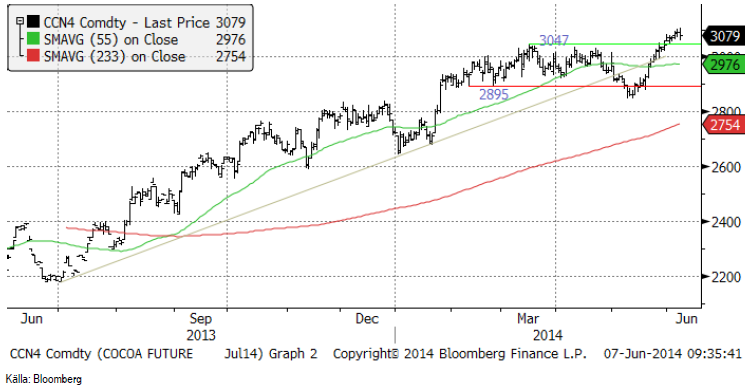
Kakao
Det höga priset på kakao lockar fram mer produktion och export. Indonesia Cocoa Association rapporterade i måndags (2 juni) att exporten från Sulawesi ökar från 3,919.8 ton i maj, upp från 3867.4 ton i april. Sulawesi står för huvuddelen av Indonesiens kakaoproduktion och Indonesien är världens tredje största producent efter Ghana och Elfenbenskusten.
Även från Ghana, världens näst största producent kom statistik på ökad produktion, upp med 5.9% till 900,000 ton, den högsta nivån på tre år. Perioden avser året som slutar den 30 september. Det tidigare estimatet på årets produktion var 850,000 ton.
Vi rekommenderar köp av SHORT KAKAO A S, som har en hävstång strax under -1.
Läs även SEB Jordbruksprodukter för fler analyser.
[box]SEB Veckobrev Veckans råvarukommentar är producerat av SEB Merchant Banking och publiceras i samarbete och med tillstånd på Råvarumarknaden.se[/box]
Disclaimer
The information in this document has been compiled by SEB Merchant Banking, a division within Skandinaviska Enskilda Banken AB (publ) (“SEB”).
Opinions contained in this report represent the bank’s present opinion only and are subject to change without notice. All information contained in this report has been compiled in good faith from sources believed to be reliable. However, no representation or warranty, expressed or implied, is made with respect to the completeness or accuracy of its contents and the information is not to be relied upon as authoritative. Anyone considering taking actions based upon the content of this document is urged to base his or her investment decisions upon such investigations as he or she deems necessary. This document is being provided as information only, and no specific actions are being solicited as a result of it; to the extent permitted by law, no liability whatsoever is accepted for any direct or consequential loss arising from use of this document or its contents.
About SEB
SEB is a public company incorporated in Stockholm, Sweden, with limited liability. It is a participant at major Nordic and other European Regulated Markets and Multilateral Trading Facilities (as well as some non-European equivalent markets) for trading in financial instruments, such as markets operated by NASDAQ OMX, NYSE Euronext, London Stock Exchange, Deutsche Börse, Swiss Exchanges, Turquoise and Chi-X. SEB is authorized and regulated by Finansinspektionen in Sweden; it is authorized and subject to limited regulation by the Financial Services Authority for the conduct of designated investment business in the UK, and is subject to the provisions of relevant regulators in all other jurisdictions where SEB conducts operations. SEB Merchant Banking. All rights reserved.

Selling down on a ”deal”. Brent crude fell 6.2% last week with accelerated weakness towards the end of the week. Close of the week at $87.33/b and low of the week (and on Friday) of $85.8/b. Brent is falling another 4% this morning to $83.7/b on confirmation by Iran that a MoU text has been reached and that it will be signed on Friday this week.

So what is this ”deal” worth? Talk on the desk here this morning is that it is much like ”putting lipstick on a pig” where Trump has to sell this at home as a victory where ”the SoH has reopened”, the nuclear issue will be ironed out over the coming 60 days (or maybe 600 days?) and US consumers are getting a lower gasoline price and maybe US republicans survives the midterm elections.
The importance for Iran is that it emerges as the defacto winner of this war in the eyes of the non-US public world. That Iran now onwards is the ”ruler of the SoH” (combo of geography and new weapons systems like drones) or more softer: ”the guarantor of safe passage through the SoH”.
Iran doesn’t need nuclear weapons any more. Nuclear deterrence doesn’t work any more. Ukraine has made many attacks deep into Russia without being nuked in return. Plenty of Iranian ballistic rockets blasts over Israel but Iran wasn’t nuked in return.
There is no trust between the US and Iran. We don’t know all the details yet of the MoU. But what we do know is that there is no trust between the US and Iran what so ever. This is probably more like a descriptive text on how they can cooperate in a way where both sides keeps tactical leverage. Neither side makes irreversible concessions. Violations can be punished quickly. Cooperation produces immediate benefits.
This is a fragile structure. It can easily break down. There may be details which cannot be overcome. To be seen on Friday. The US has to show that it is willing put enough force behind managing and restraining Israel versus Hezbollah in Lebanon. We have seen that Netanyahu hasn’t listened all that much to Trump’s directives and wishes. This could be a major obstacle.
A gradual reopening is tactically preferable for Iran. A tactical leverage for Iran right now is that global oil stocks have been drawn down towards painful and increasingly dangerous levels with increasing risks for oil price spikes in mid-July to August. This together with US midterm elections on 3 November gives tactical leverage to Iran. Iran probably doesn’t want to fully give up on that leverage. A rapid, full reopening where global stocks are able to refill over the coming 60 days will significantly erode that leverage. If Iran reinstates a closure of the SoH after 60 days (if talks break down again), then the effect won’t be that impactful in terms of prices and the US midterm elections.
So a gradual and partial reopening where global markets gets the oil they need while they are unable to rebuild stocks could be a practical middle way for both parties. Trump can sell it as ”the SoH has reopened” and get affordable gasoline for US consumers. Iran can sell it as ”the SoH has fully reopened, but there is some friction” so flow is only 60-80% of normal.
Not much real demand destruction below $100/b. What we do know is that there is not much real price pain demand destruction for oil globally at an oil price below $100/b. A lot of demand-shock destruction. Fear. But demand should now come roaring back towards normal with fear for exceptionally high prices now is rapidly receding.
Sudden China demand destruction due to EVs? Bullocks. EV share of total Chinese carpool now around 13%. Share of new sales of EVs has reached 50%. This is a very gradual process. It doesn’t make oil demand fall like a rock over night. When EV new sales share reaches 100%, then the gasoline car pool will contract by some 5-10% per year. But that is only gasoline. Sudden reduction in Chinese oil demand is more about shock and risk.
Chinese crude oil imports will come roaring back. At what price? Today’s ”neutral” oil price is $70/b. That is the five year price which has steadily traded around the $70/b mark over the past 3-4 years. With still a risky picture one would think that China and the rest of the world will be big buyers of oil in the range of $70-85/b.
Global demand will likely snap back towards normal, forecasted demand and growth at such prices.
Physical reopening is a gradual process. The physical and practical reopening of the SoH will likely be gradual rather than sudden. And that probably suites Iran tactically as well.
Brent M1 price versus the Brent 5-yr (today’s ”normal” price)

Market is starting to take US/Iran headlines with a pinch of salt. Brent crude rose $2.8/b yesterday to an official close of $112.1/b. But after that it traded as low as $108.05/b before ending late night at around $109.7/b. Through the day it traded in a range of $106.87 – 112.72/b amid a flurry of news or rumors from Iran and the US. ”US temporary sanctions during negotiations” (falls alarm). ”We will bomb Iran” (not anyhow),… etc. While the market is still fluctuating to this kind of news flow, it is starting to take such headlines with a pinch of salt.
We’ll see. Maybe, maybe not. The Brent M1 contract is trading at $110.2/b this morning which very close to the average ticks through yesterday of $110.4/b.
Trump with bearish, verbal intervention whenever Brent trades above $110/b it seems. What seems to be a pattern is that Trump states something like ”very good negotiations going on with Iran”, ”New leaders in Iran are great,..”, ”Great progress in negotiations,…”, ”Deal in sight,..” etc whenever the Brent M1 contract trades above $110/b. An effort to cool the market. These hot air verbal interventions from Trump used to have a heavy bearish impact on prices, but they now seems to have less and less effect unless they are backed by reality.
As far as we can see there has been no real progress in the negotiations between the US and Iran with both sides still standing by their previous demands.
Iran is getting stronger while the cease fire lasts making a return to war for Trump yet harder. Iran is naturally in constant preparation for a return to war given Trump’s steady threats of bombing Iran again. Iran is naturally doing what ever is possible to prepare for a return to war. And every day the cease fire lasts it is better prepared. This naturally makes it more and more difficult and dangerous for the US to return to warring activity versus Iran as the consequences for energy infrastructure in the Persian Gulf will be more and more severe the longer the cease fire lasts. Israel seems to see it this way as well. That the war is not won and that current frozen state of a cease fire gives Iran opportunity to rebuild military and politically.
Global inventories are drawing down day by day. How much? In the meantime the Strait of Hormuz stays closed. There is varying measures and estimates of how much global inventories are drawing down. Our rough estimate, back of the envelope, is that global inventories are drawing down by at least some 10 mb/d or about 300 mb/d in a balance between loss of supply versus demand destruction. Other estimates we see are a monthly draw of 250-270 mb/d. The IEA only ’measured’ a draw in global observable stocks of 117 mb in April with oil on water rising 53 mb while on shore stocks fell 170 mb. But global stocks are hard to measure with large invisible, unmeasured stocks. As such a back of the envelope approach may be better.
Oil products is what the world is consuming. Oil product prices likely to rise while product stocks fall. Strategic Petroleum Reserves (SPR) are predominantly crude oil. Discharging oil from OECD SPR stocks, a sharp reduction in Chinese crude imports and a reduction in global refinery throughput of 6-7 mb/d has helped to keep crude oil markets satisfactorily supplied. But global inventories are drawing down none the less. And oil products is really what the world is consuming. So if global refinery throughput stays subdued, then demand will eventually have to match the supply of oil products. The likely path forward this summer is a steady draw down in jet fuel, diesel and gasoline. Higher prices for these. Then, if possible, higher refinery throughput and higher usage of crude in response to very profitable refinery margins. And lastly sharper draw in crude stocks and higher prices for these. But some 6 mb/d of oil products used to be exported through the Strait of Hormuz. And it may not be so easy to ramp up refinery activity across the world to compensate. Especially as Ukraine continues to damage Russian refineries as well as Russian crude production and export facilities.
Watch oil product stocks and prices as well as Brent calendar 2027. What to watch for this summer is thus oil product inventories falling and oil product premiums to crude rising. Another measure to watch is the Brent crude 2027 contract as it rises steadily day by day as the Strait of Hormuz stays closed and global oil inventories decline. The latter is close to the highest level since the start of the war and keeps rising.
The Brent M1 contract and the Brent 2027 prices and current price of jet fuel in Europe (ARA). All in USD/b

Our back of the envelope calculation of the global shortage created by the closure of the Strait of Hormuz. Note that 3.5 mb/d of discharge from SPR is also a draw. Note also that ’Forced demand loss’ of 2.5 mb/d is probably temporary and will fall back towards zero as logistics are sorted out leaving ’Price demand loss’ to do the job of balancing the market. Thus a shortfall of at least 9 mb/d created by the closure. More if SPR discharge is included and more if Forced demand loss recedes.

Brent is climbing higher. Front-month is at USD 106.3/bl this morning, close to a weekly high and a USD 9/bl jump from Mondays open. This is the move we flagged as a risk earlier in the week: the market shifting from ”a deal is around the corner” to ”this is going to take longer than we thought”.

Analyst Commodities, SEB
During April, rest-of-year Brent remained remarkably stable around USD 90/bl. A stability which rested on one single assumption: the SoH reopens around 1 May. That assumption is now slowly falling apart.
As we highlighted yesterday: every week of delay beyond 1 May adds (theoretically) ish USD 5/bl to the rest-of-year average, as global inventories draw 100 million barrels per week. i.e., a mid-May reopening implies rest-of-year Brent closer to USD 100/bl, and anything pushing into June or July takes us meaningfully higher.
What’s changed in the last 48 hours:
#1: The US military has formally warned that clearing suspected sea mines from SoH could take up to six months. That is a completely different timescale from what the financial market is pricing. Even a political deal tomorrow does not immediately reopen the strait.
#2: Trump has shifted his tone from urgency to ”strategic patience”. In yesterday’s press conference: ”Don’t rush me… I want a great deal.” The market is reading this as a president no longer feeling pressured by timelines, with the naval blockade running in the background.
#3: So far, the military activity is escalating, not de-escalating. Axios reports Iran is laying more mines in SoH. The US 3rd carrier strike group (USS George H.W. Bush) is arriving with two countermine vessels. Trump yesterday ordered the US Navy to destroy any Iranian boats caught laying mines. While CNN reports that the Pentagon is actively drawing up plans to strike Iranian SoH capabilities and individual Iranian military leaders if the ceasefire collapses. i.e., NOT a attitude consistent with an imminent deal!
Spot crude and product prices eased off the early-April highs on a combination of system rerouting and deal optimism. Both now weakening. Goldman estimates April Gulf output is reduced by 14.5 mbl/d, or 57% of pre-war supply, a number that keeps getting worse the longer this drags on.
Demand-side adaptation is ongoing: S. Korea has cut its Middle East crude dependence from 69% to 56% by pulling more from the Americas and Africa, and Japan is kicking off a second round of SPR releases from 1 May. But SPRs are finite.
Ref. to the negotiations, we should not bet on speed. The current Iranian leadership is dominated by genuine hardliners willing to absorb economic pain and run the clock to extract concessions. That is not a setup for a rapid resolution. US/Israeli media briefings keep framing the delay as ”internal Iranian divisions”, the reality is more complicated and points toward weeks and months, not days.
Our point is that the complexity is large, and higher prices have only just started (given a scenario where the negotiations drag out in time). The market spent April leaning on the USD 90/bl rest-of-year assumption; that case is diminishing by the hour. If ”early May reopening” is replaced by ”June, July or later” over the next week or two, both crude and products have meaningful room to reprice higher from here. There is a high risk being short energy and betting on any immediate political resolution(!).


Vattenfalls och Industrikrafts kärnkraftsbolag Videberg Kraft har valt Rolls-Royce SMR
Selling down on a ”deal”

Sommarväder skapar prisrally på elbörsen
Oil product price pain is set to rise as the Strait of Hormuz stays closed into summer

