

Analys
SEB Jordbruksprodukter, 30 augusti 2012
 Det har varit stora prisuppgångar på spannmål i sommar. Det finns tecken på att majspriset faktiskt börjar ransonera efterfrågan på majs. Såväl vete som sojabönor ser fortfarande starka ut.
På fredag är det ministermöte (igen) i Ryssland om skörde- och exportsituationen. Nästa vecka kommer WASDE-rapporten. Det finns inte mycket nyheter för marknaden att ta fasta på innan dess, så det lär inte hända så mycket – om nu inte Ryssland ger oss någon nyhet.
Odlingsväder
ENSO fortsätter att surfa på gränsen till ett riktigt El Niño. SOI ligger under gränsen för El Niño på -8. Däremot har andra indikatorer som molnighet inte uppvisat typiska El Niñomönster de senaste två veckorna. Klimatmodeller prognosticerar att ENSO kommer att fortsätta ligga på gränsen fram till slutet av året eller in i början på 2013, för att sedan återgå till normala ENSO-förhållanden.

Vete
Tekniskt har Matif-november fortsatt att röra sig inom den triangel som vi anser kommer att brytas på uppsidan. Ett sådant brott uppåt har enligt den tekniska analysen potential att gå upp till 286 euro per ton. Det finns två potentiella triggers för detta. Det ryska ministermötet på fredag och WASDE-rapporten nästa vecka.

Nedan ser vi Chicagovetet med leverans i december. Den tekniska bilden indikerar samma sak här.

I diagrammet nedan ser vi terminspriserna framåt i tiden för Chicago och Matif och förändringen från 7 dagar sedan. Vi ser att backwardation har minskat i USA. Priset för leverans nästa november (2013) är ca 20 euro per ton högre i Chicago än i Paris.

Det ryska jordbruksministeriet rapporterade igår (onsdag) att 53.4 mt spannmål och baljväxter har skördats hittills. Avkastningen ligger på 1.92 mt / ha. Förra året var det 2.63 ton/ha. Det är en minskning med 27%. Jordbruksministern upprepade sin prognos om en skörd på 75 mt, en minskning med 20% från förra årets 94 mt. Han sade att exportpotentialen är 12 mt. 2011/12 exporterade Ryssland 21.6 mt, enligt USDA.
 Nu på fredag möts ryska ministrar och experter och diskuterar skörden och exportmöjligheterna. Vi har tidigare visat att Rysslands nya medlemskap i WTO inte har tagit bort risken för ett exportstopp. Enligt WTO:s regelverk får Ryssland införa exportbegränsningar om det meddelar de andra länderna och om exportstoppet är tillfälligt, och det lär det ju vara.
Det är naturligtvis svårt för oss på SEB att följa vad som sägs i hela världen om exportstopp i alla länder. Ett enkelt sätt är att räkna alla artiklar som innehåller nyckelorden Wheat+Export+Ban och det ser vi nedan. Den senaste veckan har det talats mindre om exportstopp. Kanske marknaden är trött på ”storyn”.
Det franska jordbruksministeriet meddelade igår att ”World Food Security Situation Not Threatened for Now”. Fast de sade det väl på franska. Frankrike har inrättat det så kallade ”Rapid Response Forum” förra året för att hindra att länder inför exportbegränsningar. Det är en del av ”The Agricultural Market Information System” som inrättats på beslut av G20. Jag förmodar att de får anledning att träffas igen snart, allra senast efter USDA:s rapport nästa vecka.

De två senaste veckorna har det kommit ner nederbörd över Indien, vilket har fått läget att ljusna för grödor som majs, ris och sojabönor. 50% av Indien är drabbat av torka. Det minskar trycket på staten att införa exportbegränsningar. Arealen sådd med ris har ökat till 32.9 miljoner hektar från 30.8 förra året. Förra årets skörd var rekordhöga 91.5 mt, enligt det indiska jordbruksministeriet.
Orkanen Isaac som nådde fastlandet via Louisiana ger nederbörd, som förbättrar markfukten inför höstsådden av SRWW, även om stormen också fördröjer fältarbetet.
Maltkorn
Novemberkontraktet på maltkorn har funnit stöd och ser ur teknisk synvinkel ut att kunna stiga den närmaste tiden.

Potatis
Potatishaussen fick priset att fortsätta stiga efter förra veckobrevet. Efter att ha nått över 24 euro per deciton, föll priset hastigt tillbaka till 20 euro, men har de senaste två dagarna åter stigit och ligger nu på 23 euro. Vi vet att det fanns säljare på över 24 euro, så det återstår att se om de är starka nog.

Nedan ser vi terminskurvan för industripotatis på Eurex. Priset för nästa års skörd ligger på 15 euro per deciton. Det är det man ska räkna med att få betalt för nästa års skörd.
Tycker man att det är en bra prisnivå kan man välja att sälja terminer för att prissäkra. Korrelationen över skördeåren mellan tysk industripotatistermin och till och med svensk matpotatisnotering är högre än 0.5. Prissäkring med de här terminerna ger en riskminskning. Trots att det är en annan kvalitet och ett annat land.

Majs
Majspriset har inte riktigt lyckats hitta nya toppnivåer och det är ett svaghetstecken. Marknaden ligger inom en triangelformation. Ett brott nedåt ur den vore inte bra och skulle innebära att vi skulle reducera långa positioner kraftigt och kanske till och med gå kort.

Nedan ser vi terminskurvan framåt i tiden för majs.

Måndagens crop ratings för majs var kom in med 22% i good/excellent condition. Förra veckan var det 23%. Poor / Very poor kom in på 52% (upp en procentenhet).
Orkanen Isaac, som nådde fastlandet vid Louisiana kommer att ge mellan 70 och 80 mm nederbörd över Missouri de kommande tre dagarna, enligt National Weather Service. Det kommer också att blåsa en hel del och det kan skada majsfälten som pga torkan har svaga stjälkar. Berörda stater är Louisiana, Alabama, Arkansas och Mississippi. Etanolproduktionen har nu äntligen minskat efter de senaste veckornas uppgång. Det är en minskning från 823,000 fat/dag till 819,000 fat, enligt DOE:s veckostatistik. Vi får tolka det som att det finns tecken på att det höga majspriset faktiskt ransonerar konsumtionen.

Enligt USDA-rapporten den 10 augusti går 42% av amerikansk majsproduktion till etanolproduktion. Priset på etanol har backat i pris de senaste dagarna.
Sojabönor
Triangelformationen är bruten på uppsidan och har nu etablerat sig över toppen från juli. Vi ser det som en konsolidering inför nästa uppgångsfas, till den teoretiska målkursen 1879 cent / bu.

Crop conditions visar en minskning på 1% i kategorin ”good” och en ökning i ”very poor”. 38% är i poor / very poor condition medan 30% är good eller very good condition. Orkanen Isaac ger nederbörd, som berört under majs-avsnittet, men nederbörden är för sen för att påverka sojaskörden, eftersom den är tre veckor tidig och sojabönornas baljor redan är satta.
Raps
Vi tror alltjämt att rapsterminen för novemberleverans är på väg högre. Den snabba ”dippen” häromdagen, som återhämtade sig så snabbt, tyder på att köparna fortfarande har kommandot över marknaden. På ovansidan finns ett motstånd på 524.75 euro per ton. Vi tror att det ska testas igen – och övervinnas.

Gris
Grispriset befinner sig i en tydlig bear market. Nedan ser vi baissen på grismarknaden.

Mjölk
Priset på mjölkpulver i Nordeuropa har fortsatt att stiga ännu en vecka. Nedanför ser vi oktoberkontraktet. Det har fortsatt att öka till 2718, från 2625 euro per ton.

Nedan ser vi priset på smör, också oktoberkontraktet såsom handlat på EUREX. Priset är angivet i euro per ton.

På den amerikanska börsen har priset också stigit. EUREX som representerar marknaden i Europa har börjat bli allt mer med världsmarknadens pris, representerat av terminerna i Chicago.

Socker
Priset på socker har studsat upp från strax under 20 cent och ligger nu på nästan exakt 20 cent. Trenden är ner, men trenden är också gammal.

EURSEK
EURSEK svarar på ett starkt tekniskt stöd. Vi tror på sidledes rörelse den närmaste veckan. Augustis sidledes rörelse såg först ut som en paus inför fortsatt nedgång, men man ska inte se kursrörelser som i tisdags och i onsdags i en korrektion. Vi kan nu få se en uppgång mot 8.50 kr per euro.

USDSEK
Dollarn har svarat på supportområdet och hoppat upp från det. Stödet ligger vid 6.60 kr. Priset kan i första hand gå upp till 6.80, men det mest troliga är fortsatt sidledes rörelse med stödet under.

[box]SEB Veckobrev Jordbruksprodukter är producerat av SEB Merchant Banking och publiceras i samarbete och med tillstånd på Råvarumarknaden.se[/box]
Disclaimer
The information in this document has been compiled by SEB Merchant Banking, a division within Skandinaviska Enskilda Banken AB (publ) (“SEB”).
Opinions contained in this report represent the bank’s present opinion only and are subject to change without notice. All information contained in this report has been compiled in good faith from sources believed to be reliable. However, no representation or warranty, expressed or implied, is made with respect to the completeness or accuracy of its contents and the information is not to be relied upon as authoritative. Anyone considering taking actions based upon the content of this document is urged to base his or her investment decisions upon such investigations as he or she deems necessary. This document is being provided as information only, and no specific actions are being solicited as a result of it; to the extent permitted by law, no liability whatsoever is accepted for any direct or consequential loss arising from use of this document or its contents.
About SEB
SEB is a public company incorporated in Stockholm, Sweden, with limited liability. It is a participant at major Nordic and other European Regulated Markets and Multilateral Trading Facilities (as well as some non-European equivalent markets) for trading in financial instruments, such as markets operated by NASDAQ OMX, NYSE Euronext, London Stock Exchange, Deutsche Börse, Swiss Exchanges, Turquoise and Chi-X. SEB is authorized and regulated by Finansinspektionen in Sweden; it is authorized and subject to limited regulation by the Financial Services Authority for the conduct of designated investment business in the UK, and is subject to the provisions of relevant regulators in all other jurisdictions where SEB conducts operations. SEB Merchant Banking. All rights reserved.


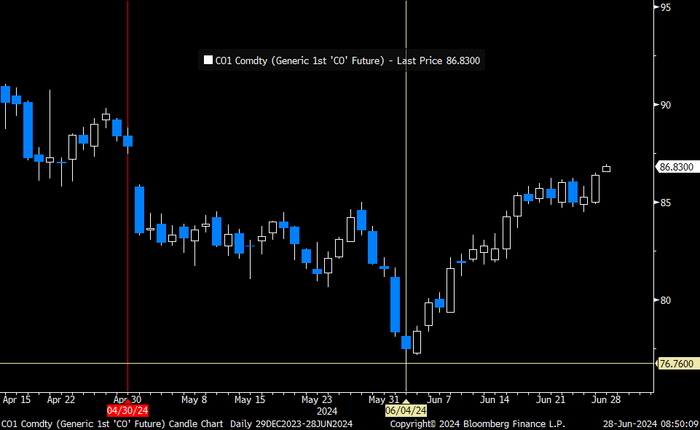
Brent crude price inching higher on optimistic that US inflationary pressures are fading. Brent crude closed up 1.1 USD/b ydy to a close of USD 86.39/b which was the highest close since the end of April. This morning it is trading up another half percent to USD 86.9/b along with comparable gains in industrial metals and Asian equities. At 14:30 CET the US will publish its preferred inflation gauge, the PCE figure. Recent data showed softer US personal spending in Q1. Expectations are now high that the PCE inflation number for May will show fading inflationary pressures in the US economy thus lifting the probability for rate cuts later this year which of course is positive for the economy and markets in general and thus positive for oil demand and oil prices. Hopes are high for sure.
Brent crude is trading at the highest since the end of April
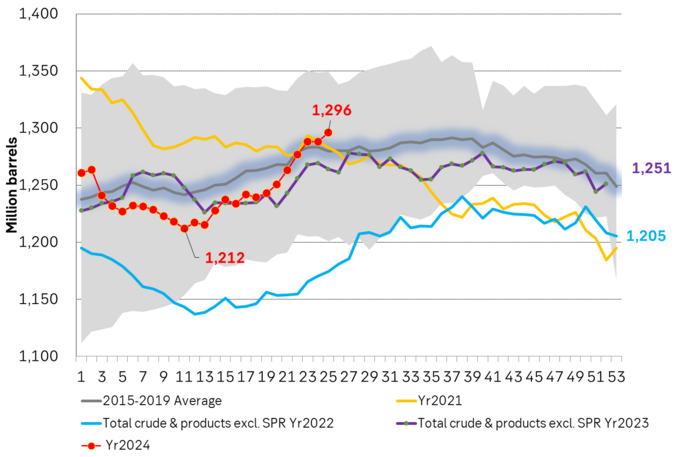
The rally in Brent crude since early June is counter to rising US oil inventories and as such a bit puzzling to the market.
US commercial crude and oil product stocks excluding SPR.
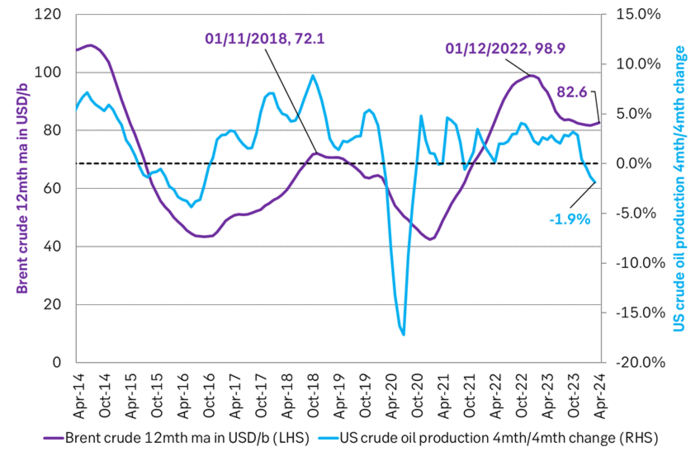
Actual US crude oil production data for April will be published later today. Zero growth in April is likely. Later today the US EIA will publish actual production data for US crude and liquids production for April. Estimates based on US DPR and DUC data indicates that there will indeed be zero growth in US crude oil production MoM in April. This will likely driving home the message that there is no growth in US crude oil production despite a Brent crude oil price of USD 83/b over the past 12 mths. The extension of this is of course rising expectations that there will be no growth in US crude oil production for the coming 12 months either as long as Brent crude hoovers around USD 85/b.
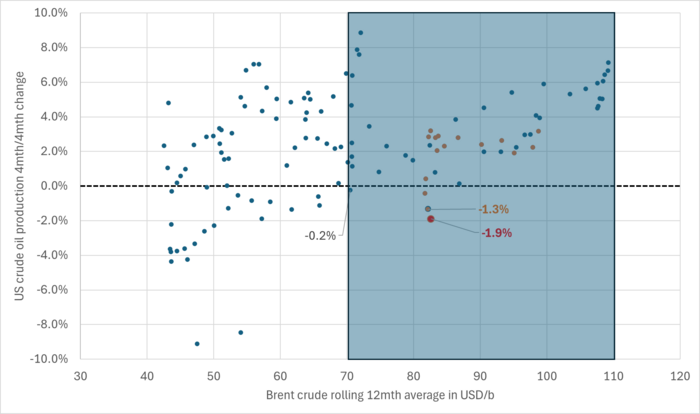
US production breaking a pattern since Jan 2014. No growth at USD 83/b. What stands out when graphing crude oil prices versus growth/decline in US crude oil production is that since January 2014 we have not seen a single month that US crude oil production is steady state or declining when the Brent crude oil price has been averaging USD 70.5/b or higher.
US Senate looking into the possibility that US shale oil producers are now colluding by holding back on investments, thus helping to keep prices leveled around USD 85/b.
Brent crude 12mth rolling average price vs 4mth/4mth change in US crude oil production. Scatter plot of data starting Jan 2014. Large red dot is if there is no change in US crude oil production from March to April. Orange dots are data since Jan 2023. The dot with ”-1.3%” is the March data point.
Brent crude 12mth rolling average price vs 4mth/4mth change in US crude oil production. Data starting Jan 2014. The last data point is if there is no change in US crude oil production from March to April.
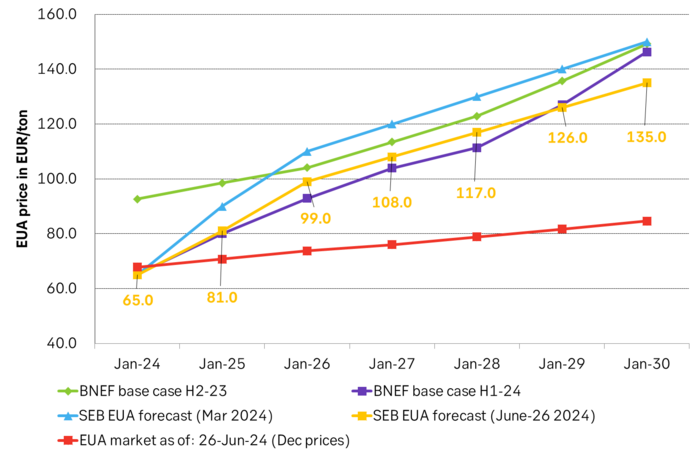
We reduce our forecast for EUA prices to 2030 by 10% to reflect the weakened green political agenda in the EU Parliament following the election for the Parliament on 6-9 June. The upcoming election in France on 7 July is an additional risk to the political stability of EU and thus in part also to the solidity of the blocks green agenda. Environmental targets for 2035 and 2040 are most at risk of being weakened on the margin. EUA prices for the coming years to 2030 relate to post-2030 EUA prices through the bankability mechanism. Lower post-2030 climate ambitions and lower post-2030 EUA prices thus have a bearish impact on EUA prices running up to 2030. Actual softening of post-2030 climate ambitions by the EU Parliament have yet to materialize. But when/if they do, a more specific analysis for the consequences for prices can be carried out.
EUA prices broke with its relationship with nat gas prices following the EU Parliament election. The EUA price has dutifully followed the TTF nat gas price higher since they both bottomed out on 23 Feb this year. The EUA front-month price bottomed out with a closing price of EUR 50.63/ton on 23 Feb. It then reached a recent peak of EUR 74.66/ton on 21 May as nat gas prices spiked. Strong relationship between EUA prices and nat gas prices all the way. Then came the EU Parliament election on 6-9 June. Since then the EUA price and TTF nat gas prices have started to depart. Bullish nat gas prices are no longer a simple predictor for bullish EUA prices.
The front-month EUA price vs the front-year TTF nat gas price. Hand in hand until the latest EU Parliament election. Then departing.
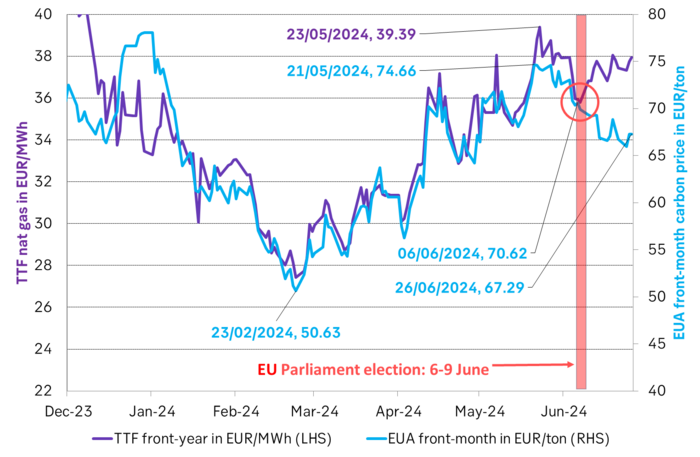
The EU Parliament election on 6-9 June was a big backlash for the Greens. The Greens experienced an euphoric victory in the 2019 election when they moved from 52 seats to 74 seats in the Parliament. Since then we have had an energy crisis with astronomic power and nat gas prices, rampant inflation and angry consumers being hurt by it all. In the recent election the Greens in the EU Parliament fell back to 53 seats. Close to where they were before 2019.
While green politics and CO2 prices may have gotten a lot of blame for the pain from energy prices over the latest 2-3 years, the explosion in nat gas prices are largely to blame. But German green policies to replace gas and oil heaters with heat pumps and new environmental regulations for EU farmers are also to blame for the recent pullback in green seats in the Parliament.
Green deal is still alive, but it may not be fully kicking any more. Existing Green laws may be hard to undo, but targets for 2035 and 2040 will be decided upon over the coming five years and will likely be weakened.
At heart the EU ETS system is a political system. As such the EUA price is a politically set price. It rests on the political consensus for environmental priorities on aggregate in EU.
The changes to the EU Parliament will likely weaken post-2030 environmental targets. The changes to the EU Parliament may not change the supply/demand balance for EUAs from now to 2030. But it will likely weaken post-2030 environmental targets and and thus projected EU ETS balances and EUA prices post-2030. And through the bankability mechanism this will necessarily impact EUA prices for the years from now to 2030.
Weaker post-2030 ambitions, targets and prices implies weaker EUA prices to 2030. EUA prices are ”bankable”. You can buy them today and hold on to them and sell them in 2030 or 2035. The value of an EUA today fundamentally rests on expected EUA prices for 2030/35. These again depends on EU green policies for the post 2030 period. Much of these policies will be ironed out and decided over the coming five years.
Weakening of post-2030 targets have yet to materialize. But just talking about it is a cold shower for EUAs. These likely coming weakenings in post-2030 environmental targets and how they will impact EUA prices post 2030 and thus EUA prices from now to 2030 are hard to quantify. But what is clear to say is that when politicians shift their priorities away from the environment and reduce their ambitions for environmental targets post-2030 it’s like a cold shower for EUA prices already today.
On top of this we now also have snap elections in the UK on 4 July and in France on 7 July with the latter having the potential to ”trigger the next euro crisis” according to Gideon Rachman in a recent article in FT.
What’s to be considered a fair outlook for EUA prices for the coming five years in this new political landscape with fundamentally changed political priorities remains to be settled. But that EUA price outlooks will be lowered versus previous forecasts is almost certain.
We reduce our EUA price forecast to 2030 by 10% to reflect the new political realities. To start with we reduce our EUA price outlook by 10% from 2025 to 2030 to reflect the weakened Green agenda in the EU parliament.
SEB’s EUA price forecast, BNEF price forecasts and current market prices in EUR/MWh
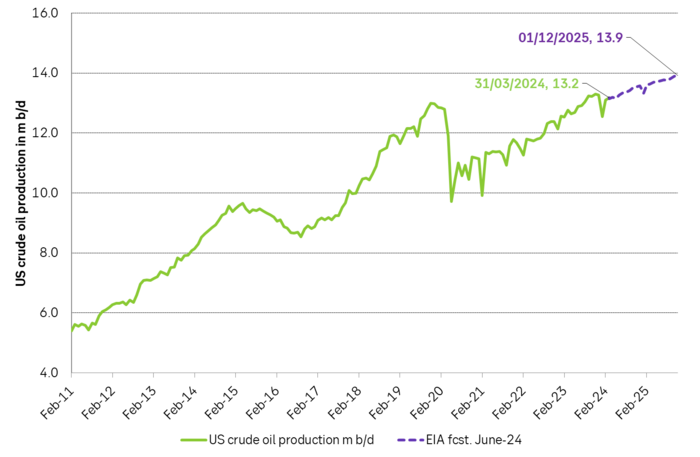
US crude oil production has been booming for more than a decade. Interrupted by two setbacks in response to sharp price declines. The US boom has created large waves in the global oil market and made life very difficult for OPEC(+). Brent crude has not traded below USD 70/b since Dec-2021 and over the past year, it has averaged USD 84/b. US shale oil production would typically boom with such a price level historically. However, there has been zero growth in US crude oil production from Sep-2023 to Mar-2024. This may be partially due to a cold US winter, but something fundamentally seems to have changed. We recently visited a range of US E&P and oil services companies in Houston. The general view was that there would be zero growth in US crude oil production YoY to May 2025. If so and if it also is a general shift to sideways US crude oil production beyond that point, it will be a tremendous shift for the global oil market. It will massively improve the position of OPEC+. It will also sharply change our perception of the forever booming US shale oil supply. But ”the proof is in the pudding” and that is data. More specifically the US monthly, controlled oil production data is to be published on Friday 28 June.
The most important data point in the global oil market will be published on Friday 28 June. The US EIA will then publish its monthly revised and controlled oil production data for April. Following years of booming growth, the US crude oil production has now gone sideways from September 2023 to March 2024. Is this a temporary blip in the growth curve due to a hard and cold US winter or is it the early signs of a huge, fundamental shift where US crude oil production moves from a decade of booming growth to flat-lining horizontal production?
We recently visited a range of E&P and oil services companies in Houston. The general view there was that US crude oil production will be no higher in May 2025 than it is in May 2024. I.e. zero growth.
It may sound undramatic, but if it plays out it is a huge change for the global oil market. It will significantly strengthen the position of OPEC+ and its ability to steer the oil price to a suitable level of its choosing.
The data point on Friday will tell us more about whether the companies we met are correct in their assessment of non-growth in the coming 12 months or whether production growth will accelerate yet again following a slowdown during winter.
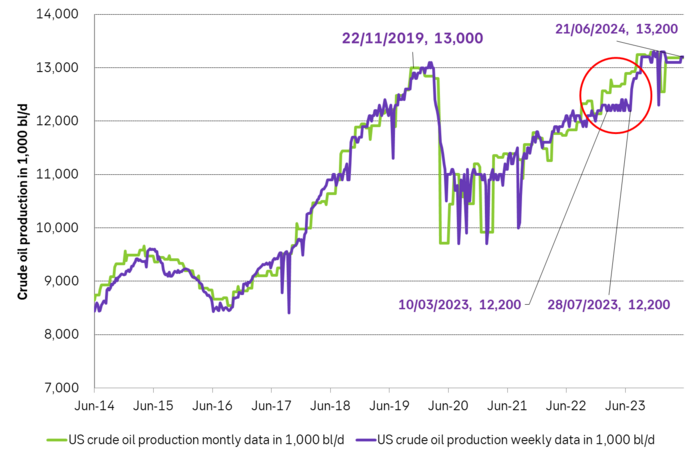
The US releases weekly estimates for its crude oil production but these are rough, temporary estimates. The market was fooled by these weekly numbers last year when the weekly numbers pointed to a steady production of around 12.2 m b/d from March to July while actual monthly data, with a substantial lag in publishing, showed that production was rising strongly.
The real data are the monthly, controlled data. These data will be the ”proof of the pudding” of whether US shale oil production now is about to shift from a decade of booming growth to instead flat-line sideways or whether it will drift gradually higher as projected by the US EIA in its latest Short-Term Energy Outlook.
US crude oil production given by weekly data and monthly data. Note that the monthly, controlled data comes with a significant lag. The market was thus navigating along the weekly data which showed ”sideways at 12.2 m b/d” for a significant period last year until actual data showed otherwise with a time-lag.
If we add in Natural Gas Liquids and zoom out to include history back to 2001 we see an almost uninterrupted boom in supply since Sep 2011 with a few setbacks. At first glance, this graph gives little support to a belief that US crude oil production now suddenly will go sideways. Simple extrapolation of the graph indicates growth, growth, growth.
US crude and liquids production has boomed since September 2011
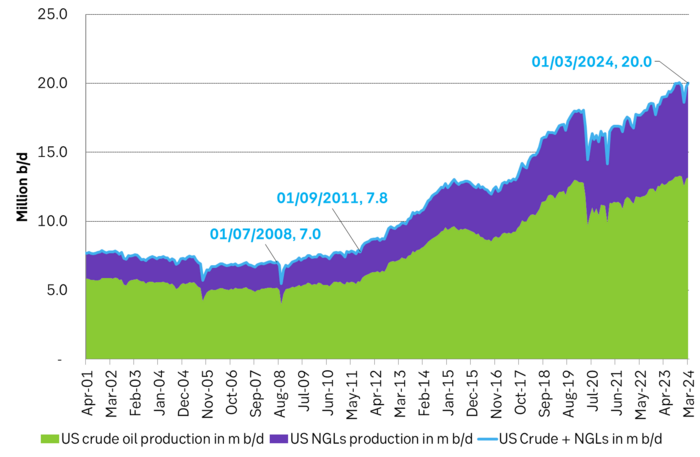
However. The latest actual data point for US crude oil production is for March with a reading of 13.18 m b/d. What stands out is that production then was still below the September level of 13.25 m b/d.
The world has gotten used to forever growing US crude oil production due to the US shale oil revolution, with shorter periods of sharp production declines as a result of sharp price declines.
But the Brent crude oil price hasn’t collapsed. Instead, it is trading solidly in the range of USD 70-80-90/b. The front-month Brent crude oil contract hasn’t closed below USD 70/b since December 2021.
Experiences from the last 15 years would imply wild production growth and activity in US shale oil production at current crude oil prices. But US crude oil production has now basically gone sideways to lower from September to March.
The big, big question is thus: Are we now witnessing the early innings of a big change in US shale oil production where we shift from booming growth to flat-lining of production?
If we zoom in we can see that US liquids production has flat-lined since September 2023. Is the flat-lining from Sep to Mar due to the cold winter so that we’ll see a revival into spring and summer or are we witnessing the early signs of a huge change in the global oil market where US crude oil production goes from booming growth to flat-line production.

The message from Houston was that there will be no growth in US crude oil production until May 2025. SEB recently visited oil and gas producers and services providers in Houston to take the pulse of the oil and gas business. Especially so the US shale oil and shale gas business. What we found was an unusually homogeneous view among the companies we met concerning both the state of the situation and the outlook. The sentiment was kind of peculiar. Everybody was making money and was kind of happy about that, but there was no enthusiasm as the growth and boom years were gone. The unanimous view was that US crude oil production would be no higher one year from now than it is today. I.e. flat-lining from here.
The arguments for flat-lining of US crude oil production here onward were many.
1) The shale oil business has ”grown up” and matured with a focus on profits rather than growth for the sake of growth.
2) Bankruptcies and M&As have consolidated the shale oil companies into larger, fewer public companies now accounting for up to 75% of total production. Investors in these companies have little interest/appetite for growth after having burned their fingers during a decade and a half of capital destruction. These investors may also be skeptical of the longevity of the US shale oil business. Better to fully utilize the current shale oil infrastructure steadily over the coming years and return profits to shareholders than to invest in yet more infrastructure capacity and growth.
3) The remaining 25% of shale oil producers which are in private hands have limited scope for growth as they lack pipeline capacity for bringing more crude oil from field to market. Associated nat gas production is also a problem/bottleneck as flaring is forbidden in many places and pipes to transport nat gas from field to market are limited.
4) The low-hanging fruits of volume productivity have been harvested. Drilling and fracking are now mostly running 24/7 and most new wells today are all ”long wells” of around 3 miles. So hard to shave off yet another day in terms of ”drilling yet faster” and the length of the wells has increasingly reached their natural optimal length.
5) The average ”rock quality” of wells drilled in the US in 2024 will be of slightly lower quality than in 2023 and 2025 will be slightly lower quality than 2024. That is not to say that the US, or more specifically the Permian basin, is quickly running out of shale oil resources. But this will be a slight headwind. There is also an increasing insight into the fact that US shale oil resources are indeed finite and that it is now time to harvest values over the coming 5-10 years. One company we met in Houston argued that US shale oil production would now move sideways for 6-7 years and then overall production decline would set in.
The US shale oil revolution can be divided into three main phases. Each phase is probably equally revolutionary as the other in terms of impact on the global oil market.
1) The boom phase. It started after 2008 but didn’t accelerate in force before the ”Arab Spring” erupted and drove the oil price to USD 110/b from 2011 to 2014. It was talked down time and time again, but it continued to boom and re-boom to the point that today it is almost impossible to envision that it won’t just continue to boom or at least grow forever.
2) The plateau phase. The low-hanging fruits of productivity growth have been harvested. The highest quality resources have been utilized. The halfway point of resources has been extracted. Consolidation, normalization, and maturity of the business has been reached. Production goes sideways.
3) The decline phase. Eventually, the resources will have been extracted to the point that production unavoidably starts to decline.
Moving from phase one to phase two may be almost as shocking for the oil market as the experience of phase 1. The discussions we had with oil producers and services companies in Houston may indicate that we may now be moving from phase one to phase two. That there will be zero shale oil production growth YoY in 2025 and that production then may go sideways for 6-7 years before phase three sets in.
US EIA June STEO report with EIA’s projection for US crude oil production to Dec-2025. Softer growth, but still growth.
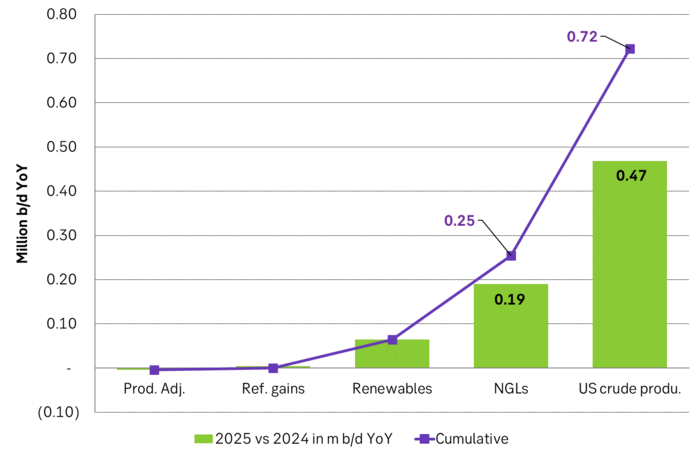
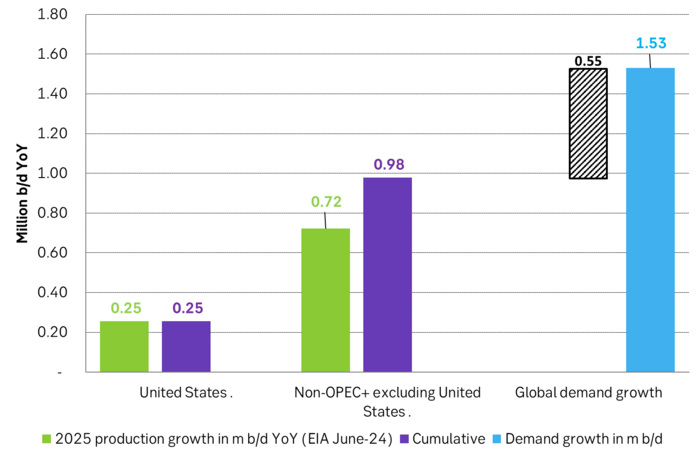
US EIA June STEO report with YoY outlook growth for 2025. Projects that US crude production will grow by 0.47 m b/d YoY in 2025 and that total liquids will grow by 720 k b/d YoY.
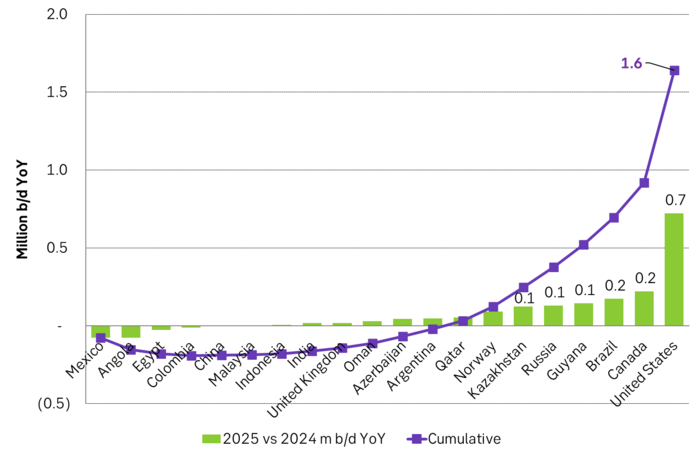
US EIA June STEO report with outlook for production growth by country in 2025. This shows how big the US production growth of 0.7 m b/d YoY really is compared to other producers around the world
US EIA June STEO report with projected global growth in supply and demand YoY in 2025. Solid demand growth, but even strong supply growth with little room for OPEC+ to expand. Production growth by non-OPEC+ will basically cover global oil demand growth.
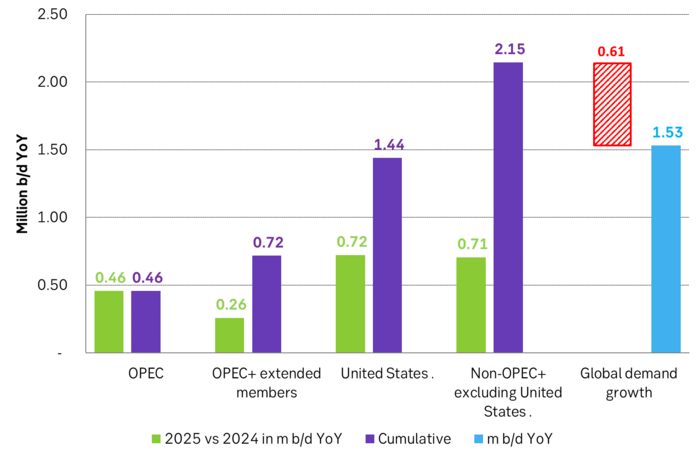
But if there instead is zero growth in US crude oil production in 2025 and the US liquids production only grows by 0.25 m b/d YoY due to NGLs and biofuels, then suddenly there is room for OPEC+ to put some of its current production cuts back into the market. Thus growth/no-growth in US shale oil production will be of huge importance for OPEC+ in 2025. If there is no growth in US shale oil then OPEC+ will have a much better position to control the oil price to where it wants it.
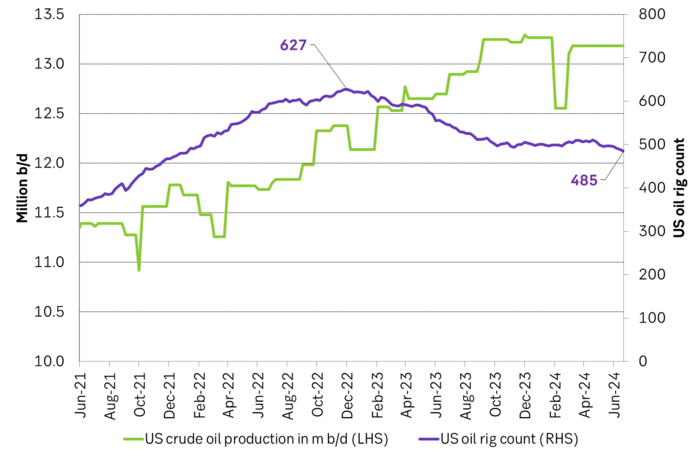
US crude oil production and drilling rig count


Europas största tillverkare av elbilsbatterier överväger att ställa om till batterier för villor

Priset på litium fortsätter att falla, överutbud i flera år framåt

Koppar från kinesiska lager flödar ut på marknaden

Enerpoly tar ett stort steg mot produktion av zinkjonbatterier med Nilar-förvärv

De tre bästa råvaruvaruaktierna just nu
De tre bästa råvaruvaruaktierna just nu

Lundin Mining vill köpa Filo Corp tillsammans med BHP

Africa Oil är bra att köpa anser Stifel som inleder analysbevakning

Stor risk att Africa Energy inte överlever det kommande året

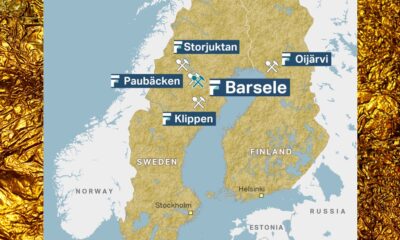
First Nordic Metals har fyra prospekteringsprojekt i Sverige
-
 Nyheter1 vecka sedan
De tre bästa råvaruvaruaktierna just nu
-
 Nyheter2 veckor sedan
Lundin Mining vill köpa Filo Corp tillsammans med BHP
-
 Nyheter4 veckor sedan
Africa Oil är bra att köpa anser Stifel som inleder analysbevakning
-
 Nyheter3 veckor sedan
Stor risk att Africa Energy inte överlever det kommande året
-
 Nyheter4 veckor sedan
First Nordic Metals har fyra prospekteringsprojekt i Sverige
-
Analys4 veckor sedan
Brent crude inching higher on optimism that US inflationary pressures are fading
-

 Nyheter2 veckor sedan
Uniper satsar på att göra elektrobränsle av sin elektricitet
-

 Nyheter2 veckor sedan
Tre bra aktier inom olja och oljeservice i Kanada