

Analys
Risk hedges in favour on heightened geopolitical risks

 Geopolitical risks remained in focus last week, with the Ukrainian crisis somewhat worsened by the resignation of the Ukrainian Prime Minister, while the unrest in the Middle East threatened to get out of hand. According to the IMF, the conflicts in Ukraine and Iraq will likely hinder global growth, which is now forecast to be around 3.4% vs 3.6% predicted back in April. While prices are yet to react to the heightened risks, gold and oil ETPs continued to see strong inflows as investors seek hedge against a further deterioration of the situation.
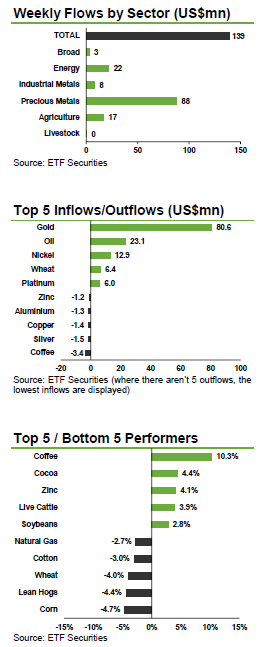 Gold and oil ETPs continue to see strong inflows on geopolitical risks. The Ukrainian crisis and unrest in the Middle East prompted investors to seek a potential hedge against a deterioration of the situation, driving US$80.6mn and US$23.1mn into gold and oil ETPs, respectively. While prices are yet to react to the heightened risks, with the Gaza conflict threatening to escalate following an Israeli missile attack on a UN school for refugees and the Ukrainian Prime Minister resigning, demand for oil and other defensive assets is likely to remain strong.
Long platinum ETPs record US$6mn of inflows on relative value prospects. The platinum to palladium ratio is standing at the lowest level since 2002, despite a South African strike that took over 1moz of platinum off the market. While palladium price is better positioned to benefit from a pick-up in global growth, investors deem the current platinum undervaluation excessive and anticipate platinum playing catch up to palladium.
Expectations of a prolonged ore export ban in Indonesia drive inflows into ETFS Nickel (NICK) to an 8-week high of US$12.8mn. Joko Widodo won the Indonesian presidential election and is due to be sworn into office on the 20th October. While his election might bring a relaxation of the export ban in place since January 2014, it is unlikely that any change will be carried out before next year, meaning that nickel market will remain tight for some time. With Indonesian industrial metal supply substantially reduced by the ban we expect industrial metals to continue being supported as global demand begins to pick up. Cyclical commodities demand is being driven by the Chinese government’s stimulus measures and a quickening pace in the US recovery.
Wheat ETPs see US$6.4mn of inflows as the recent price correction is deemed excessive. The Australian Bureau of Meteorology expects below average rainfall in the north-eastern and south-eastern wheat growing areas over the next few months. Investors are building positions in the hope that the large surpluses forecasted by the USDA prove wrong, which could lead to the next price rally. At the same time, profit taking drove US$2.5mn out of ETFS Daily Leveraged Coffee (LCFE), as the Arabica coffee price jumped by over 10% last week. Heavy rains at the tail end of the harvest in Brazil, the biggest producer, could lower the quality of the coffee beans that are currently being harvested.
Key events to watch this week. While investors focus will likely remain on the evolving situation in the Ukraine and the Middle East, a number of key economic statistics for the US and China will also be monitored to gather the strength in momentum in those economies. July Manufacturing PMIs for China, the US and the UK will be coming out this week, together with Q2 US GDP growth and July non-farm payrolls. The US FOMC rate decision will also be watched closely as investors try to identify the future path for rates in the US.
[box]Denna analys är producerad av ETF Securities och publiceras med tillstånd på Råvarumarknaden.se.[/box]
This communication has been provided by ETF Securities (UK) Limited (“ETFS UK”) which is authorised and regulated by the United Kingdom Financial Conduct Authority (the “FCA”).
This communication is only targeted at qualified or professional investors.
The products discussed in this communication are issued by ETFS Commodity Securities Limited (“CSL”), ETFS Hedged Commodity Securities Limited (“HCSL”), ETFS Hedged Metal Securities Limited (“HMSL”), Swiss Commodity Securities Limited (“SCSL”), ETFS Foreign Exchange Limited (“FXL”), ETFS Industrial Metal Securities Limited (“IML”), ETFS Metal Securities Limited (“MSL”), ETFS Oil Securities Limited (“OSL”), Gold Bullion Securities Limited (“GBS” and, together with CSL, HCSL, HMSL, SCSL, FXL, IML, MSL and OSL, the “Issuers”) and ETFX Fund Company plc (the “Company”). Each Issuer (apart from SCSL) is regulated by the Jersey Financial Services Commission. The Company is an open-ended investment company with variable capital having segregated liability between its sub-funds (each a “Fund”) and is organised under the laws of Ireland. The Company is regulated, and has been authorised as a UCITS by the Central Bank of Ireland (the “Financial Regulator”) pursuant to the European Communities (Undertaking for Collective Investment in Transferable Securities) Regulations, 2003 (as amended).


So far this week, Brent Crude prices have strengthened by USD 1.3 per barrel since Monday’s opening. While macroeconomic concerns persist, they have somewhat abated, resulting in muted price reactions. Fundamentals predominantly influence global oil price developments at present. This week, we’ve observed highs of USD 89 per barrel yesterday morning and lows of USD 85.7 per barrel on Monday morning. Currently, Brent Crude is trading at a stable USD 88.3 per barrel, maintaining this level for the past 24 hours.

Additionally, there has been no significant price reaction to Crude following yesterday’s US inventory report (see page 11 attached):
- US commercial crude inventories (excluding SPR) decreased by 6.4 million barrels from the previous week, standing at 453.6 million barrels, roughly 3% below the five-year average for this time of year.
- Total motor gasoline inventories decreased by 0.6 million barrels, approximately 4% below the five-year average.
- Distillate (diesel) inventories increased by 1.6 million barrels but remain weak historically, about 7% below the five-year average.
- Total commercial petroleum inventories (crude + products) decreased by 3.8 million barrels last week.
Regarding petroleum products, the overall build/withdrawal aligns with seasonal patterns, theoretically exerting limited effect on prices. However, the significant draw in commercial crude inventories counters the seasonality, surpassing market expectations and API figures released on Tuesday, indicating a draw of 3.2 million barrels (compared to Bloomberg consensus of +1.3 million). API numbers for products were more in line with the US DOE.
Against this backdrop, yesterday’s inventory report is bullish, theoretically exerting upward pressure on crude prices.
Yet, the current stability in prices may be attributed to reduced geopolitical risks, balanced against demand concerns. Markets are adopting a wait-and-see approach ahead of Q1 US GDP (today at 14:30) and the Fed’s preferred inflation measure, “core PCE prices” (tomorrow at 14:30). A stronger print could potentially dampen crude prices as market participants worry over the demand outlook.
Geopolitical “risk premiums” have decreased from last week, although concerns persist, highlighted by Ukraine’s strikes on two Russian oil depots in western Russia and Houthis’ claims of targeting shipping off the Yemeni coast yesterday.
With a relatively calmer geopolitical landscape, the market carefully evaluates data and fundamentals. While the supply picture appears clear, demand remains the predominant uncertainty that the market attempts to decode.
Brent crude has fallen USD 3/b since the peak of Iran-Israel concerns last week. Still lots of talk about significant Mid-East risk premium in the current oil price. But OPEC+ is in no way anywhere close to loosing control of the oil market. Thus what will really matter is what OPEC+ decides to do in June with respect to production in Q3-24 and the market knows this very well. Saudi Arabia’s social cost-break-even is estimated at USD 100/b today. Also Saudi Arabia’s purse is hurt by 21% US inflation since Jan 2020. Saudi needs more money to make ends meet. Why shouldn’t they get a higher nominal pay as everyone else. Saudi will ask for it

Brent is down USD 3/b vs. last week as the immediate risk for Iran-Israel has faded. But risk is far from over says experts. The Brent crude oil price has fallen 3% to now USD 87.3/b since it became clear that Israel was willing to restrain itself with only a muted counter attack versus Israel while Iran at the same time totally played down the counterattack by Israel. The hope now is of course that that was the end of it. The real fear has now receded for the scenario where Israeli and Iranian exchanges of rockets and drones would escalate to a point where also the US is dragged into it with Mid East oil supply being hurt in the end. Not everyone are as optimistic. Professor Meir Javedanfar who teaches Iranian-Israeli studies in Israel instead judges that ”this is just the beginning” and that they sooner or later will confront each other again according to NYT. While the the tension between Iran and Israel has faded significantly, the pain and anger spiraling out of destruction of Gaza will however close to guarantee that bombs and military strifes will take place left, right and center in the Middle East going forward.
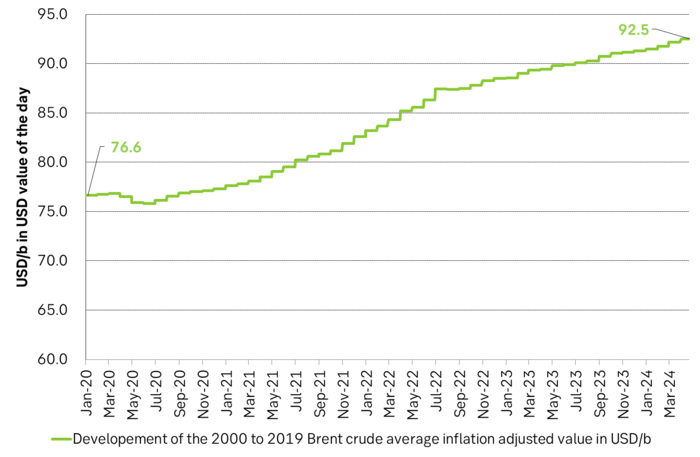
Also OPEC+ wants to get paid. At the start of 2020 the 20 year inflation adjusted average Brent crude price stood at USD 76.6/b. If we keep the averaging period fixed and move forward till today that inflation adjusted average has risen to USD 92.5/b. So when OPEC looks in its purse and income stream it today needs a 21% higher oil price than in January 2020 in order to make ends meet and OPEC(+) is working hard to get it.
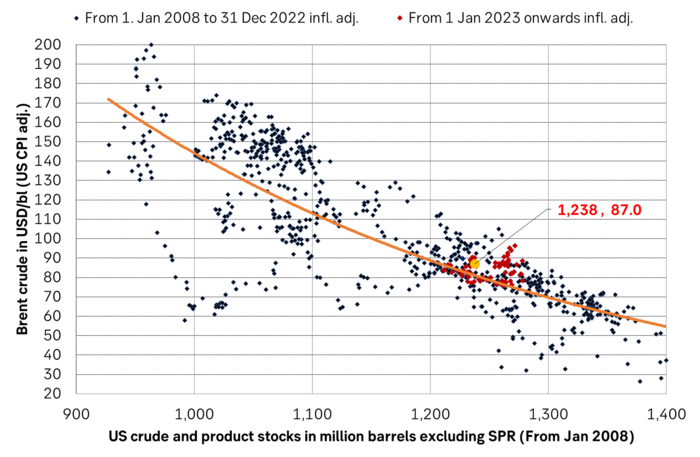
Much talk about Mid-East risk premium of USD 5-10-25/b. But OPEC+ is in control so why does it matter. There is much talk these days that there is a significant risk premium in Brent crude these days and that it could evaporate if the erratic state of the Middle East as well as Ukraine/Russia settles down. With the latest gains in US oil inventories one could maybe argue that there is a USD 5/b risk premium versus total US commercial crude and product inventories in the Brent crude oil price today. But what really matters for the oil price is what OPEC+ decides to do in June with respect to Q3-24 production. We are in no doubt that the group will steer this market to where they want it also in Q3-24. If there is a little bit too much oil in the market versus demand then they will trim supply accordingly.
Also OPEC+ wants to make ends meet. The 20-year real average Brent price from 2000 to 2019 stood at USD 76.6/b in Jan 2020. That same averaging period is today at USD 92.5/b in today’s money value. OPEC+ needs a higher nominal price to make ends meet and they will work hard to get it.
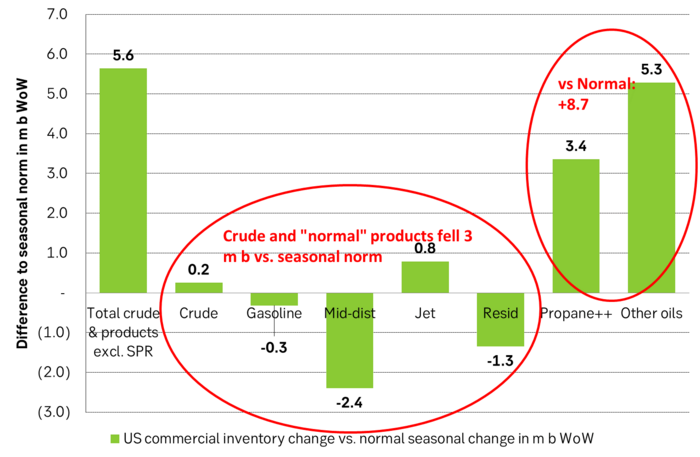
Inflation adjusted Brent crude price versus total US commercial crude and product stocks. A bit above the regression line. Maybe USD 5/b risk premium. But type of inventories matter. Latest big gains were in Propane and Other oils and not so much in crude and products
Total US commercial crude and product stocks usually rise by 4-5 m b per week this time of year. Gains have been very strong lately, but mostly in Propane and Other oils
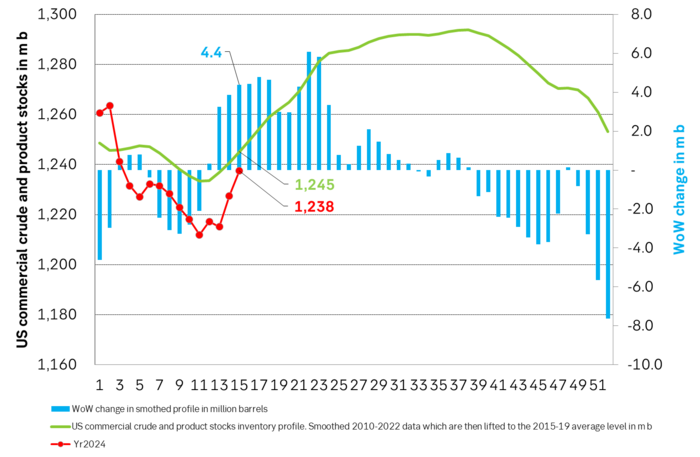
Last week’s US inventory data. Big rise of 10 m b in commercial inventories. What really stands out is the big gains in Propane and Other oils
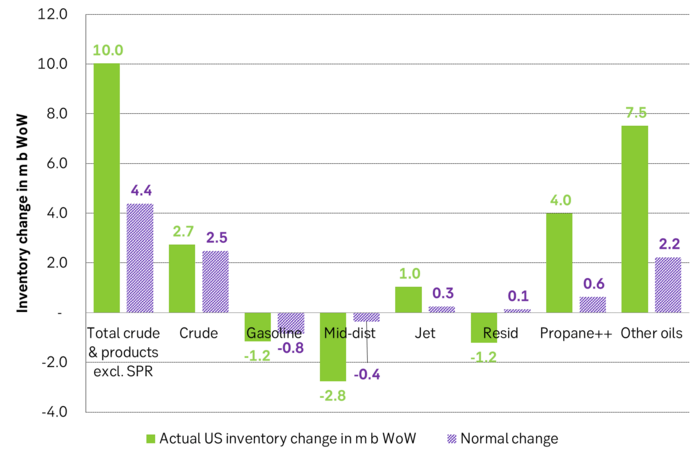
Take actual changes minus normal seasonal changes we find that US commercial crude and regular products like diesel, gasoline, jet and bunker oil actually fell 3 m b versus normal change.
Historically positive Nat gas to EUA correlation will likely switch to negative in 2026/27 onward
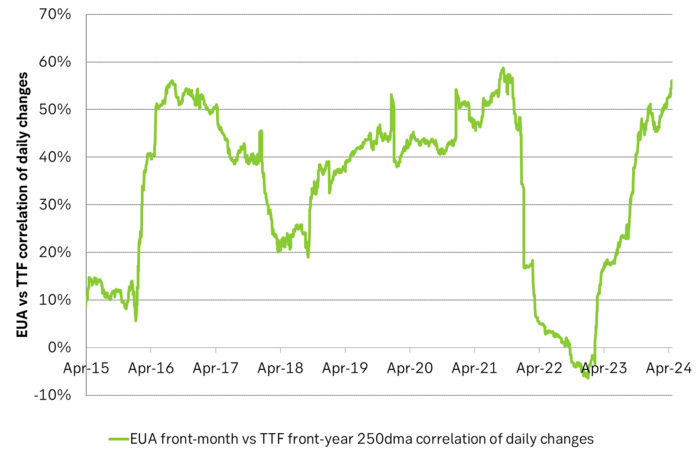
Historically there has been a strong, positive correlation between EUAs and nat gas prices. That correlation is still fully intact and possibly even stronger than ever as traders increasingly takes this correlation as a given with possible amplification through trading action.
The correlation broke down in 2022 as nat gas prices went ballistic but overall the relationship has been very strong for quite a few years.
The correlation between nat gas and EUAs should be positive as long as there is a dynamical mix of coal and gas in EU power sector and the EUA market is neither too tight nor too weak:
Nat gas price UP => ”you go black” by using more coal => higher emissions => EUA price UP
But in the future we’ll go beyond the dynamically capacity to flex between nat gas and coal. As the EUA price moves yet higher along with a tightening carbon market the dynamical coal to gas flex will max out. The EUA price will then trade significantly above where this flex technically will occur. There will still be quite a few coal fired power plants running since they are needed for grid stability and supply amid constrained local grids.
As it looks now we still have such overall coal to gas flex in 2024 and partially in 2025, but come 2026 it could be all maxed out. At least if we look at implied pricing on the forward curves where the forward EUA price for 2026 and 2027 are trading way above technical coal to gas differentials. The current forward pricing implications matches well with what we theoretically expect to see as the EUA market gets tighter and marginal abatement moves from the power sector to the industrial sector. The EUA price should then trade up and way above the technical coal to gas differentials. That is also what we see in current forward prices for 2026 and 2027.
The correlation between nat gas and EUAs should then (2026/27 onward) switch from positive to negative. What is left of coal in the power mix will then no longer be dynamically involved versus nat gas and EUAs. The overall power price will then be ruled by EUA prices, nat gas prices and renewable penetration. There will be pockets with high cost power in the geographical points where there are no other alternatives than coal.
The EUA price is an added cost of energy as long as we consume fossil energy. Thus both today and in future years we’ll have the following as long as we consume fossil energy:
EUA price UP => Pain for consumers of energy => lower energy consumption, faster implementation of energy efficiency and renewable energy => lower emissions
The whole idea with the EUA price is after all that emissions goes down when the EUA price goes up. Either due to reduced energy consumption directly, accelerated energy efficiency measures or faster switch to renewable energy etc.
Let’s say that the coal to gas flex is maxed out with an EUA price way above the technical coal to gas differentials in 2026/27 and later. If the nat gas price then goes up it will no longer be an option to ”go black” and use more coal as the distance to that is too far away price vise due to a tight carbon market and a high EUA price. We’ll then instead have that:
Nat gas higher => higher energy costs with pain for consumers => weaker nat gas / energy demand & stronger drive for energy efficiency implementation & stronger drive for more non-fossil energy => lower emissions => EUA price lower
And if nat gas prices goes down it will give an incentive to consume more nat gas and thus emit more CO2:
Cheaper nat gas => Cheaper energy costs altogether, higher energy and nat gas consumption, less energy efficiency implementations in the broader economy => emissions either goes up or falls slower than before => EUA price UP
Historical and current positive correlation between nat gas and EUA prices should thus not at all be taken for granted for ever and we do expect this correlation to switch to negative some time in 2026/27.
In the UK there is hardly any coal left at all in the power mix. There is thus no option to ”go black” and burn more coal if the nat gas price goes up. A higher nat gas price will instead inflict pain on consumers of energy and lead to lower energy consumption, lower nat gas consumption and lower emissions on the margin. There is still some positive correlation left between nat gas and UKAs but it is very weak and it could relate to correlations between power prices in the UK and the continent as well as some correlations between UKAs and EUAs.
Correlation of daily changes in front month EUA prices and front-year TTF nat gas prices, 250dma correlation.
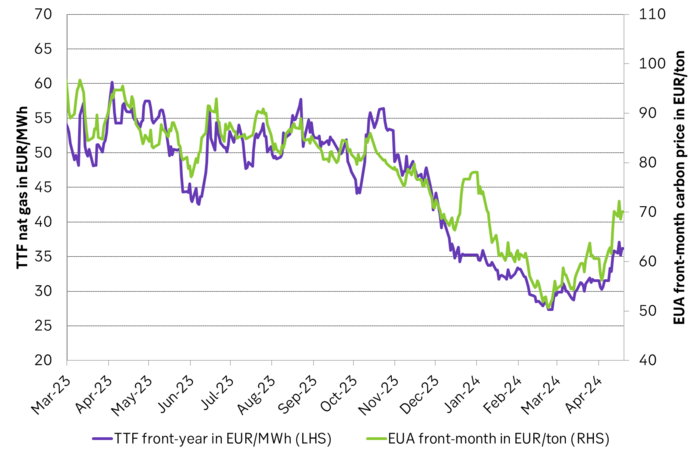
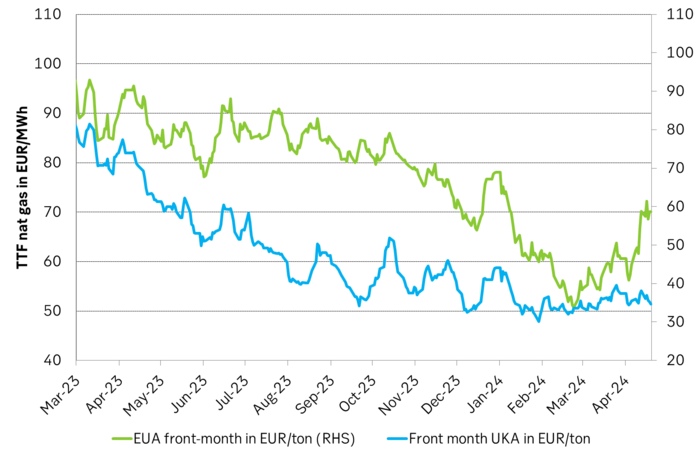
EUA price vs front-year TTF nat gas price since March 2023
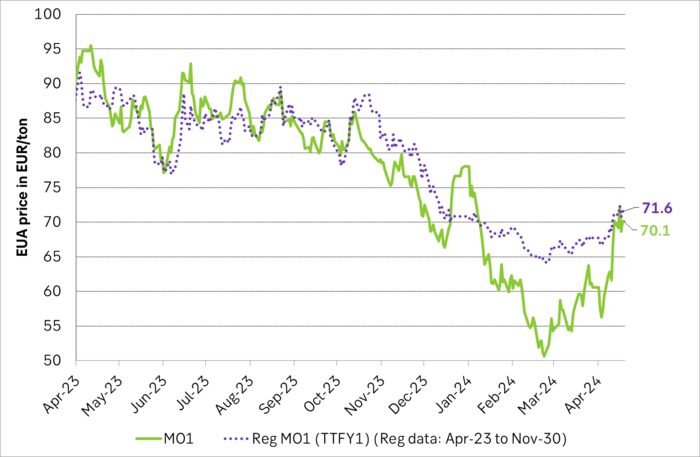
Front-month EUA price vs regression function of EUA price vs. nat gas derived from data from Apr to Nov last year.
The EUA price vs the UKA price. Correlations previously, but not much any more.
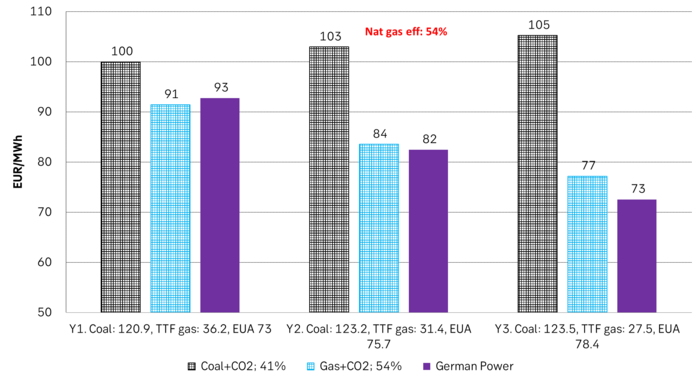
Forward German power prices versus clean cost of coal and clean cost of gas power. Coal is totally priced out vs power and nat gas on a forward 2026/27 basis.
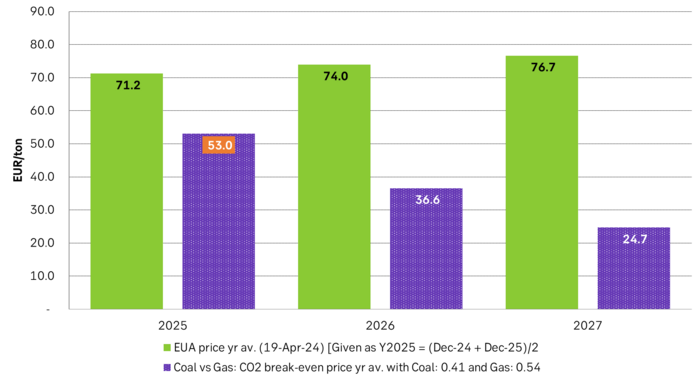
Forward price of EUAs versus technical level where dynamical coal to gas flex typically takes place. EUA price for 2026/27 is at a level where there is no longer any price dynamical interaction or flex between coal and nat gas. The EUA price should/could then start to be negatively correlated to nat gas.
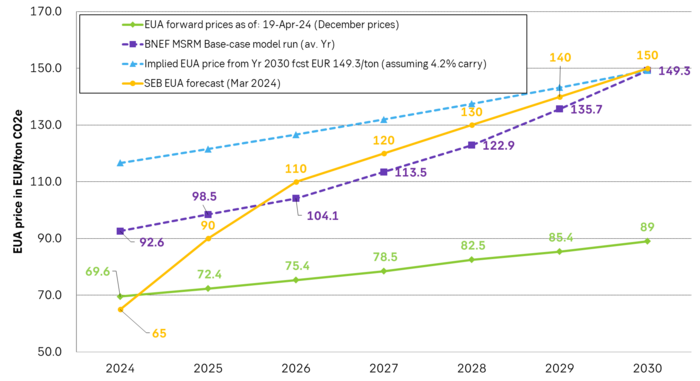
Forward EAU price vs. BNEF base model run (look for new update will come in late April), SEB’s EUA price forecast.


Londons roll som ett globalt nav inom råvaruhandeln
’wait and see’ mode
Also OPEC+ wants to get compensation for inflation

Oljan letar efter en högre botten

Börsveckan ger en köprekommendation till aktien i oljeservicebolaget Beerenberg

Guldpriset når nytt all time high och bryter igenom 2300 USD

USAs stigande konsumtion av naturgas

Centralbanker fortsatte att köpa guld under februari

Kakaomarknaden är extrem för tillfället

Hur mår den svenska skogsbraschen? Två favoritaktier
-
 Nyheter3 veckor sedan
Guldpriset når nytt all time high och bryter igenom 2300 USD
-
 Nyheter3 veckor sedan
USAs stigande konsumtion av naturgas
-
 Nyheter3 veckor sedan
Centralbanker fortsatte att köpa guld under februari
-
 Nyheter3 veckor sedan
Kakaomarknaden är extrem för tillfället
-
 Nyheter3 veckor sedan
Hur mår den svenska skogsbraschen? Två favoritaktier
-

 Nyheter4 veckor sedan
Boliden på 20 minuter
-

 Nyheter3 veckor sedan
Betydande underskott i utbudet av olja kan få priset att blossa upp
-

 Nyheter4 veckor sedan
Myten om guld – Den magiska metallen född från stjärnstoft