

Analys
Risk hedges in favour on heightened geopolitical risks
 Geopolitical risks remained in focus last week, with the Ukrainian crisis somewhat worsened by the resignation of the Ukrainian Prime Minister, while the unrest in the Middle East threatened to get out of hand. According to the IMF, the conflicts in Ukraine and Iraq will likely hinder global growth, which is now forecast to be around 3.4% vs 3.6% predicted back in April. While prices are yet to react to the heightened risks, gold and oil ETPs continued to see strong inflows as investors seek hedge against a further deterioration of the situation.
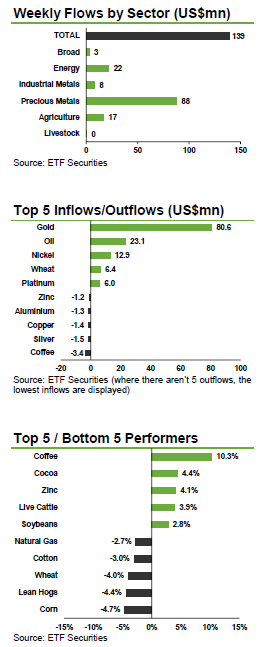 Gold and oil ETPs continue to see strong inflows on geopolitical risks. The Ukrainian crisis and unrest in the Middle East prompted investors to seek a potential hedge against a deterioration of the situation, driving US$80.6mn and US$23.1mn into gold and oil ETPs, respectively. While prices are yet to react to the heightened risks, with the Gaza conflict threatening to escalate following an Israeli missile attack on a UN school for refugees and the Ukrainian Prime Minister resigning, demand for oil and other defensive assets is likely to remain strong.
Long platinum ETPs record US$6mn of inflows on relative value prospects. The platinum to palladium ratio is standing at the lowest level since 2002, despite a South African strike that took over 1moz of platinum off the market. While palladium price is better positioned to benefit from a pick-up in global growth, investors deem the current platinum undervaluation excessive and anticipate platinum playing catch up to palladium.
Expectations of a prolonged ore export ban in Indonesia drive inflows into ETFS Nickel (NICK) to an 8-week high of US$12.8mn. Joko Widodo won the Indonesian presidential election and is due to be sworn into office on the 20th October. While his election might bring a relaxation of the export ban in place since January 2014, it is unlikely that any change will be carried out before next year, meaning that nickel market will remain tight for some time. With Indonesian industrial metal supply substantially reduced by the ban we expect industrial metals to continue being supported as global demand begins to pick up. Cyclical commodities demand is being driven by the Chinese government’s stimulus measures and a quickening pace in the US recovery.
Wheat ETPs see US$6.4mn of inflows as the recent price correction is deemed excessive. The Australian Bureau of Meteorology expects below average rainfall in the north-eastern and south-eastern wheat growing areas over the next few months. Investors are building positions in the hope that the large surpluses forecasted by the USDA prove wrong, which could lead to the next price rally. At the same time, profit taking drove US$2.5mn out of ETFS Daily Leveraged Coffee (LCFE), as the Arabica coffee price jumped by over 10% last week. Heavy rains at the tail end of the harvest in Brazil, the biggest producer, could lower the quality of the coffee beans that are currently being harvested.
Key events to watch this week. While investors focus will likely remain on the evolving situation in the Ukraine and the Middle East, a number of key economic statistics for the US and China will also be monitored to gather the strength in momentum in those economies. July Manufacturing PMIs for China, the US and the UK will be coming out this week, together with Q2 US GDP growth and July non-farm payrolls. The US FOMC rate decision will also be watched closely as investors try to identify the future path for rates in the US.
[box]Denna analys är producerad av ETF Securities och publiceras med tillstånd på Råvarumarknaden.se.[/box]
This communication has been provided by ETF Securities (UK) Limited (“ETFS UK”) which is authorised and regulated by the United Kingdom Financial Conduct Authority (the “FCA”).
This communication is only targeted at qualified or professional investors.
The products discussed in this communication are issued by ETFS Commodity Securities Limited (“CSL”), ETFS Hedged Commodity Securities Limited (“HCSL”), ETFS Hedged Metal Securities Limited (“HMSL”), Swiss Commodity Securities Limited (“SCSL”), ETFS Foreign Exchange Limited (“FXL”), ETFS Industrial Metal Securities Limited (“IML”), ETFS Metal Securities Limited (“MSL”), ETFS Oil Securities Limited (“OSL”), Gold Bullion Securities Limited (“GBS” and, together with CSL, HCSL, HMSL, SCSL, FXL, IML, MSL and OSL, the “Issuers”) and ETFX Fund Company plc (the “Company”). Each Issuer (apart from SCSL) is regulated by the Jersey Financial Services Commission. The Company is an open-ended investment company with variable capital having segregated liability between its sub-funds (each a “Fund”) and is organised under the laws of Ireland. The Company is regulated, and has been authorised as a UCITS by the Central Bank of Ireland (the “Financial Regulator”) pursuant to the European Communities (Undertaking for Collective Investment in Transferable Securities) Regulations, 2003 (as amended).


Market is starting to take US/Iran headlines with a pinch of salt. Brent crude rose $2.8/b yesterday to an official close of $112.1/b. But after that it traded as low as $108.05/b before ending late night at around $109.7/b. Through the day it traded in a range of $106.87 – 112.72/b amid a flurry of news or rumors from Iran and the US. ”US temporary sanctions during negotiations” (falls alarm). ”We will bomb Iran” (not anyhow),… etc. While the market is still fluctuating to this kind of news flow, it is starting to take such headlines with a pinch of salt.

We’ll see. Maybe, maybe not. The Brent M1 contract is trading at $110.2/b this morning which very close to the average ticks through yesterday of $110.4/b.
Trump with bearish, verbal intervention whenever Brent trades above $110/b it seems. What seems to be a pattern is that Trump states something like ”very good negotiations going on with Iran”, ”New leaders in Iran are great,..”, ”Great progress in negotiations,…”, ”Deal in sight,..” etc whenever the Brent M1 contract trades above $110/b. An effort to cool the market. These hot air verbal interventions from Trump used to have a heavy bearish impact on prices, but they now seems to have less and less effect unless they are backed by reality.
As far as we can see there has been no real progress in the negotiations between the US and Iran with both sides still standing by their previous demands.
Iran is getting stronger while the cease fire lasts making a return to war for Trump yet harder. Iran is naturally in constant preparation for a return to war given Trump’s steady threats of bombing Iran again. Iran is naturally doing what ever is possible to prepare for a return to war. And every day the cease fire lasts it is better prepared. This naturally makes it more and more difficult and dangerous for the US to return to warring activity versus Iran as the consequences for energy infrastructure in the Persian Gulf will be more and more severe the longer the cease fire lasts. Israel seems to see it this way as well. That the war is not won and that current frozen state of a cease fire gives Iran opportunity to rebuild military and politically.
Global inventories are drawing down day by day. How much? In the meantime the Strait of Hormuz stays closed. There is varying measures and estimates of how much global inventories are drawing down. Our rough estimate, back of the envelope, is that global inventories are drawing down by at least some 10 mb/d or about 300 mb/d in a balance between loss of supply versus demand destruction. Other estimates we see are a monthly draw of 250-270 mb/d. The IEA only ’measured’ a draw in global observable stocks of 117 mb in April with oil on water rising 53 mb while on shore stocks fell 170 mb. But global stocks are hard to measure with large invisible, unmeasured stocks. As such a back of the envelope approach may be better.
Oil products is what the world is consuming. Oil product prices likely to rise while product stocks fall. Strategic Petroleum Reserves (SPR) are predominantly crude oil. Discharging oil from OECD SPR stocks, a sharp reduction in Chinese crude imports and a reduction in global refinery throughput of 6-7 mb/d has helped to keep crude oil markets satisfactorily supplied. But global inventories are drawing down none the less. And oil products is really what the world is consuming. So if global refinery throughput stays subdued, then demand will eventually have to match the supply of oil products. The likely path forward this summer is a steady draw down in jet fuel, diesel and gasoline. Higher prices for these. Then, if possible, higher refinery throughput and higher usage of crude in response to very profitable refinery margins. And lastly sharper draw in crude stocks and higher prices for these. But some 6 mb/d of oil products used to be exported through the Strait of Hormuz. And it may not be so easy to ramp up refinery activity across the world to compensate. Especially as Ukraine continues to damage Russian refineries as well as Russian crude production and export facilities.
Watch oil product stocks and prices as well as Brent calendar 2027. What to watch for this summer is thus oil product inventories falling and oil product premiums to crude rising. Another measure to watch is the Brent crude 2027 contract as it rises steadily day by day as the Strait of Hormuz stays closed and global oil inventories decline. The latter is close to the highest level since the start of the war and keeps rising.
The Brent M1 contract and the Brent 2027 prices and current price of jet fuel in Europe (ARA). All in USD/b

Our back of the envelope calculation of the global shortage created by the closure of the Strait of Hormuz. Note that 3.5 mb/d of discharge from SPR is also a draw. Note also that ’Forced demand loss’ of 2.5 mb/d is probably temporary and will fall back towards zero as logistics are sorted out leaving ’Price demand loss’ to do the job of balancing the market. Thus a shortfall of at least 9 mb/d created by the closure. More if SPR discharge is included and more if Forced demand loss recedes.

Brent is climbing higher. Front-month is at USD 106.3/bl this morning, close to a weekly high and a USD 9/bl jump from Mondays open. This is the move we flagged as a risk earlier in the week: the market shifting from ”a deal is around the corner” to ”this is going to take longer than we thought”.

Analyst Commodities, SEB
During April, rest-of-year Brent remained remarkably stable around USD 90/bl. A stability which rested on one single assumption: the SoH reopens around 1 May. That assumption is now slowly falling apart.
As we highlighted yesterday: every week of delay beyond 1 May adds (theoretically) ish USD 5/bl to the rest-of-year average, as global inventories draw 100 million barrels per week. i.e., a mid-May reopening implies rest-of-year Brent closer to USD 100/bl, and anything pushing into June or July takes us meaningfully higher.
What’s changed in the last 48 hours:
#1: The US military has formally warned that clearing suspected sea mines from SoH could take up to six months. That is a completely different timescale from what the financial market is pricing. Even a political deal tomorrow does not immediately reopen the strait.
#2: Trump has shifted his tone from urgency to ”strategic patience”. In yesterday’s press conference: ”Don’t rush me… I want a great deal.” The market is reading this as a president no longer feeling pressured by timelines, with the naval blockade running in the background.
#3: So far, the military activity is escalating, not de-escalating. Axios reports Iran is laying more mines in SoH. The US 3rd carrier strike group (USS George H.W. Bush) is arriving with two countermine vessels. Trump yesterday ordered the US Navy to destroy any Iranian boats caught laying mines. While CNN reports that the Pentagon is actively drawing up plans to strike Iranian SoH capabilities and individual Iranian military leaders if the ceasefire collapses. i.e., NOT a attitude consistent with an imminent deal!
Spot crude and product prices eased off the early-April highs on a combination of system rerouting and deal optimism. Both now weakening. Goldman estimates April Gulf output is reduced by 14.5 mbl/d, or 57% of pre-war supply, a number that keeps getting worse the longer this drags on.
Demand-side adaptation is ongoing: S. Korea has cut its Middle East crude dependence from 69% to 56% by pulling more from the Americas and Africa, and Japan is kicking off a second round of SPR releases from 1 May. But SPRs are finite.
Ref. to the negotiations, we should not bet on speed. The current Iranian leadership is dominated by genuine hardliners willing to absorb economic pain and run the clock to extract concessions. That is not a setup for a rapid resolution. US/Israeli media briefings keep framing the delay as ”internal Iranian divisions”, the reality is more complicated and points toward weeks and months, not days.
Our point is that the complexity is large, and higher prices have only just started (given a scenario where the negotiations drag out in time). The market spent April leaning on the USD 90/bl rest-of-year assumption; that case is diminishing by the hour. If ”early May reopening” is replaced by ”June, July or later” over the next week or two, both crude and products have meaningful room to reprice higher from here. There is a high risk being short energy and betting on any immediate political resolution(!).
Down on Friday. Up on Monday. The Brent June crude oil contract traded down 5.1% last week to a close of $90.38/b. It reached a high of $103.87/b last Monday and a low of $86.09/b on Friday as Iran announced that the Strait of Hormuz was fully open for transit. That quickly changed over the weekend as the US upheld its blockade of Iranian oil exports while Iran naturally responded by closing the SoH again. The US blew a hole in the engine room of the Iranian ship TOUSKA and took custody of the ship on Sunday. Brent crude is up 5.6% this morning to $95.4/b.
The cease-fire is expiring tomorrow. The US has said it will send a delegation for a second round of negotiations in Islamabad in Pakistan. But Iran has for now rejected a second round of talks as it views US demands as unrealistic and excessive while the US is also blocking the Strait of Hormuz.
While Brent is up 5% this morning, the financial market is still very optimistic that progress will be made. That talks will continue and that the SoH will fully open by the start of May which is consistent with a rest-of-year average Brent crude oil price of around $90/b with the market now trading that balance at around $88/b.
Financial optimism vs. physical deterioration. We have a divergence where the financial market is trading negotiations, improvements and resolution while at the same time the physical market is deteriorating day by day. Physical oil flows remain constrained by disrupted flows, longer voyage times and elevated freight and insurance costs.
Financial markets are betting that a US/Iranian resolution will save us in time from violent shortages down the road. But every day that the SoH remains closed is bringing us closer to a potentially very painful point of shortages and much higher prices.
The US blockade is also a weapon of leverage against its European and Asian allies. When Iran closed the SoH it held the world economy as a hostage against the US. The US blockade of the SoH is of course blocking Iranian oil exports. But it is also an action of disruption directed towards Europe and Asia. The US has called for the rest of the world to engaged in the war with Iran: ”If you want oil from the Persian Gulf, then go and get it”. A risk is that the US plays brinkmanship with the global oil market directed towards its European and Asian allies and maybe even towards China to force them to engage and take part. Maybe unthinkable. But unthinkable has become the norm with Trump in the White House.


Sommarväder skapar prisrally på elbörsen
Oil product price pain is set to rise as the Strait of Hormuz stays closed into summer

Solkraften pressar elpriserna dagtid

Michel Gubel ger sin syn på oljemarknaden