

Analys
More US shale oil – But it will be needed

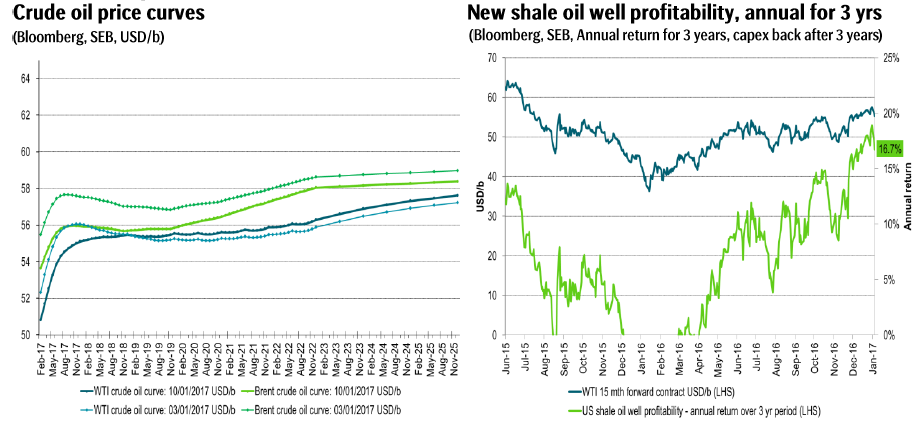
 Price action – Buying now may be as good as it gets in H1-17
The front month Brent crude oil contract lost 2.4% yesterday with a close of $53.64/b. The longer dated contracts also lost some territory but not as much. Thus the front end of the curve pushed lower as the overly brave bulls who charged into the new year with record high net long WTI speculative positions took cover and shed some of their long specs. Last night the US EIA lifted its US crude oil production forecast for 2017 which also helped to push down the price. At the low Brent traded down to $53.58/b and thus just below the technical level of $53.63/b which we envisioned it would breach in this highly speculatively driven sell-off. We think that few envision that Brent crude at sub-$50/b is a viable price in H1-17 amid OPEC production cuts tightening up the market. If last night’s low of $53.58/b turns out to be the low point remains to be seen. However, we do think that buying in the territory between the current price of $53.88/b (this morning) and down to $50/b is probably as good as it gets for buyers in H1-17. Thus it comes back to this itching decision: Buy now at $53.88/b or hold out for possibly yet lower prices? This evening we have the US EIA’s oil inventory data at 16:00 CET and preliminary data points to no optimism for the bulls this time. The US API last night indicated that US oil inventories last week developed as follows: Crude: +1.5 mb, Gasoline: +1.7 mb and Distillates: +5.5 mb. So up across the board. On Friday we are probably going to see the first weekly rig count which was not impacted and overshadowed by the Christmas holidays. Also it is going to be now a full 6 weeks since OPEC decided to cut production back in Nov 30th and as such the effect of higher prices should start to filter through to higher rig counts. Thus still some bearish events which might hit the oil price bearishly. However, since the start of the year we have seen some increasing instability in both Libya and Nigeria which quickly could turn expectations for higher production to disappointment and thus higher prices.
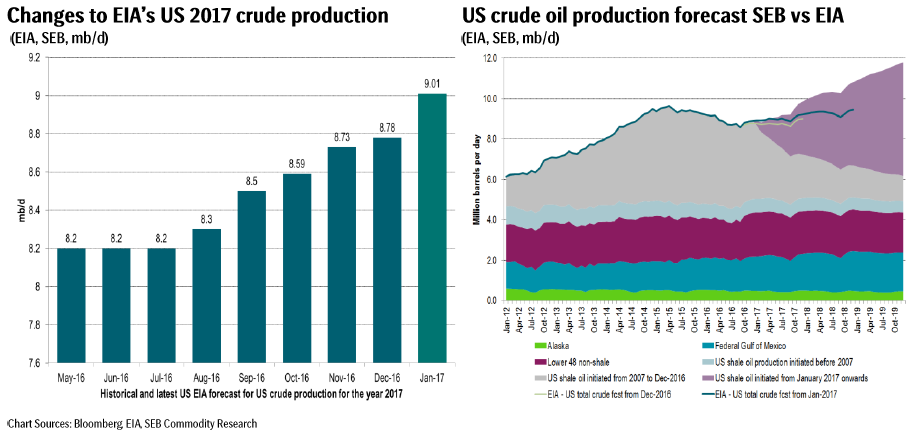
The US EIA lifts projected US crude production yet higher – Will be the norm in H1-17
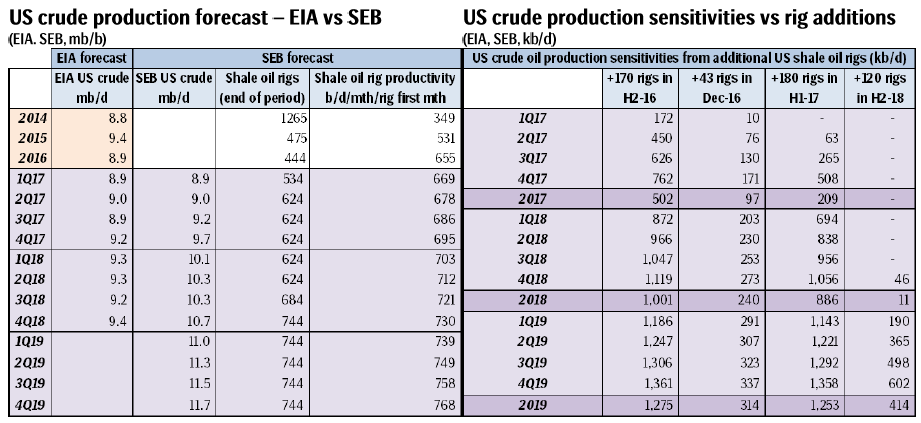
The US EIA yesterday released its January Short Term Energy Outlook (STEO) with yet another solid revision higher for its forecasted US crude oil production. For 2017 it lifted its predicted US crude production by 230 kb/d to 9.01 mb/d on average. Going back to July 2016 it has thus lifted its 2017 prognosis by 810 kb/d. Back in July 2016 it probably assumed no additions of US shale oil rigs for H2-16. A total of 170 rigs were however added into the market and volume productivity also continued to rise at an annual pace of 20%. In our US crude oil model, if we keep the latest updated shale oil volume productivity fixed at latest updated level and move the 170 shale oil rigs added in H2-16 in and out of our model we get a delta production of 502 kb/d of additional US shale oil crude production for 2017 delivery. Back in 2016 we stated that September 2016 probably would be the low point for US crude oil production. That is now also the forecast from the US EIA.
Our calculated return for a new shale oil well investment show that the annual, 3 year return, all money back after 3 years, no tail production profits had an average return of 1.2% in H1-16, 11.3% return in H2-16. Since OPEC decided to cut it has however averaged 16.7% boosting the incentive to invest yet further.
For H1-17 we expect 30 rigs per month or a total of 180 rigs for the half year to be added to the market as oil prices stay at $55-60/b during the period. In our view +180 rigs for H1-17 is a cautious estimate given that profitability for new shale oil investments will be substantially higher in H1-17 than in H2-16. We calculate that the extra 180 rigs in H1-17 will add 209 kb/d to our supply forecast for 2017 and 886 kb/d to our supply forecast for 2018. Only by bringing no additional rigs going forward do we get a US crude oil supply forecast on par with the latest US EIA forecast. As such we expect 30 rigs to be added each month through H1-17 and following we expect the US EIA to lift its 2017 and 2018 US crude oil production every month accordingly. Thus the relentless increase in US EIA’s forecasted US crude production which we experienced through H2-16 is set to continue also in H1-17. As far as we can see the US EIA hardly assumes any additional US shale oil rigs to be added into the market in H1-17 versus what is already active at the moment. We calculate every 30 shale oil rigs added and activated in H1-17 will add approximately 150 kb/d to the US 2018 crude production.
We expect to see constant revisions higher for US shale oil production in H1-17 by the EIA. This is not necessarily so bad because we think the oil will be needed. But the market will not need more rigs in H2-17 and the oil price has to adjust lower in H2-17 in order to avoid yet more rigs into the market.
Selected graphs and tables
Kind regards
Bjarne Schieldrop
Chief analyst, Commodities
SEB Markets
Merchant Banking
Down to the lowest since early May. Brent crude has fallen sharply the latest four days. It closed at USD 64.11/b yesterday which is the lowest since early May. It is staging a 1.3% rebound this morning along with gains in both equities and industrial metals with an added touch of support from a softer USD on top.

What stands out the most to us this week is the collapse in the Dubai one to three months time-spread.
Dubai is medium sour crude. OPEC+ is in general medium sour crude production. Asian refineries are predominantly designed to process medium sour crude. So Dubai is the real measure of the balance between OPEC+ holding back or not versus Asian oil demand for consumption and stock building.
A sharp weakening of the front-end of the Dubai curve. The front-end of the Dubai crude curve has been holding out very solidly throughout this summer while the front-end of the Brent and WTI curves have been steadily softening. But the strength in the Dubai curve in our view was carrying the crude oil market in general. A source of strength in the crude oil market. The core of the strength.
The now finally sharp decline of the front-end of the Dubai crude curve is thus a strong shift. Weakness in the Dubai crude marker is weakness in the core of the oil market. The core which has helped to hold the oil market elevated.
Facts supports the weakening. Add in facts of Iraq lifting production from Kurdistan through Turkey. Saudi Arabia lifting production to 10 mb/d in September (normal production level) and lifting exports as well as domestic demand for oil for power for air con is fading along with summer heat. Add also in counter seasonal rise in US crude and product stocks last week. US oil stocks usually decline by 1.3 mb/week this time of year. Last week they instead rose 6.4 mb/week (+7.2 mb if including SPR). Total US commercial oil stocks are now only 2.1 mb below the 2015-19 seasonal average. US oil stocks normally decline from now to Christmas. If they instead continue to rise, then it will be strongly counter seasonal rise and will create a very strong bearish pressure on oil prices.
Will OPEC+ lift its voluntary quotas by zero, 137 kb/d, 500 kb/d or 1.5 mb/d? On Sunday of course OPEC+ will decide on how much to unwind of the remaining 1.5 mb/d of voluntary quotas for November. Will it be 137 kb/d yet again as for October? Will it be 500 kb/d as was talked about earlier this week? Or will it be a full unwind in one go of 1.5 mb/d? We think most likely now it will be at least 500 kb/d and possibly a full unwind. We discussed this in a not earlier this week: ”500 kb/d of voluntary quotas in October. But a full unwind of 1.5 mb/d”
The strength in the front-end of the Dubai curve held out through summer while Brent and WTI curve structures weakened steadily. That core strength helped to keep flat crude oil prices elevated close to the 70-line. Now also the Dubai curve has given in.

Brent crude oil forward curves

Total US commercial stocks now close to normal. Counter seasonal rise last week. Rest of year?

Total US crude and product stocks on a steady trend higher.

Analys
OPEC+ will likely unwind 500 kb/d of voluntary quotas in October. But a full unwind of 1.5 mb/d in one go could be in the cards
Down to mid-60ies as Iraq lifts production while Saudi may be tired of voluntary cut frugality. The Brent December contract dropped 1.6% yesterday to USD 66.03/b. This morning it is down another 0.3% to USD 65.8/b. The drop in the price came on the back of the combined news that Iraq has resumed 190 kb/d of production in Kurdistan with exports through Turkey while OPEC+ delegates send signals that the group will unwind the remaining 1.65 mb/d (less the 137 kb/d in October) of voluntary cuts at a pace of 500 kb/d per month pace.
Signals of accelerated unwind and Iraqi increase may be connected. Russia, Kazakhstan and Iraq were main offenders versus the voluntary quotas they had agreed to follow. Russia had a production ’debt’ (cumulative overproduction versus quota) of close to 90 mb in March this year while Kazakhstan had a ’debt’ of about 60 mb and the same for Iraq. This apparently made Saudi Arabia angry this spring. Why should Saudi Arabia hold back if the other voluntary cutters were just freeriding? Thus the sudden rapid unwinding of voluntary cuts. That is at least one angle of explanations for the accelerated unwinding.
If the offenders with production debts then refrained from lifting production as the voluntary cuts were rapidly unwinded, then they could ’pay back’ their ’debts’ as they would under-produce versus the new and steadily higher quotas.
Forget about Kazakhstan. Its production was just too far above the quotas with no hope that the country would hold back production due to cross-ownership of oil assets by international oil companies. But Russia and Iraq should be able to do it.
Iraqi cumulative overproduction versus quotas could reach 85-90 mb in October. Iraq has however steadily continued to overproduce by 3-5 mb per month. In July its new and gradually higher quota came close to equal with a cumulative overproduction of only 0.6 mb that month. In August again however its production had an overshoot of 100 kb/d or 3.1 mb for the month. Its cumulative production debt had then risen to close to 80 mb. We don’t know for September yet. But looking at October we now know that its production will likely average close to 4.5 mb/d due to the revival of 190 kb/d of production in Kurdistan. Its quota however will only be 4.24 mb/d. Its overproduction in October will thus likely be around 250 kb/d above its quota with its production debt rising another 7-8 mb to a total of close to 90 mb.
Again, why should Saudi Arabia be frugal while Iraq is freeriding. Better to get rid of the voluntary quotas as quickly as possible and then start all over with clean sheets.
Unwinding the remaining 1.513 mb/d in one go in October? If OPEC+ unwinds the remaining 1.513 mb/d of voluntary cuts in one big go in October, then Iraq’s quota will be around 4.4 mb/d for October versus its likely production of close to 4.5 mb/d for the coming month..
OPEC+ should thus unwind the remaining 1.513 mb/d (1.65 – 0.137 mb/d) in one go for October in order for the quota of Iraq to be able to keep track with Iraq’s actual production increase.
October 5 will show how it plays out. But a quota unwind of at least 500 kb/d for Oct seems likely. An overall increase of at least 500 kb/d in the voluntary quota for October looks likely. But it could be the whole 1.513 mb/d in one go. If the increase in the quota is ’only’ 500 kb/d then Iraqi cumulative production will still rise by 5.7 mb to a total of 85 mb in October.
Iraqi production debt versus quotas will likely rise by 5.7 mb in October if OPEC+ only lifts the overall quota by 500 kb/d in October. Here assuming historical production debt did not rise in September. That Iraq lifts its production by 190 kb/d in October to 4.47 mb/d (August level + 190 kb/d) and that OPEC+ unwinds 500 kb/d of the remining quotas in October when they decide on this on 5 October.

U.S. commercial crude inventories posted a marginal draw last week, falling by 0.6 million barrels to 414.8 million barrels. Inventories remain 4% below the five-year seasonal average, but the draw is far smaller than last week’s massive 9.3-million-barrel decline. Higher crude imports (+803,000 bl d WoW) and steady refinery runs (93% utilization) helped keep the crude balance relatively neutral.

Yet another drawdown indicates commercial crude inventories continue to trend below the 2015–2022 seasonal norm (~440 million barrels), though at 414.8 million barrels, levels are now almost exactly in line with both the 2023 and 2024 trajectory, suggesting stable YoY conditions (see page 3 attached).
Gasoline inventories dropped by 1.1 million barrels and are now 2% below the five-year average. The decline was broad-based, with both finished gasoline and blending components falling, indicating lower output and resilient end-user demand as we enter the shoulder season post-summer (see page 6 attached).
On the diesel side, distillate inventories declined by 1.7 million barrels, snapping a two-week streak of strong builds. At 125 million barrels, diesel inventories are once again 8% below the five-year average and trending near the low end of the historical range.
In total, commercial petroleum inventories (excl. SPR) slipped by 0.5 million barrels on the week to ish 1,281.5 million barrels. While essentially flat, this ends a two-week streak of meaningful builds, reflecting a return to a slightly tighter situation.
On the demand side, the DOE’s ‘products supplied’ metric (see page 6 attached), a proxy for implied consumption, softened slightly. Total demand for crude oil over the past four weeks averaged 20.5 million barrels per day, up just 0.9% YoY.
Summing up: This week’s report shows a re-tightening in diesel supply and modest draws across the board, while demand growth is beginning to flatten. Inventories remain structurally low, but the tone is less bullish than in recent weeks.


A sharp weakening at the core of the oil market: The Dubai curve

Guld nära 4000 USD och silver 50 USD, därför kan de fortsätta stiga
OPEC+ will likely unwind 500 kb/d of voluntary quotas in October. But a full unwind of 1.5 mb/d in one go could be in the cards

Blykalla och amerikanska Oklo inleder ett samarbete

Fortsatt stabilt elpris – men dubbelt så dyrt som i fjol

Eurobattery Minerals satsar på kritiska metaller för Europas självförsörjning

Mahvie Minerals i en guldtrend

Guldpriset kan närma sig 5000 USD om centralbankens oberoende skadas

OPEC signalerar att de inte bryr sig om oljepriset faller kommande månader
Volatile but going nowhere. Brent crude circles USD 66 as market weighs surplus vs risk
-
 Nyheter4 veckor sedan
Eurobattery Minerals satsar på kritiska metaller för Europas självförsörjning
-
 Nyheter3 veckor sedan
Mahvie Minerals i en guldtrend
-
 Nyheter4 veckor sedan
Guldpriset kan närma sig 5000 USD om centralbankens oberoende skadas
-
 Nyheter4 veckor sedan
OPEC signalerar att de inte bryr sig om oljepriset faller kommande månader
-
Analys3 veckor sedan
Volatile but going nowhere. Brent crude circles USD 66 as market weighs surplus vs risk
-

 Nyheter3 veckor sedan
Aktier i guldbolag laggar priset på guld
-

 Nyheter3 veckor sedan
Kinas elproduktion slog nytt rekord i augusti, vilket även kolkraft gjorde
-
 Nyheter2 veckor sedan
Tyskland har så höga elpriser att företag inte har råd att använda elektricitet