

Analys
SEB Råvarubrev 10 januari 2017

Vinsthemtagningar inför installationen av Trump.
 MARKNADEN I KORTHET
Nu börjar det dra ihop sig till installationen (20 januari) av till blivande president Trump. Vi börjar också skönja en ökad risk för att markanden börjar inse att uppgångarna i dollar, olja, vissa industrimetaller, aktier och räntor kanske har varit väl starka. Vi skulle därför inte vara allt för förvånade att se delar av dessa rörelser reverseras inför installationen. Därutöver brukar det kinesiska nyåret (28/1 – 2/1) innebära en avsevärt minskad aktivitet i framför allt råvarusektorn. För svensk del så blir torsdagens KPI-statistik en viktig detalj avseende kronan och svenska räntor. På torsdag kommer också den månatliga WASDE rapporten från det amerikanska jordbruksdepartementet (framför allt prognoserna för sojabönor bör tilldra sig intresse). OPEC överenskommelsen har nu trätt ikraft men det kommer att dröja tills vi har korten på bordet om denna fungerar eller ej. En ytterligare försvårande omständighet är att avtalet ger rätt till överskridning t.ex. i januari mot att man drar ned mer senare så det finns gott om utrymme för spekulation.

Anders Söderberg, Redaktör
Råvaror: Sedan mitten av december verkar oljan mer eller mindre ha etablerat ett $54 – 58 intervall. Med de flesta kända positiva nyheter intecknade så blir vi nu mer exponerade mot överraskningar av olika slag (riggar, produktionsstatistik, geopolitik m.m.). Den spekulativa delen av marknaden är också väldigt lång (både WTI och Brent-kontrakt) varför negativa nyheter har potentialen att skapa mer rörelse än positiva sådana. Korrektionerna i basmetaller har utvecklats väl och i vissa fall (zinc och alu) är de möjligtvis redan till ända. Vad gäller koppar och nickel (här blir ytterligare information i mitten av januari avseende gruvsuspenderingarna på Filippinerna av största vikt) är detta mer oklart. Guld och silver har börjat visa begynnande styrka.
Valuta: Dollarn har börjat vackla lite efter den fantastiska uppgången under hösten. Cykelmässigt bör vi inte ha sett toppen men osäkerheten är hursomhelst nu mycket större än tidigare. Den japanska yenen har troligtvis fallit väl mycket och borde korrigera. Den svenska kronan har återhämtat en del av sin tidigare svaghet men är fortsatt osäker. Den turkiska liran har kraschat till nya bottennivåer och ett stort bytesbalansunderskott ställer till det.
Börser: Inställningen är överlag positiv men kortsiktigt ser vi en ökad risk för korrigeringar (Sverige redan i korrektionsfas) på många ställen (en svagare dollar skulle dock kunna ge fördel för tillväxtmarknader).
Räntor: Långa räntor har stigit för mycket (det tyckte vi redan i december) och i princip har vi trampat vatten sedan mitten av december. Kortsiktigt bör vi kunna se lägre obligationsräntor.
OBSERVATIONER I SAMMANDRAG
- Olja – mindre korrektion pressar priset.
- Koppar – ett försök att avsluta korrektionen.
- Guld – återvändande köpare.
- Sojabönor – WASDE rapporten visar vägen.
- USD/SEK – topp eller inte topp? Det är frågan!
- OMXS30 – i andra delen av sin korrektionsfas.
En placering i certifikat och warranter är förknippat med risker. Du kan förlora hela ditt investerade kapital. Läs mer om riskerna i SEB:s offentliggjorda Grundprospekt för certifikat- och warrantprogram på seb.se/cert eller seb.se/mini
OLJA BRENT
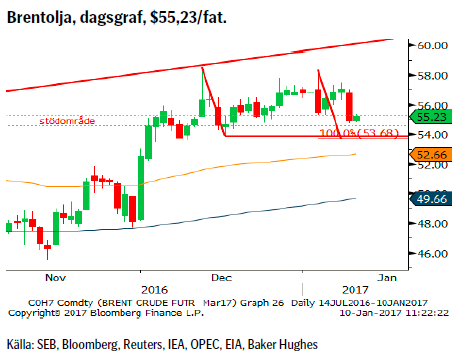 Efter ett par års nedgång så utvecklade sig till slut 2016 till ett år av stigande oljepris. Dock har, som vi skrev i det senaste utskicket, nog mer eller mindre de flesta goda nyheter redan intecknats i dagens pris varför uppgången nu tappar fart. Vad gäller efterlevandet av OPEC-avtalet så kommer det att dröja några månader innan vi ”vet” om det fuskas eller inte (vi tror att det finns starka skäl att inte fuska denna gång). Vi noterar också att spekulanter/förvaltare gick in i 2017 mer eller mindre rekordlånga (de med kalenderår bör alltså ha ett ingångsvärde på cirka $57) vilket ska betraktas som en risk om/när priset korrigerar. Ökad oro i Libyen kan komma att bryta den positiva produktions/exporttrenden, i alla fall på kort sikt. Fortsatt uppgång för amerikanska riggar (och produktivitet) gör att USA’s produktion i år åter bör öka.
Konklusion: Underliggande positiva faktorer men med mycket av det goda finns redan i dagens pris.
OBSERVATIONER
+ Överenskommelsen om ett produktionstak om 32,5m fpd.
+ Algeriet seglar möjligtvis upp som en risk under 2017.
+ Den spekulativa långa netto och bruttopositioneringen har fortsatt att öka (dvs. fortsatt köpande).
+ Libysk risk har den senaste veckan ökat med större spänningar mellan de olika klanerna och den FN-stödda regeringen.
+ Situationen i Venezuela fortsätter att försämras.
+ Tekniskt så ligger vi kvar i en positiv trend.
– Det har tidigare alltid ”fuskats” vid OPEC-avtal.
– Den spekulativa långa nettopositioneringen rekordstor vilket utgör en klar risk om priset skulle börja backa.
– Många företag har redan pris-säkrat sitt oljebehov för 2017.
– Fortsatt god produktivitetsutveckling hos skifferoljeprod.
– Amerikanska skifferoljeproducenter ökar produktionen.
– Libysk och Nigeriansk produktion kan komma att öka.
– Antalet amerikanska borriggar fortsätter stadigt att öka (ökad oljeproduktion följer med 3-6månaders eftersläpning) och är nu tillbaka på nivån för början av 2016.
– Tekniskt så har vi påbörjat en mindre korrektion.
Tillgängliga certifikat:
BULL OLJA X1, X2, X4, X5, & X10 S
BEAR OLJA X1, X2, X4, X5 & X10 S
KOPPAR
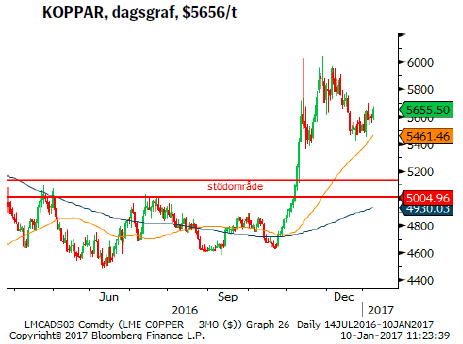 Den korrektion som vi varnade för i förra utskicket (överdrivet kopparrally) har nu materialiserats och priset har fallit med ~3,5%. Volymerna har fortsatt att krympa (helgeffekt?) under nedgången men å andra sidan så är denna inte heller stor nog för att ha minskat den långa (netto och brutto) spekulativa positioneringen i någon högre grad. Även om den närmaste framtiden, givet det kinesiska nyåret (och det stora inslaget av kinesisk spekulation i uppgången) kan förväntas bli avvaktande så borde vi gissningsvis ännu inte kunna avskriva en djupare korrektion.
Konklusion: Vi ser en fortsatt korrektionsrisk efter installationen av Trump och det kinesiska nyårsfirandet.
OBSERVATIONER
+ Stark PPI data från Kina på tisdag morgon mottogs positivt.
+ Efter den snabba lageruppbyggnaden i början av december så har lagren fallit sedan slutet av månaden.
+ Den fallande kinesiska valutan kan ev. skapa ytterligare lageruppbyggnad om man förutspår ytterligare fall för CNY.
+ Trump’s uttalanden har spätt på förväntningarna om stora infrastrukturinvesteringar (överdrivet stora förväntningar).
+ Kv. 3 statistik visade på att bruten malm i högre grad varit av lägre kvalitet vilket ökat spekulationer om att flera stora gruvor passerat max produktion (utan nya investeringar).
+ Marknaden tror på fler produktionsstörningar under 2017 än under 2016 (t.ex. störningar pga. strejker i samband med det Chilenska valet senare i år).
+ Kinesisk efterfrågan håller än så länge ställningarna.
– Det kinesiska nyårsfirandet (tuppens år) 28/1 – 2/2 kommer att ha en dämpande effekt på handeln.
– Kinesiska myndigheter försöker minska spekulationen.
– Producenter gör nu som vi föreslog för ett tag sedan och låser in priset för framtida produktion.
– Den spekulativa positioneringen är fortsatt mycket stor.
– Givet fortsatt fallande produktionskostnader bör produktionen komma att öka (då marginalerna nu är bättre).
Tillgängliga certifikat:
BULL KOPPAR X1, X2, & X4 S
BEAR KOPPAR X2, & X4 S
GULD
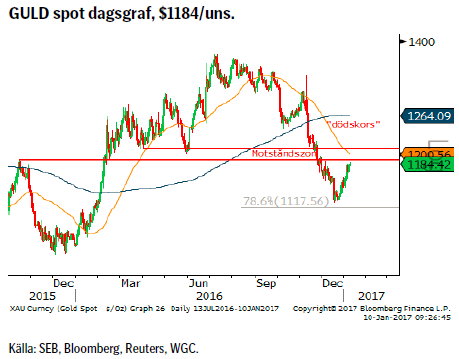 Flera tecken pekar på att intresset för guld så sakteliga sedan några veckor tillbaka har börjat återvända. Med fortsatt stor Asiatisk efterfrågan, Shariareglerna på plats och fallande gruvproduktion (guldskrot som än så länge täcker skillnaden mellan produktion och efterfråga ökade kraftigt under kvartal tre) så bör det finnas en grund för ytterligare ökad efterfrågan och kanske en begynnand dollarkorrektion också kan spä på efterfrågan. Tekniskt sett så är det också alltid av intresse när en korrektion fallit ~78,6 % av föregående rörelse och speciellt så när den första uppgången kommer från en betydande lågpunkt. Dock så har vi ju ett mycket solitt motstånd i $1191/1208 området. Skulle detta brytas så bör det dra till sig ett snabbt stigande intresse.
Konklusion: Det blir intressant att se om vi kan testa huvudmotståndet och hur marknaden i sådana fall agerar.
OBSERVATIONER
+ Säsongsmässigt så är januari och februari starka månader för guld (upp 7 av de senaste 10 åren).
+ En möjlig dollar korrektion.
+ ETP:ers kumulativa köpande under de tre första kvartalen 2016 blev 725 ton
+ Den nettolånga spekulativa positioneringen har fallit med 2/3.
+ ”Trump-onomics”.
+ Ökat inflationstryck gör ”fysiska” tillgångar attraktivare.
+ Fallande produktion (peak-gold 2015).
+ Tekniskt så är vändningen upp från 78,6% nivån väldigt intressant.
– Stigande räntor utgör en motvind för guldpriset (men vi tror nu att de långa räntorna är mogna för en korrektion nedåt).
– Den spekulativa långa nettopositioneringen fortsätter att falla.
– Fallande efterfrågan på smycken, tackor och mynt under kvartal tre.
– Osäkerheten om vad som sker i den Indiska marknaden efter indragningen av kontanter.
– Det kinesiska nyåret med början 28 januari kommer att minska aktiviteten i de flesta råvarumarknader.
– Tekniskt har vi ett tungt motstånd framför oss.
Tillgängliga certifikat:
BULL GULD X1, X2, X4, X5 & X10 S
BEAR GULD X1, X2, X4, X5 & x10 S
SOJABÖNOR
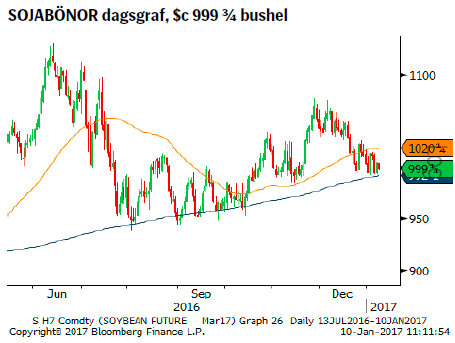 För första gången på fyra år steg priset på sojabönor under 2016 och det trots ett rejält tapp under sommaren och en mindre nedgång under december. Givet ännu ett rekordår för amerikansk produktion så har priset hållit sig rätt väl visandes på en stark kinesisk efterfrågan.
Konklusion: Den kommande WASDE rapporten på torsdag blir en viktig pusselbit för huruvida marknaden börjar röra sig norrut eller om huvudstödet bryts.
OBSERVATIONER
+ Kraftiga regn (norr) och torka (söder) under planteringsperioden i Argentina har skapat en osäkerhet om hur stora arealer som skadats respektive planterats (planteringssäsongen i Argentina slutar normalt i mitten av januari sen måste andra grödor väljas).
+ Några utbrott av sojarost har rapporterats, sprids sporerna under den tidiga skörden kan det påverka volymer och kvalitet på de senare skördarna.
+ Kinesisk svinproduktion fortsätter att öka vilket också ökar efterfrågan på sojabönor.
+ Tekniskt håller vi koll på 233d mv, vilket sedan i somras har fungerat som ett dynamiskt stöd.
– Enligt media har Brasilianska odlare än så länge inte sålt mer än 1/3 av 2016/17 skörden på termin (och nu börjar skörden i Mato Grosso som är först ut).
– Kinesisk produktionsareal för sojabönor förväntas att öka då sämre subsidier för majs leder till att man styr om till soja.
– Även amerikanska bönder verkar styra om majs och veteproduktion till sojabönor givet de låga priserna på de förstnämnda.
– Nya rekordskördar i Sydamerika och USA är relativt troliga under normal väderförhållanden.
– En allt för stark dollar kan försvåra amerikansk export vilket skulle leda till ytterligare lageruppbyggnad.
– Tekniskt sett så föreligger en risk för ytterligare försäljningar om priset faller under $c 985 ¼.
Tillgängliga certifikat:
BULL SOJABÖNOR X1 & X4 S
BEAR SOJABÖNOR X1 & X4 S
USD/SEK
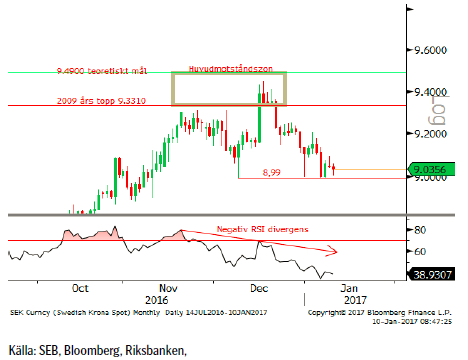 Valutaparet befinner sig för närvarande vid ett vägskäl. Det utmålade motståndsområdet, 9,3310 – 9,4900, har testats vid ett antal tillfällen och än så länge befunnits vara för starkt för att passeras och det trots den amerikanska räntehöjningen. Även om dollarcykeln fortsatt indikerar en topp senare i år så kan en korrektion, efter en så fantastisk uppgång som under hösten, mycket väl bli relativt djup. Vi tror att marknaden i mångt och mycket har prisat in Trump-effekten (och ytterligare räntehöjningar) varför risken just nu snarare är besvikelser (och vinsthemtagningar). Svensk KPI på torsdag blir nästa viktiga hållpunkt.
Konklusion: Full vaksamhet på 8,99 stödet!
OBSERVATIONER
+ Flera räntehöjningar från FED är att vänta.
+ Räntedifferensen mellan USA och Sverige bör fortsätta att öka (vilket gjort kronan till en finansieringsvaluta).
+ Svag svensk inflation ökar sannolikheten för att RB agerar.
+ ”Trumponomics” ger fortsatt en positiv input.
+ Fortsatt, för att inte säga konstant, kris för Italienska banker.
+ Amerikanska aktier är i ropet (alla index har gjort nya toppar).
+ Dollarcykeln (åtta årscykeln sedan 1970-talet) pekar på en ny topp under 2017.
+ Tekniskt så är trenden fortsatt positiv (var vaksam om det skulle uppstå ett ”falskt” brott under 8,99).
– Stigande svensk inflation (ger minskad risk för ytterligare åtgärder från Riksbanken) men är den uthållig eller bara en tillfällig oljeeffekt?
– Amerikanska aktier börjar se dyra ut jämfört med Europeiska.
– Det positiva säsongsmönstret är slut (nästa topp säsongsmässigt bör vara i maj).
– Att Riksbanken inte levererar mer/fler stimulanser.
– Tekniskt så har åtminstone en kortsiktigare negativ signal utlösts (och ytterligare en utlöses vid stängning under 8,99).
Tillgängliga certifikat:
BULL USDSEK X1 & X4 S
BEAR USDSEK X4 S
OMXS30 (TEKNISK UTBLICK)
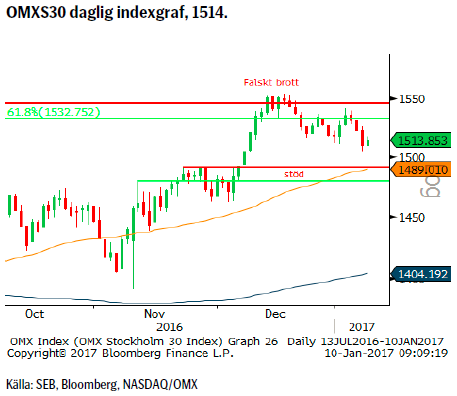 Efter sex dagar (i mitten av december) med försök över 1547 motståndet påbörjades den korrektion som vi senast varnade för (”det mest överköpta läget sedan feb-2015”). Den underliggande trenden är dock opåverkad av detta då de längre tidsperioderna (vecka, månad) inte är överköpta.
Konklusion: Kortsiktigt kvarstår nedåtrisken men vi räknar med att området runt 55d mv fortsätter att vara ett effektivt stöd.
OBSERVATIONER
+ Priset ligger över 55 och 233v medelvärden.
+ Priset har brutit upp över 2015 års topplinje.
+ Mönstret av fallande toppar från våren 2015 har brutits.
+ 55 och 233d mv har nu båda två positiv lutningar och mellanrummet dem emellan ökar (= bra momentum).
+ Ett gyllene kors på plats (55d mv korsar upp över 233d mv).
+ Långsiktig dubbelbotten vid 1240/46 stödet.
– Har nått 1533/1547 motståndet och stötts bort från detta.
– Relativt hög korrelation med oljan som för närvarande korrigerar nedåt.
– Skillnaden mellan 55 och 233d mv är stort.
– Fortsatt risk för stigande obligationsräntor (på sikt, kortsiktigt bör vi se en mindre korrektion).
Tillgängliga certifikat:
BULL OMX X5 S
BEAR OMX X5 S
INFORMATION OM REKOMMENDATIONER
Denna publikation är ett marknadsföringsmaterial för SEBs certifikat-produkter. I och med den nya Marknadsmissbruksförordningen vilken trädde i kraft den tredje juli 2016 har vi inte längre möjlighet att inkludera investeringsrekommendationer rörande certifikat-produkterna.
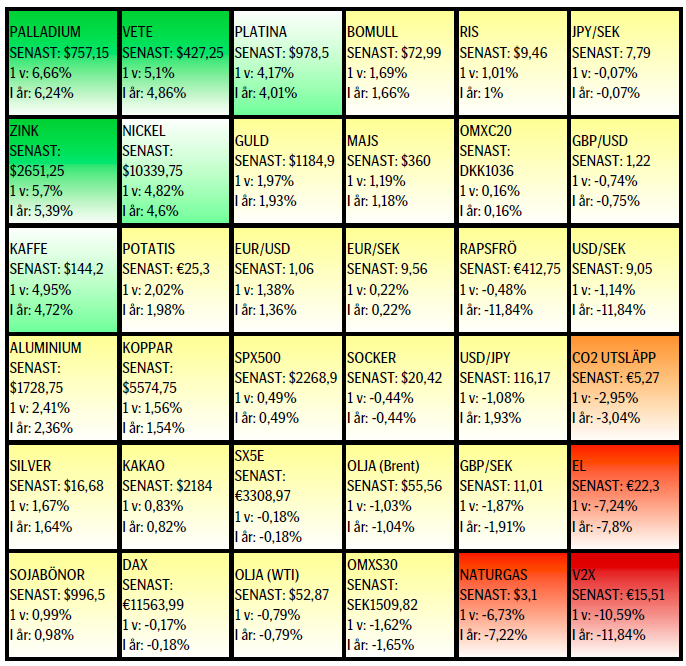
UTVECKLING SENASTE VECKAN SAMT SEDAN ÅRETS BÖRJAN
[box]SEB Veckobrev Veckans råvarukommentar är producerat av SEB:s Commodities Sales desk och publiceras i samarbete och med tillstånd på Råvarumarknaden.se[/box]
KÄLLOR
Bloomberg, Reuters, SEB
VILLKOR
För varje enskilt certifikat/mini future finns Slutliga Villkor som anger de fullständiga villkoren. Slutliga Villkor finns tillgängligt på kurssidan för respektive certifikat/mini future på www.seb.se, Börs & finans, fliken Strukturerade placeringar.
RISKER
En sammanfattning av de risker som är förknippade med Börshandlade certifikat generellt finns i Produktbroschyren för respektive certifikat eller mini future som är tillgängligt på seb.se/cert respektive seb.se/mini. För en fullständig bild av riskerna behöver du ta del av SEB:s offentliggjorda Grundprospekt för Certifikat- och Warrantprogram som är publicerat på www.seb.se/cert respektive seb.se/mini.
DISCLAIMER
Detta marknadsföringsmaterial, framtaget av SEB:s Commodities Sales desk, har upprättats enbart i informationssyfte.
Även om innehållet är baserat på källor som SEB bedömt som tillförlitliga ansvarar SEB inte för fel eller brister i informationen. Den utgör inte oberoende, objektiv investeringsanalys och skyddas därför inte av de bestämmelser som SEB har infört för att förebygga potentiella intressekonflikter. Yttranden från SEB:s Commodities Sales desk kan vara oförenliga med tidigare publicerat material från SEB, då den senare hänvisas uppmanas du att läsa den fullständiga rapporten innan någon åtgärd vidtas.
Dokumentationen utgör inte någon investeringsrådgivning och tillhandahålls till dig utan hänsyn till dina investeringsmål. Du uppmanas att självständigt bedöma och komplettera uppgifterna i denna dokumentation och att basera dina investeringsbeslut på material som bedöms erforderligt. Alla framåtblickande uttalanden, åsikter och förväntningar är föremål för risker, osäkerheter och andra faktorer och kan orsaka att det faktiska resultatet avviker väsentligt från det förväntade. Historisk avkastning är ingen garanti för framtida resultat. Detta dokument utgör inte ett erbjudande att teckna några värdepapper eller andra finansiella instrument. SEB svarar inte för förlust eller skada – direkt eller indirekt, eller av vad slag det vara må – som kan uppkomma till följd av användandet av detta material eller dess innehåll.
Observera att det kan förekomma att SEB, dess ledamöter, dess anställda eller dess moder- och/eller dotterbolag vid olika tillfällen innehar, har innehaft eller kommer att inneha aktier, positioner, rådgivningsuppdrag i samband med corporate finance-transaktioner, investment- eller merchantbanking-uppdrag och/eller lån i de bolag/finansiella instrument som nämns i materialet.
Materialet är avsett för mottagaren, all spridning, distribuering mångfaldigande eller annan användning av detta meddelande får inte ske utan SEB:s medgivande. Materialet riktar sig inte till personer vars medverkan kräver ytterligare prospekt, registrerings- eller andra åtgärder än vad som följer av svensk rätt. Det åligger var och en att iaktta sådana restriktioner. Materialet får inte distribueras i eller till land där distribution kräver ovan nämnda åtgärder eller strider mot reglering i sådant land. Materialet riktar sig således inte till fysiska eller juridiska personer hemmahörande i USA eller i något annat land där publicering eller tillhandahållande av materialet är förbjudet eller strider mot tillämpliga bestämmelser i landet.
Oaktat detta får SEB tillåta omfördelning av materialet till utvald tredje part i enlighet med gällande avtal. Materialet får inte spridas till fysiska eller juridiska personer som är medborgare eller har hemvist i ett land där sådan spridning är otillåten enligt tillämplig lag eller annan bestämmelse.
Skandinaviska Enskilda Banken AB (publ) är ett publikt aktiebolag och står under tillsyn av Finansinspektionen samt de lokala finansiella tillsynsmyndigheter i varje jurisdiktionen där SEB har filial eller dotterbolag.
Market is starting to take US/Iran headlines with a pinch of salt. Brent crude rose $2.8/b yesterday to an official close of $112.1/b. But after that it traded as low as $108.05/b before ending late night at around $109.7/b. Through the day it traded in a range of $106.87 – 112.72/b amid a flurry of news or rumors from Iran and the US. ”US temporary sanctions during negotiations” (falls alarm). ”We will bomb Iran” (not anyhow),… etc. While the market is still fluctuating to this kind of news flow, it is starting to take such headlines with a pinch of salt.

We’ll see. Maybe, maybe not. The Brent M1 contract is trading at $110.2/b this morning which very close to the average ticks through yesterday of $110.4/b.
Trump with bearish, verbal intervention whenever Brent trades above $110/b it seems. What seems to be a pattern is that Trump states something like ”very good negotiations going on with Iran”, ”New leaders in Iran are great,..”, ”Great progress in negotiations,…”, ”Deal in sight,..” etc whenever the Brent M1 contract trades above $110/b. An effort to cool the market. These hot air verbal interventions from Trump used to have a heavy bearish impact on prices, but they now seems to have less and less effect unless they are backed by reality.
As far as we can see there has been no real progress in the negotiations between the US and Iran with both sides still standing by their previous demands.
Iran is getting stronger while the cease fire lasts making a return to war for Trump yet harder. Iran is naturally in constant preparation for a return to war given Trump’s steady threats of bombing Iran again. Iran is naturally doing what ever is possible to prepare for a return to war. And every day the cease fire lasts it is better prepared. This naturally makes it more and more difficult and dangerous for the US to return to warring activity versus Iran as the consequences for energy infrastructure in the Persian Gulf will be more and more severe the longer the cease fire lasts. Israel seems to see it this way as well. That the war is not won and that current frozen state of a cease fire gives Iran opportunity to rebuild military and politically.
Global inventories are drawing down day by day. How much? In the meantime the Strait of Hormuz stays closed. There is varying measures and estimates of how much global inventories are drawing down. Our rough estimate, back of the envelope, is that global inventories are drawing down by at least some 10 mb/d or about 300 mb/d in a balance between loss of supply versus demand destruction. Other estimates we see are a monthly draw of 250-270 mb/d. The IEA only ’measured’ a draw in global observable stocks of 117 mb in April with oil on water rising 53 mb while on shore stocks fell 170 mb. But global stocks are hard to measure with large invisible, unmeasured stocks. As such a back of the envelope approach may be better.
Oil products is what the world is consuming. Oil product prices likely to rise while product stocks fall. Strategic Petroleum Reserves (SPR) are predominantly crude oil. Discharging oil from OECD SPR stocks, a sharp reduction in Chinese crude imports and a reduction in global refinery throughput of 6-7 mb/d has helped to keep crude oil markets satisfactorily supplied. But global inventories are drawing down none the less. And oil products is really what the world is consuming. So if global refinery throughput stays subdued, then demand will eventually have to match the supply of oil products. The likely path forward this summer is a steady draw down in jet fuel, diesel and gasoline. Higher prices for these. Then, if possible, higher refinery throughput and higher usage of crude in response to very profitable refinery margins. And lastly sharper draw in crude stocks and higher prices for these. But some 6 mb/d of oil products used to be exported through the Strait of Hormuz. And it may not be so easy to ramp up refinery activity across the world to compensate. Especially as Ukraine continues to damage Russian refineries as well as Russian crude production and export facilities.
Watch oil product stocks and prices as well as Brent calendar 2027. What to watch for this summer is thus oil product inventories falling and oil product premiums to crude rising. Another measure to watch is the Brent crude 2027 contract as it rises steadily day by day as the Strait of Hormuz stays closed and global oil inventories decline. The latter is close to the highest level since the start of the war and keeps rising.
The Brent M1 contract and the Brent 2027 prices and current price of jet fuel in Europe (ARA). All in USD/b

Our back of the envelope calculation of the global shortage created by the closure of the Strait of Hormuz. Note that 3.5 mb/d of discharge from SPR is also a draw. Note also that ’Forced demand loss’ of 2.5 mb/d is probably temporary and will fall back towards zero as logistics are sorted out leaving ’Price demand loss’ to do the job of balancing the market. Thus a shortfall of at least 9 mb/d created by the closure. More if SPR discharge is included and more if Forced demand loss recedes.

Brent is climbing higher. Front-month is at USD 106.3/bl this morning, close to a weekly high and a USD 9/bl jump from Mondays open. This is the move we flagged as a risk earlier in the week: the market shifting from ”a deal is around the corner” to ”this is going to take longer than we thought”.

Analyst Commodities, SEB
During April, rest-of-year Brent remained remarkably stable around USD 90/bl. A stability which rested on one single assumption: the SoH reopens around 1 May. That assumption is now slowly falling apart.
As we highlighted yesterday: every week of delay beyond 1 May adds (theoretically) ish USD 5/bl to the rest-of-year average, as global inventories draw 100 million barrels per week. i.e., a mid-May reopening implies rest-of-year Brent closer to USD 100/bl, and anything pushing into June or July takes us meaningfully higher.
What’s changed in the last 48 hours:
#1: The US military has formally warned that clearing suspected sea mines from SoH could take up to six months. That is a completely different timescale from what the financial market is pricing. Even a political deal tomorrow does not immediately reopen the strait.
#2: Trump has shifted his tone from urgency to ”strategic patience”. In yesterday’s press conference: ”Don’t rush me… I want a great deal.” The market is reading this as a president no longer feeling pressured by timelines, with the naval blockade running in the background.
#3: So far, the military activity is escalating, not de-escalating. Axios reports Iran is laying more mines in SoH. The US 3rd carrier strike group (USS George H.W. Bush) is arriving with two countermine vessels. Trump yesterday ordered the US Navy to destroy any Iranian boats caught laying mines. While CNN reports that the Pentagon is actively drawing up plans to strike Iranian SoH capabilities and individual Iranian military leaders if the ceasefire collapses. i.e., NOT a attitude consistent with an imminent deal!
Spot crude and product prices eased off the early-April highs on a combination of system rerouting and deal optimism. Both now weakening. Goldman estimates April Gulf output is reduced by 14.5 mbl/d, or 57% of pre-war supply, a number that keeps getting worse the longer this drags on.
Demand-side adaptation is ongoing: S. Korea has cut its Middle East crude dependence from 69% to 56% by pulling more from the Americas and Africa, and Japan is kicking off a second round of SPR releases from 1 May. But SPRs are finite.
Ref. to the negotiations, we should not bet on speed. The current Iranian leadership is dominated by genuine hardliners willing to absorb economic pain and run the clock to extract concessions. That is not a setup for a rapid resolution. US/Israeli media briefings keep framing the delay as ”internal Iranian divisions”, the reality is more complicated and points toward weeks and months, not days.
Our point is that the complexity is large, and higher prices have only just started (given a scenario where the negotiations drag out in time). The market spent April leaning on the USD 90/bl rest-of-year assumption; that case is diminishing by the hour. If ”early May reopening” is replaced by ”June, July or later” over the next week or two, both crude and products have meaningful room to reprice higher from here. There is a high risk being short energy and betting on any immediate political resolution(!).
Down on Friday. Up on Monday. The Brent June crude oil contract traded down 5.1% last week to a close of $90.38/b. It reached a high of $103.87/b last Monday and a low of $86.09/b on Friday as Iran announced that the Strait of Hormuz was fully open for transit. That quickly changed over the weekend as the US upheld its blockade of Iranian oil exports while Iran naturally responded by closing the SoH again. The US blew a hole in the engine room of the Iranian ship TOUSKA and took custody of the ship on Sunday. Brent crude is up 5.6% this morning to $95.4/b.
The cease-fire is expiring tomorrow. The US has said it will send a delegation for a second round of negotiations in Islamabad in Pakistan. But Iran has for now rejected a second round of talks as it views US demands as unrealistic and excessive while the US is also blocking the Strait of Hormuz.
While Brent is up 5% this morning, the financial market is still very optimistic that progress will be made. That talks will continue and that the SoH will fully open by the start of May which is consistent with a rest-of-year average Brent crude oil price of around $90/b with the market now trading that balance at around $88/b.
Financial optimism vs. physical deterioration. We have a divergence where the financial market is trading negotiations, improvements and resolution while at the same time the physical market is deteriorating day by day. Physical oil flows remain constrained by disrupted flows, longer voyage times and elevated freight and insurance costs.
Financial markets are betting that a US/Iranian resolution will save us in time from violent shortages down the road. But every day that the SoH remains closed is bringing us closer to a potentially very painful point of shortages and much higher prices.
The US blockade is also a weapon of leverage against its European and Asian allies. When Iran closed the SoH it held the world economy as a hostage against the US. The US blockade of the SoH is of course blocking Iranian oil exports. But it is also an action of disruption directed towards Europe and Asia. The US has called for the rest of the world to engaged in the war with Iran: ”If you want oil from the Persian Gulf, then go and get it”. A risk is that the US plays brinkmanship with the global oil market directed towards its European and Asian allies and maybe even towards China to force them to engage and take part. Maybe unthinkable. But unthinkable has become the norm with Trump in the White House.


Sommarväder skapar prisrally på elbörsen
Oil product price pain is set to rise as the Strait of Hormuz stays closed into summer

Solkraften pressar elpriserna dagtid

Michel Gubel ger sin syn på oljemarknaden