

Analys
Still upside to crude oil spot prices into Q2-17 but softer again in H2-17

 We expect front month Brent crude to head higher in Q2-17 to average $57.5/b but to toutch above $60/b at times.
Refineries will move back into operation consuming more oil. OPEC is delivering on cuts and inventories will decline.
US crude production is now growing (marginally, annualized) as fast as it did between 2012 and May 2015.
We expect OPEC to end cuts after H1-17 as mission is accomplished: Inventories are steady or declining and spot crude oil prices are equal to or higher than longer dated contracts. Not much more OPEC can do.
We expect the front month Brent crude oil price to fall back in H2-17 in the face of strongly rising US shale oil production and reviving OPEC production.
Brent crude front month price to average $52.5/b in Q4-17 toutching $50/b at times.
Higher than expected US shale oil rig additions since the start of the year has softening our projected deficit in 2019. However, we still see a substantial inventory draw below normal in 2019.
From the news flow:
Exxon will use 50% of its drilling budget for 2017 on US onshore drilling with its production there growing 20% pa to 2025
Libya’s crude oil production falls back again as clashes re-erupt
IEA: OPEC will increase its production capacity by 2 mb/d from 2016 to 2022 with Iraq lifting production to 5.4 mb/d in 2022
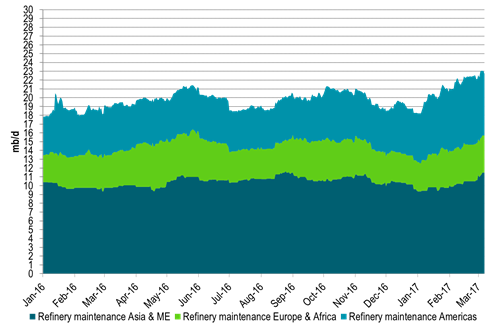
Ch1: Global refinery maintenance increased strongly in Q1-17 – Refineries soon to resume activity
A large increase in global refinery maintenance in Q1-17 left a comparble volume to be stored rather than processed
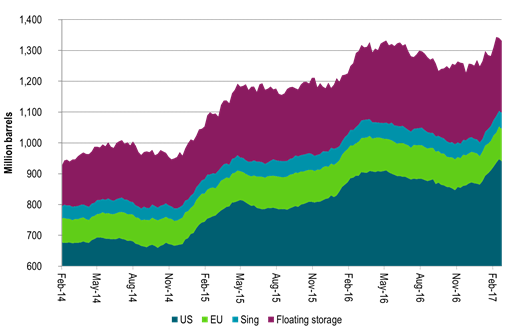
Ch2: Weekly inventories have rissen strongly in Q1-17 – Soon to decline.
OPEC also produced at record high level in Nov and Dec which has hit the market in Q1-17 along with several months of natural lag in the supply chain between production and consumption. Both helping to drive weekly inventory data up strongly in Q1-17
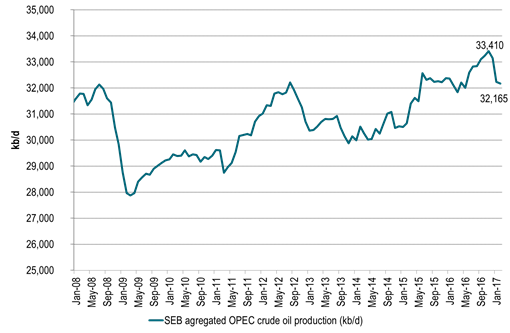
Ch3: OPEC delivers on cuts.
OPEC is delivering on its promises to cut. So when refineries move back on-line after maintenance and we also have the Nov and Dec OPEC production blob cleared out the the market we will see inventories starting to decline in Q2-17.
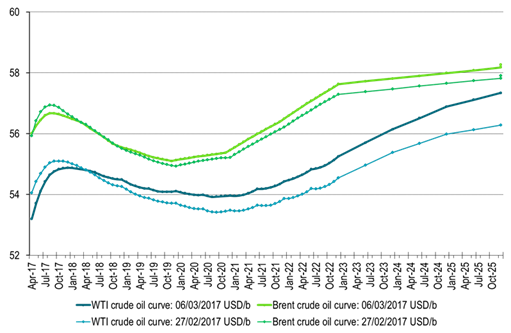
Ch4: Crude oil forward curve soon to move fully into backwardation
The forward crude curves will then move fully into backwardation with also the very front end of the curve (which is still in contango) moving into backwardation.
This is likely to lead front end Brent crude oil price up towards the $60/b mark with our expectation for an average Brent 1mth price of $57.5/b during Q2-17 touching $60/b at times.
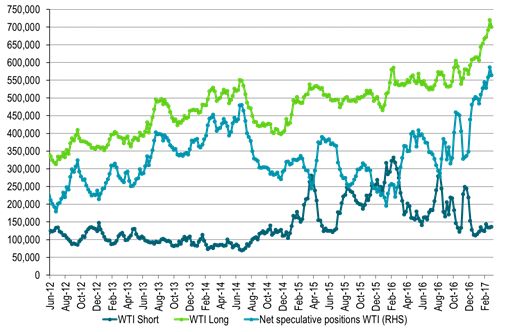
Ch5: Speculators are bullish awaiting that last move into full backwardation
And speculators are bullish accordingly – close to record high net long speculative position in WTI
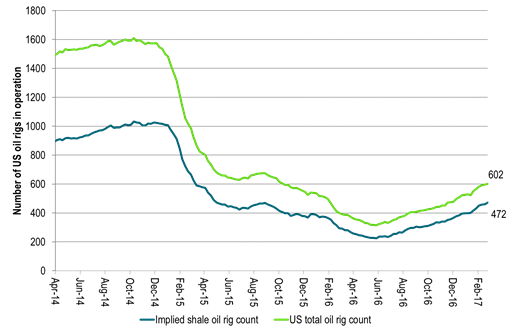
Ch6: US oil rig count moves higher and higher and higher
But US oil rigs are constantly added to the market and at a higher rate than we had expected.
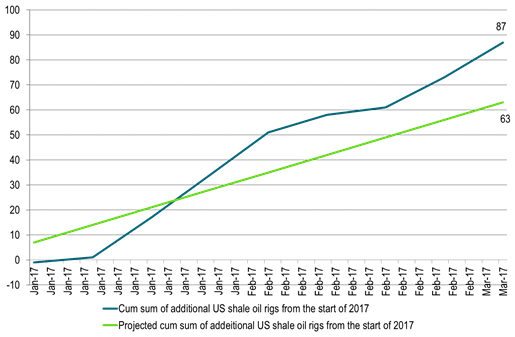
Ch7: More US shale oil rigs have been activated versus what we had expected
More shale oil rigs have been added into activity in the US shale oil space versus what we had expected
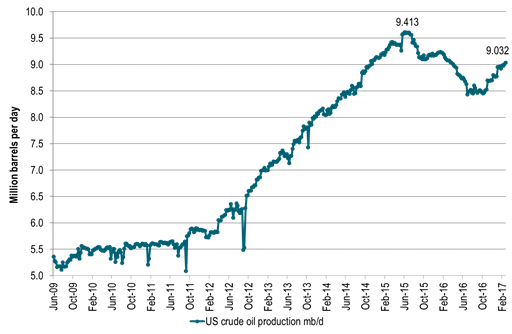
Ch8: Helping to shift US crude oil production growth back into full pre-2015 growth level again
US crude oil production is now on rising trend again adding on average 30 kb/d w/w since the start of the year.
That is equal to a marginal, annualized growth rate of 30 kb/d/week * 52 week = 1560 kb/d/year (1.5 mb/d marginal, annualized growth rate).
That is back to the growth rate seen between 2012 to June 2015.
Ch9: More shale oil rigs than expected means higher forecasted US crude oil production than expected
This impacts our projected US crude oil production for 2017, 2018 and 2019 lifting it higher
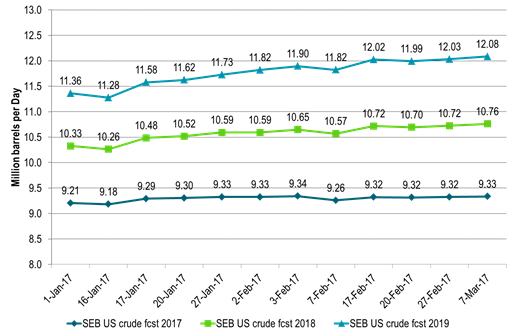
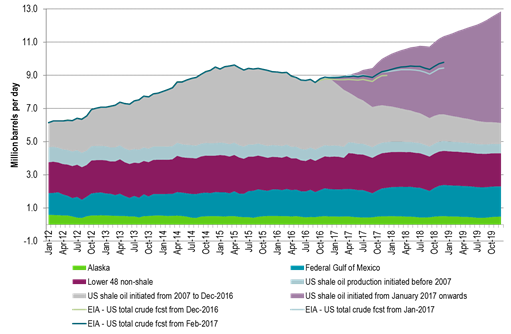
Ch10: With US crude oil production now expected to lift to close to 13 mb/d at the end of 2019
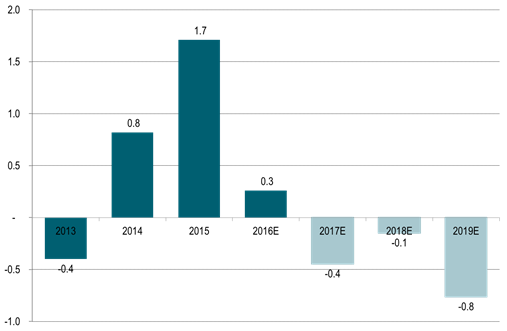
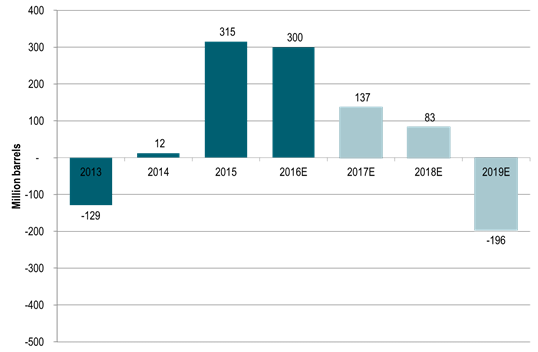
Ch11: Global supply/demand balance still in deficit next three years but not much deficit in 2018 any more
Almost constantly weakening and softening our projected supply/demand balance for the nearest three years.
With our view now that there will be almost no deficit in 2018.
But still a solid deficit and inventory draw coming in 2019 as cuts in investments in conventional supply since 2014 starts to hit the market.
Little conventional legacy investments to add additional supply in 2019 and thus little to counter natural declines in existing conventional production in 2019.
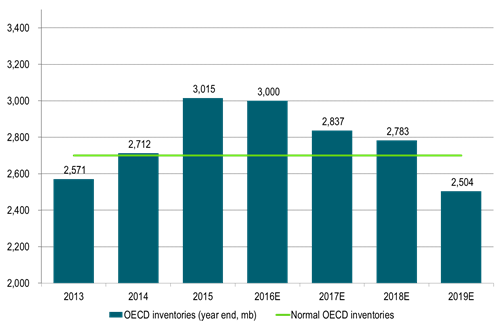
Ch12: End of year OECD inventories to draw substantially below normal in 2019
End of year OECD stocks still to draw substantially below a normal of 2700 million barrels in 2019.
But stocks are likely to end the year above normal for both 2017 and 2018.
Thus few pressure points in the global supply/demand balance during 2017 and 2018 as current elevated oil inventories provides a nice cushion
Ch13: End of year OECD inventories to stand some 200 mb below normal in December 2019
The year 2019 still looks like the year when things could happen to the oil price on the upside.
As end of year OECD inventories could draw down some 200 million barrels below normal
Unless of course demand growth weakens, US shale oil production accelerates even more or oil companies accelerate in-field drilling thus countering conventional declines.
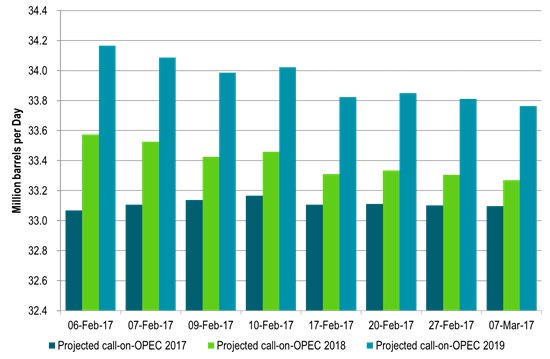
Ch14: Projected call on OPEC has declined since the start of February along with higher US crude oil production projections
As we steadily adjust our US crude oil production higher for 2017, 2018 and 2019 along with higher than expected additions of US shale oil rigs
The need for oil from OPEC declines comparably for the years to come
How far down is OPEC willing to let it slide? Probably not below 33 mb/d for 2018.
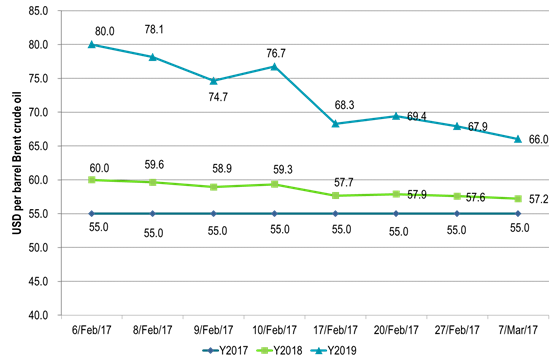
Ch15: Softer supply/demand balance naturally means softer prices
In a dynamic crude oil price forecasting frame the forecasted crude oil price declines along with with a softening forward looking supply/demand balance
(Prices in graph are mathematically extended from the $80/b forecasted at the start of February and are not new price forecast assessments)
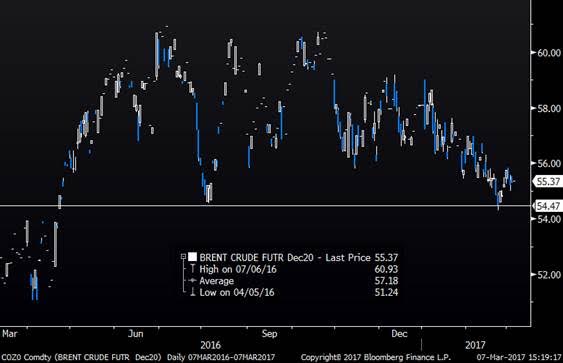
Ch16: Longer dated market prices have deteriorated since the start of the year
Longer dated contracts like Brent crude December 2020 have deteriorated since the start of the year
Probably reflecting the acceleration in US shale oil rig additions in Q1-17
In late February the contract traded at its lowest level since April 2016.
Kind regards
Bjarne Schieldrop
Chief analyst, Commodities
SEB Markets
Merchant Banking
Brent crude has climbed roughly USD 1.5-2 per barrel since Friday, yet falling USD 0.3 per barrel this mornig and currently trading near USD 67.25/bbl after yesterday’s climb. While the rally reflects short-term geopolitical tension, price action has been choppy, and crude remains locked in a broader range – caught between supply-side pressure and spot resilience.

Prices have been supported by renewed Ukrainian drone strikes targeting Russian infrastructure. Over the weekend, falling debris triggered a fire at the 20mtpa Kirishi refinery, following last week’s attack on the key Primorsk terminal.
Argus estimates that these attacks have halted ish 300 kbl/d of Russian refining capacity in August and September. While the market impact is limited for now, the action signals Kyiv’s growing willingness to disrupt oil flows – supporting a soft geopolitical floor under prices.
The political environment is shifting: the EU is reportedly considering sanctions on Indian and Chinese firms facilitating Russian crude flows, while the U.S. has so far held back – despite Bessent warning that any action from Washington depends on broader European participation. Senator Graham has also publicly criticized NATO members like Slovakia and Hungary for continuing Russian oil imports.
It’s worth noting that China and India remain the two largest buyers of Russian barrels since the invasion of Ukraine. While New Delhi has been hit with 50% secondary tariffs, Beijing has been spared so far.
Still, the broader supply/demand balance leans bearish. Futures markets reflect this: Brent’s prompt spread (gauge of near-term tightness) has narrowed to the current USD 0.42/bl, down from USD 0.96/bl two months ago, pointing to weakening backwardation.
This aligns with expectations for a record surplus in 2026, largely driven by the faster-than-anticipated return of OPEC+ barrels to market. OPEC+ is gathering in Vienna this week to begin revising member production capacity estimates – setting the stage for new output baselines from 2027. The group aims to agree on how to define “maximum sustainable capacity,” with a proposal expected by year-end.
While the IEA pegs OPEC+ capacity at 47.9 million barrels per day, actual output in August was only 42.4 million barrels per day. Disagreements over data and quota fairness (especially from Iraq and Nigeria) have already delayed this process. Angola even quit the group last year after being assigned a lower target than expected. It also remains unclear whether Russia and Iraq can regain earlier output levels due to infrastructure constraints.
Also, macro remains another key driver this week. A 25bp Fed rate cut is widely expected tomorrow (Wednesday), and commodities in general could benefit a potential cut.
Summing up: Brent crude continues to drift sideways, finding near-term support from geopolitics and refining strength. But with surplus building and market structure softening, the upside may remain capped.
Brent crude is essentially flat on the week, but after a volatile ride. Prices started Monday near USD 65.5/bl, climbed steadily to a mid-week high of USD 67.8/bl on Wednesday evening, before falling sharply – losing about USD 2/bl during Thursday’s session.
Brent is currently trading around USD 65.8/bl, right back where it began. The volatility reflects the market’s ongoing struggle to balance growing surplus risks against persistent geopolitical uncertainty and resilient refined product margins. Thursday’s slide snapped a three-day rally and came largely in response to a string of bearish signals, most notably from the IEA’s updated short-term outlook.
The IEA now projects record global oversupply in 2026, reinforcing concerns flagged earlier by the U.S. EIA, which already sees inventories building this quarter. The forecast comes just days after OPEC+ confirmed it will continue returning idle barrels to the market in October – albeit at a slower pace of +137,000 bl/d. While modest, the move underscores a steady push to reclaim market share and adds to supply-side pressure into year-end.
Thursday’s price drop also followed geopolitical incidences: Israeli airstrikes reportedly targeted Hamas leadership in Doha, while Russian drones crossed into Polish airspace – events that initially sent crude higher as traders covered short positions.
Yet, sentiment remains broadly cautious. Strong refining margins and low inventories at key pricing hubs like Europe continue to support the downside. Chinese stockpiling of discounted Russian barrels and tightness in refined product markets – especially diesel – are also lending support.
On the demand side, the IEA revised up its 2025 global demand growth forecast by 60,000 bl/d to 740,000 bl/d YoY, while leaving 2026 unchanged at 698,000 bl/d. Interestingly, the agency also signaled that its next long-term report could show global oil demand rising through 2050.
Meanwhile, OPEC offered a contrasting view in its latest Monthly Oil Market Report, maintaining expectations for a supply deficit both this year and next, even as its members raise output. The group kept its demand growth estimates for 2025 and 2026 unchanged at 1.29 million bl/d and 1.38 million bl/d, respectively.
We continue to watch whether the bearish supply outlook will outweigh geopolitical risk, and if Brent can continue to find support above USD 65/bl – a level increasingly seen as a soft floor for OPEC+ policy.
Brent crude makes some gains as Israel’s attack on Hamas in Qatar rattles markets. Brent crude spiked to a high of USD 67.38/b yesterday as Israel made a strike on Hamas in Qatar. But it wasn’t able to hold on to that level and only closed up 0.6% in the end at USD 66.39/b. This morning it is starting on the up with a gain of 0.9% at USD 67/b. Still rattled by Israel’s attack on Hamas in Qatar yesterday. Brent is getting some help on the margin this morning with Asian equities higher and copper gaining half a percent. But the dark cloud of surplus ahead is nonetheless hanging over the market with Brent trading two dollar lower than last Tuesday.

Geopolitical risk premiums in oil rarely lasts long unless actual supply disruption kicks in. While Israel’s attack on Hamas in Qatar is shocking, the geopolitical risk lifting crude oil yesterday and this morning is unlikely to last very long as such geopolitical risk premiums usually do not last long unless real disruption kicks in.
US API data yesterday indicated a US crude and product stock build last week of 3.1 mb. The US API last evening released partial US oil inventory data indicating that US crude stocks rose 1.3 mb and middle distillates rose 1.5 mb while gasoline rose 0.3 mb. In total a bit more than 3 mb increase. US crude and product stocks usually rise around 1 mb per week this time of year. So US commercial crude and product stock rose 2 mb over the past week adjusted for the seasonal norm. Official and complete data are due today at 16:30.
A 2 mb/week seasonally adj. US stock build implies a 1 – 1.4 mb/d global surplus if it is persistent. Assume that if the global oil market is running a surplus then some 20% to 30% of that surplus ends up in US commercial inventories. A 2 mb seasonally adjusted inventory build equals 286 kb/d. Divide by 0.2 to 0.3 and we get an implied global surplus of 950 kb/d to 1430 kb/d. A 2 mb/week seasonally adjusted build in US oil inventories is close to noise unless it is a persistent pattern every week.
US IEA STEO oil report: Robust surplus ahead and Brent averaging USD 51/b in 2026. The US EIA yesterday released its monthly STEO oil report. It projected a large and persistent surplus ahead. It estimates a global surplus of 2.2 m/d from September to December this year. A 2.4 mb/d surplus in Q1-26 and an average surplus for 2026 of 1.6 mb/d resulting in an average Brent crude oil price of USD 51/b next year. And that includes an assumption where OPEC crude oil production only averages 27.8 mb/d in 2026 versus 27.0 mb/d in 2024 and 28.6 mb/d in August.
Brent will feel the bear-pressure once US/OECD stocks starts visible build. In the meanwhile the oil market sits waiting for this projected surplus to materialize in US and OECD inventories. Once they visibly starts to build on a consistent basis, then Brent crude will likely quickly lose altitude. And unless some unforeseen supply disruption kicks in, it is bound to happen.
US IEA STEO September report. In total not much different than it was in January

US IEA STEO September report. US crude oil production contracting in 2026, but NGLs still growing. Close to zero net liquids growth in total.


Tyskland har så höga elpriser att företag inte har råd att använda elektricitet
Brent crude ticks higher on tension, but market structure stays soft

Kinas elproduktion slog nytt rekord i augusti, vilket även kolkraft gjorde

Det stigande guldpriset en utmaning för smyckesköpare

Aktier i guldbolag laggar priset på guld

Meta bygger ett AI-datacenter på 5 GW och 2,25 GW gaskraftverk
Aker BP gör ett av Norges största oljefynd på ett decennium, stärker resurserna i Yggdrasilområdet

Ett samtal om koppar, kaffe och spannmål
Brent sideways on sanctions and peace talks
Sommarens torka kan ge högre elpriser i höst
-
 Nyheter4 veckor sedan
Meta bygger ett AI-datacenter på 5 GW och 2,25 GW gaskraftverk
-
 Nyheter4 veckor sedan
Aker BP gör ett av Norges största oljefynd på ett decennium, stärker resurserna i Yggdrasilområdet
-
 Nyheter4 veckor sedan
Ett samtal om koppar, kaffe och spannmål
-
Analys4 veckor sedan
Brent sideways on sanctions and peace talks
-
 Nyheter4 veckor sedan
Sommarens torka kan ge högre elpriser i höst
-
Analys4 veckor sedan
Brent edges higher as India–Russia oil trade draws U.S. ire and Powell takes the stage at Jackson Hole
-

 Nyheter3 veckor sedan
Mahvie Minerals är verksamt i guldrikt område i Finland
-
Analys3 veckor sedan
Increasing risk that OPEC+ will unwind the last 1.65 mb/d of cuts when they meet on 7 September