Analys
Still upside to crude oil spot prices into Q2-17 but softer again in H2-17


Refineries will move back into operation consuming more oil. OPEC is delivering on cuts and inventories will decline.
US crude production is now growing (marginally, annualized) as fast as it did between 2012 and May 2015.
We expect OPEC to end cuts after H1-17 as mission is accomplished: Inventories are steady or declining and spot crude oil prices are equal to or higher than longer dated contracts. Not much more OPEC can do.
We expect the front month Brent crude oil price to fall back in H2-17 in the face of strongly rising US shale oil production and reviving OPEC production.
Brent crude front month price to average $52.5/b in Q4-17 toutching $50/b at times.
Higher than expected US shale oil rig additions since the start of the year has softening our projected deficit in 2019. However, we still see a substantial inventory draw below normal in 2019.
From the news flow:
Exxon will use 50% of its drilling budget for 2017 on US onshore drilling with its production there growing 20% pa to 2025
Libya’s crude oil production falls back again as clashes re-erupt
IEA: OPEC will increase its production capacity by 2 mb/d from 2016 to 2022 with Iraq lifting production to 5.4 mb/d in 2022
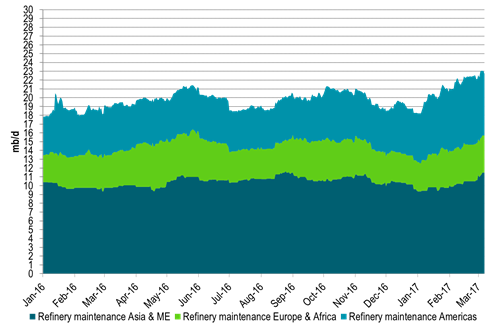
Ch1: Global refinery maintenance increased strongly in Q1-17 – Refineries soon to resume activity
A large increase in global refinery maintenance in Q1-17 left a comparble volume to be stored rather than processed
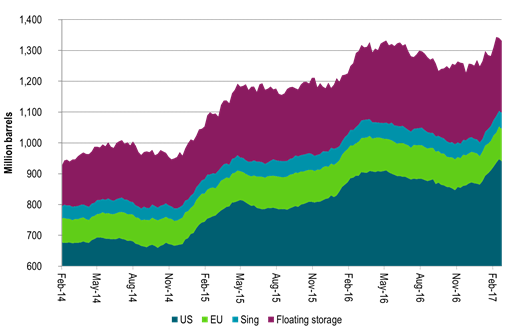
Ch2: Weekly inventories have rissen strongly in Q1-17 – Soon to decline.
OPEC also produced at record high level in Nov and Dec which has hit the market in Q1-17 along with several months of natural lag in the supply chain between production and consumption. Both helping to drive weekly inventory data up strongly in Q1-17
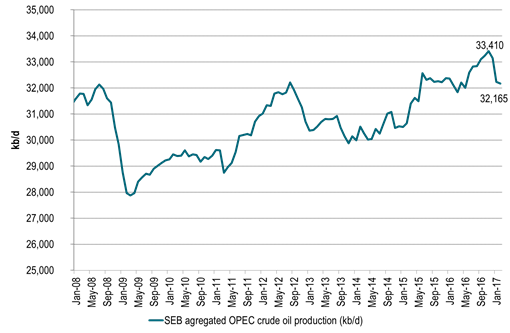
Ch3: OPEC delivers on cuts.
OPEC is delivering on its promises to cut. So when refineries move back on-line after maintenance and we also have the Nov and Dec OPEC production blob cleared out the the market we will see inventories starting to decline in Q2-17.
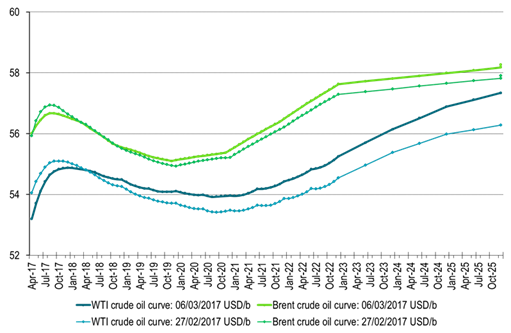
Ch4: Crude oil forward curve soon to move fully into backwardation
The forward crude curves will then move fully into backwardation with also the very front end of the curve (which is still in contango) moving into backwardation.
This is likely to lead front end Brent crude oil price up towards the $60/b mark with our expectation for an average Brent 1mth price of $57.5/b during Q2-17 touching $60/b at times.
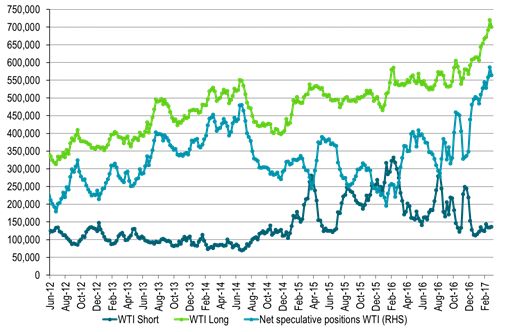
Ch5: Speculators are bullish awaiting that last move into full backwardation
And speculators are bullish accordingly – close to record high net long speculative position in WTI
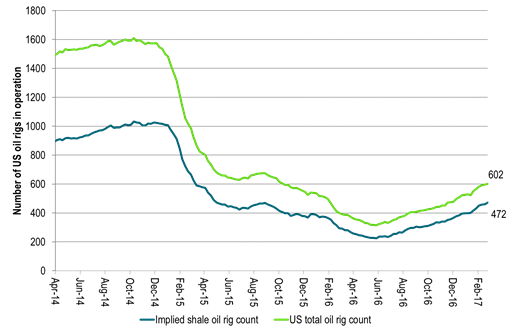
Ch6: US oil rig count moves higher and higher and higher
But US oil rigs are constantly added to the market and at a higher rate than we had expected.
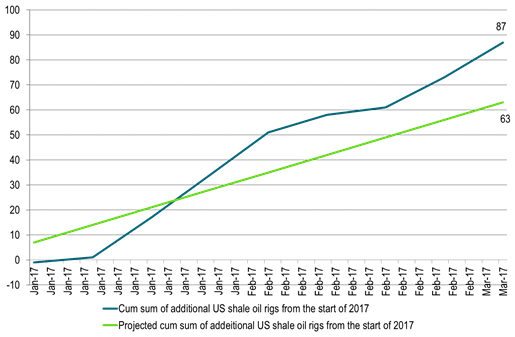
Ch7: More US shale oil rigs have been activated versus what we had expected
More shale oil rigs have been added into activity in the US shale oil space versus what we had expected
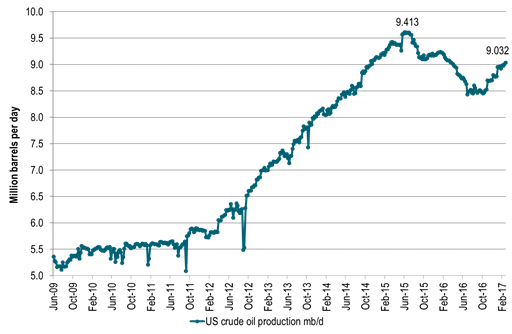
Ch8: Helping to shift US crude oil production growth back into full pre-2015 growth level again
US crude oil production is now on rising trend again adding on average 30 kb/d w/w since the start of the year.
That is equal to a marginal, annualized growth rate of 30 kb/d/week * 52 week = 1560 kb/d/year (1.5 mb/d marginal, annualized growth rate).
That is back to the growth rate seen between 2012 to June 2015.
Ch9: More shale oil rigs than expected means higher forecasted US crude oil production than expected
This impacts our projected US crude oil production for 2017, 2018 and 2019 lifting it higher
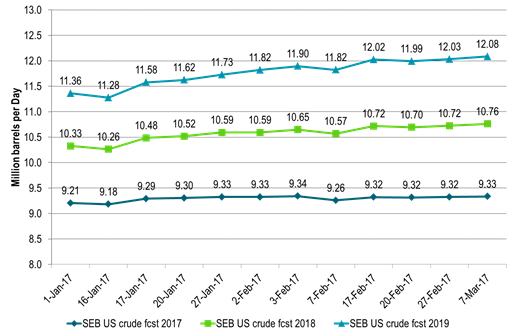
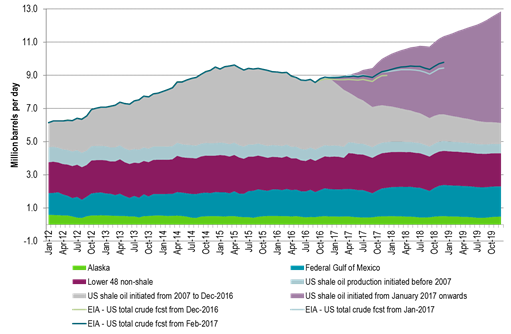
Ch10: With US crude oil production now expected to lift to close to 13 mb/d at the end of 2019
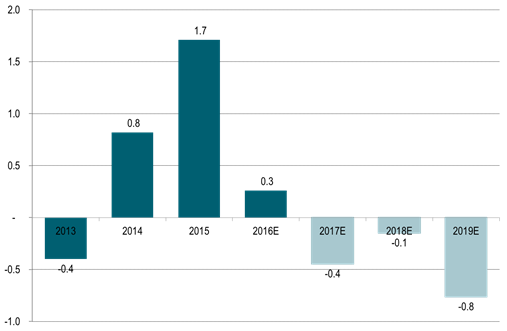
Ch11: Global supply/demand balance still in deficit next three years but not much deficit in 2018 any more
Almost constantly weakening and softening our projected supply/demand balance for the nearest three years.
With our view now that there will be almost no deficit in 2018.
But still a solid deficit and inventory draw coming in 2019 as cuts in investments in conventional supply since 2014 starts to hit the market.
Little conventional legacy investments to add additional supply in 2019 and thus little to counter natural declines in existing conventional production in 2019.
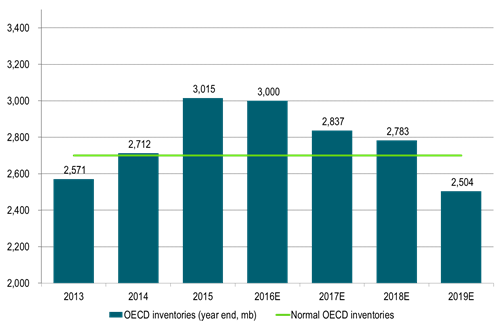
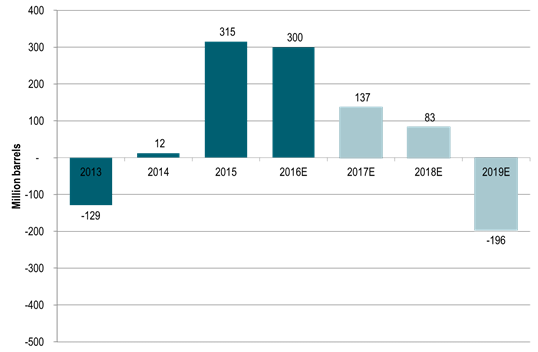
Ch12: End of year OECD inventories to draw substantially below normal in 2019
End of year OECD stocks still to draw substantially below a normal of 2700 million barrels in 2019.
But stocks are likely to end the year above normal for both 2017 and 2018.
Thus few pressure points in the global supply/demand balance during 2017 and 2018 as current elevated oil inventories provides a nice cushion
Ch13: End of year OECD inventories to stand some 200 mb below normal in December 2019
The year 2019 still looks like the year when things could happen to the oil price on the upside.
As end of year OECD inventories could draw down some 200 million barrels below normal
Unless of course demand growth weakens, US shale oil production accelerates even more or oil companies accelerate in-field drilling thus countering conventional declines.
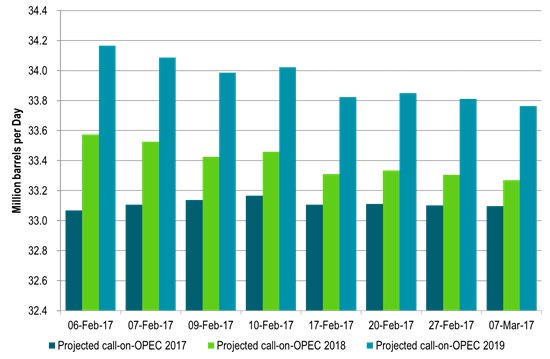
Ch14: Projected call on OPEC has declined since the start of February along with higher US crude oil production projections
As we steadily adjust our US crude oil production higher for 2017, 2018 and 2019 along with higher than expected additions of US shale oil rigs
The need for oil from OPEC declines comparably for the years to come
How far down is OPEC willing to let it slide? Probably not below 33 mb/d for 2018.
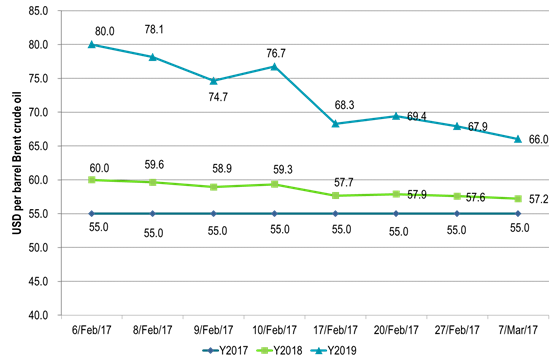
Ch15: Softer supply/demand balance naturally means softer prices
In a dynamic crude oil price forecasting frame the forecasted crude oil price declines along with with a softening forward looking supply/demand balance
(Prices in graph are mathematically extended from the $80/b forecasted at the start of February and are not new price forecast assessments)
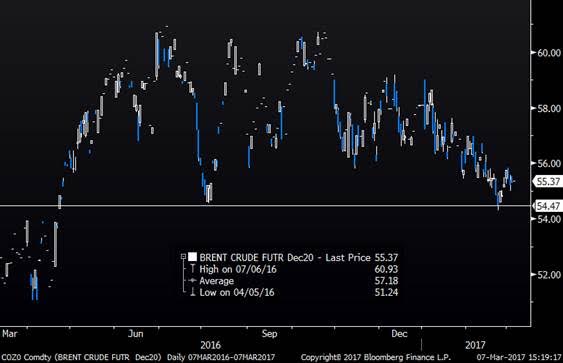
Ch16: Longer dated market prices have deteriorated since the start of the year
Longer dated contracts like Brent crude December 2020 have deteriorated since the start of the year
Probably reflecting the acceleration in US shale oil rig additions in Q1-17
In late February the contract traded at its lowest level since April 2016.
Kind regards
Bjarne Schieldrop
Chief analyst, Commodities
SEB Markets
Merchant Banking