

Analys
Silver outlook 2019 – not as good as gold
 Alongside gold, silver has staged a rally late in 2018, gaining just over 10% in the month of December 2018. Silver’s close correlation with gold (around 80%) helps explain the sharp movement. As we discussed in Gold Outlook 2019, volatility in cyclical asset markets helped defensive assets like gold as investors sought refuge in a safe haven asset. We expect silver to rise to US$16.6/oz by Q3 2019, before easing to US$16.3/oz at the end of the year from US$15.7/oz at the time of writing (07/01/2019). Silver’s gain is likely to be less impressive than gold because manufacturing activity is slowing, and mining activity is likely to start increasing the supply of silver.
Figure 1: Silver price forecast
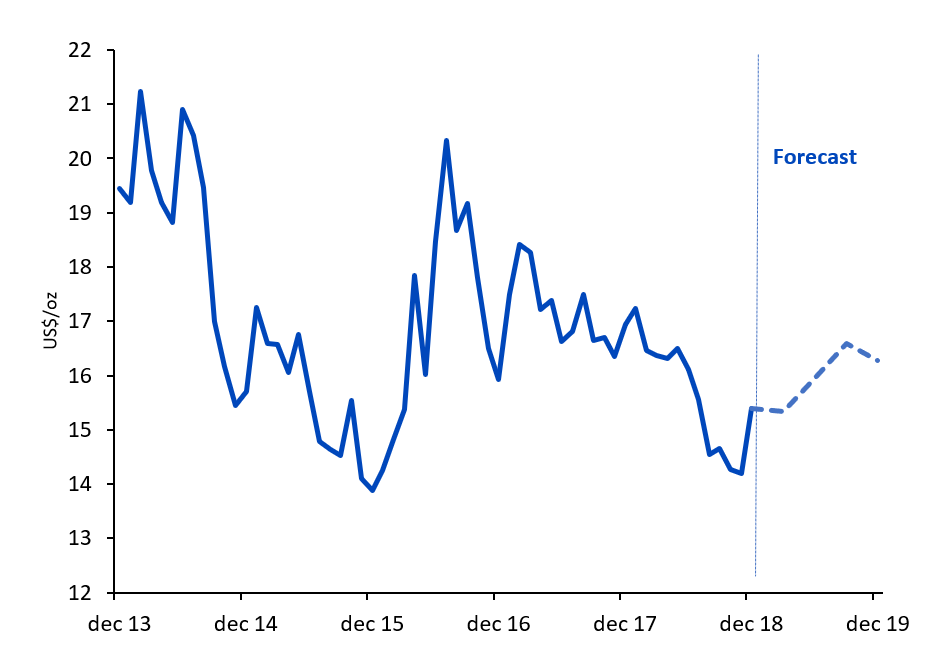
Source: WisdomTree, Bloomberg Historical Data, data available as of close 31 December 2018. Forecasts are not an indicator of future performance and any investments are subject to risks and uncertainties.
Approach
To formulate our forecasts, we utilise the framework outlined in Silver outlook: Searching for a silver lining. In contrast to gold, silver has many traits of an industrial metal, with more than 50% of its use in industrial applications. Supply and demand for physical silver matter more for silver, whereas gold prices tend to be driven more by monetary factors such as Treasury yields, exchange rates and inflation.
Demand for silver could be weighed by decelerating manufacturing growth
Global manufacturing Purchasing Managers Indices (PMIs) peaked in early 2018. We expect PMIs to continue to decline in 2019, although avoid falling below the 50 demarcation between expansion and contraction. However, deceleration in manufacturing activity is likely to slow demand for silver.
Figure 2: Global manufacturing PMIs
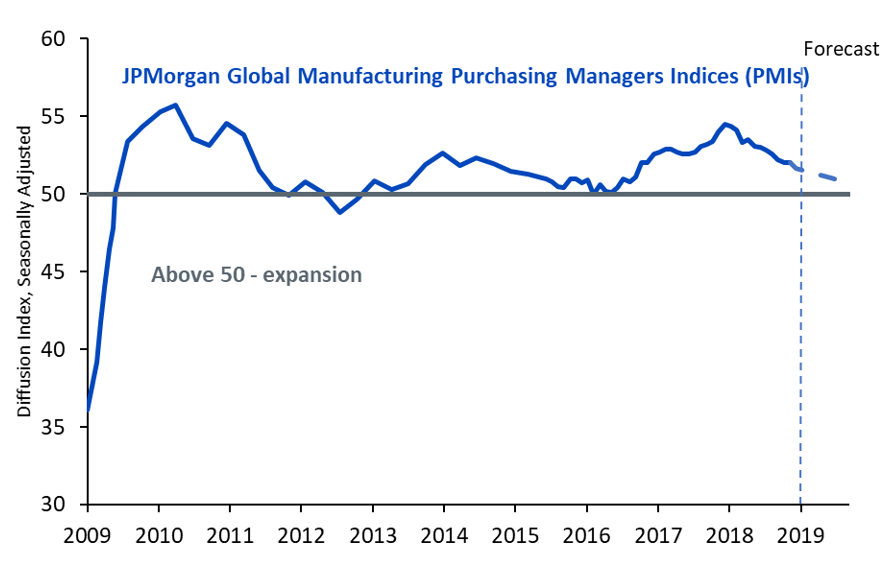
Source: Bloomberg, WisdomTree, data available as of close 31 December 2018. Forecasts are not an indicator of future performance and any investments are subject to risks and uncertainties.
Mining activity could rise as capital investment has been recovering
With mining capital expenditure (capex) having recovered in 2018 after a prolonged period of restraint, we could start to see supply of silver increase as more metal comes out of the ground. Most silver comes as a by-product of mining for other metals. So, the fact that silver looked cheap relative to gold for the last few years, did not mean that miners would restrain from mining the metal.
Figure 3: Top 100 miners capital expenditure growth
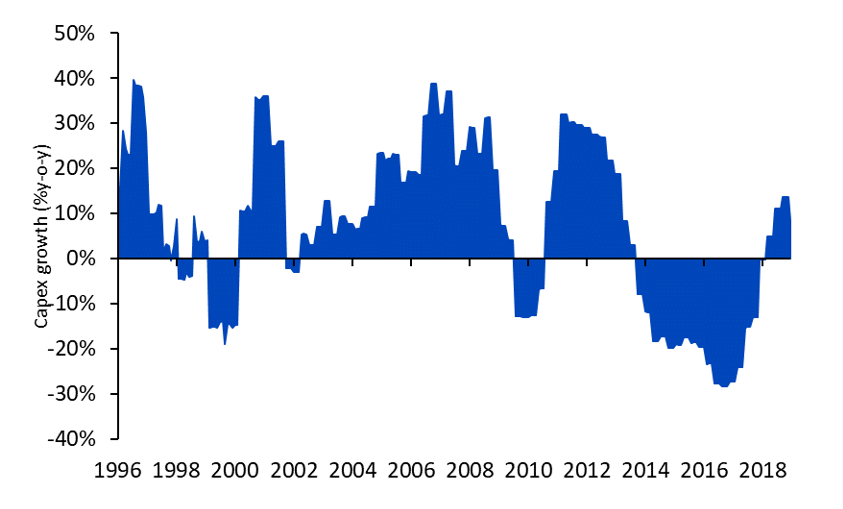
Source: Bloomberg, WisdomTree, data available as of close 03 January 2019. Historical performance is not an indication of future performance and any investments may go down in value.
Silver in a supply surplus
The latest revision of data from the Silver Institute places silver in a supply surplus in both 2017 and 2018. In World Silver Survey 2018, published in H1 2018, the Silver Institute indicated that the silver market was in a deficit in 2017. The facts that they revised the deficit into a surplus and increased the surplus in 2018, indicates an overhang for the metal.
Figure 4: Physical silver supply-demand balance
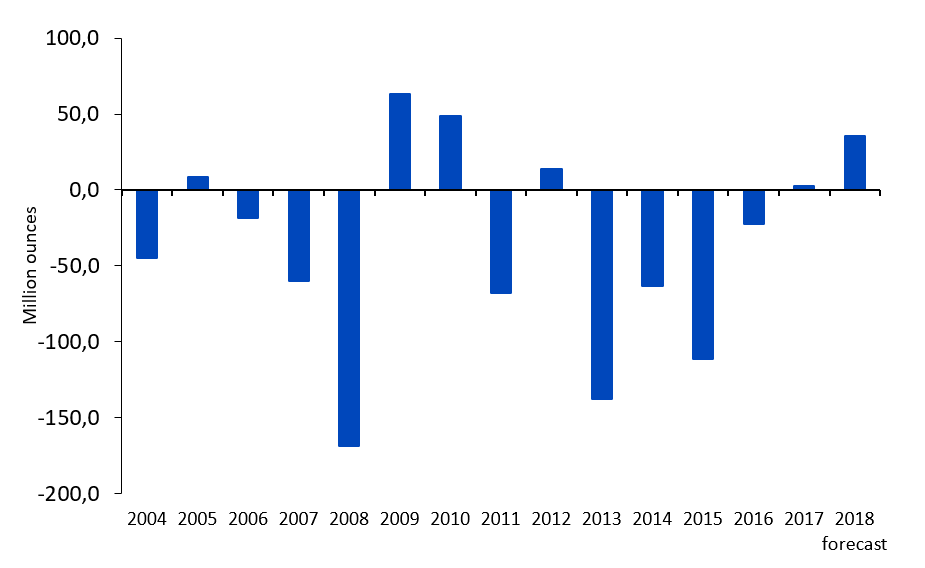
Source: GFMS Thomson Reuters, Silver Institute, WisdomTree, data available as of close 31 December 2018. Forecasts are not an indicator of future performance and any investments are subject to risks and uncertainties.
Rising exchange inventory also indicates strong metal availability
Although most of the gains in silver inventory are in the form of eligible (i.e. meets exchange’s requirements but has not been pledged as collateral against a futures market transaction) as opposed to registered (i.e. meets requirements and has been pledged as collateral for futures market transactions), both have been rising. The trends indicate that there is ample metal availability.
Figure 5: COMEX silver inventory
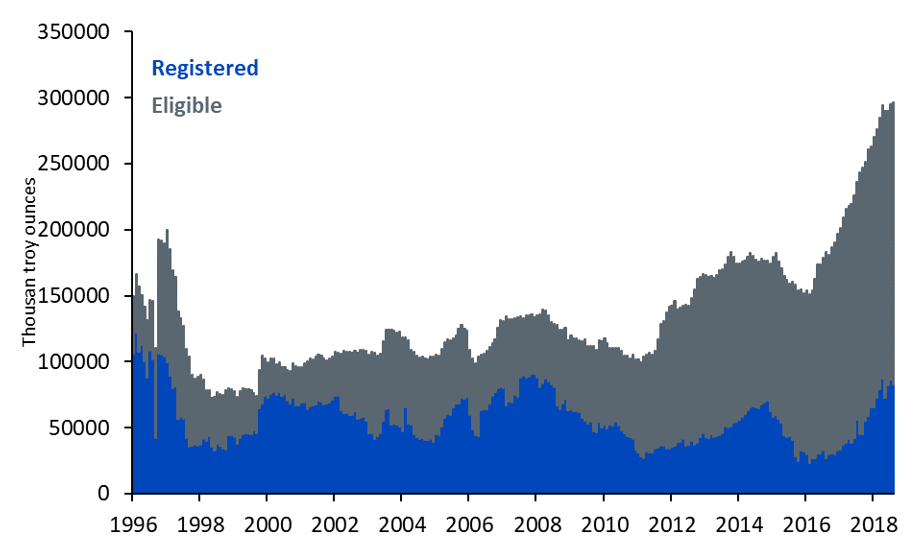
Source: Bloomberg, WisdomTree, data available as of close 31 December 2018. Historical performance is not an indication of future performance and any investments may go down in value.
Relatively cheap, possibly for a reason
The gold-to-silver ratio points to silver being cheap relative to gold, with the ratio over 1 standard deviation above its historic norm. However, with recent gains in silver, that gap is moderating. We believe that gold is likely to outshine silver as a pure defensive asset that does not have the same exposure to the industrial cycle.
Figure 6: Gold to silver ratio
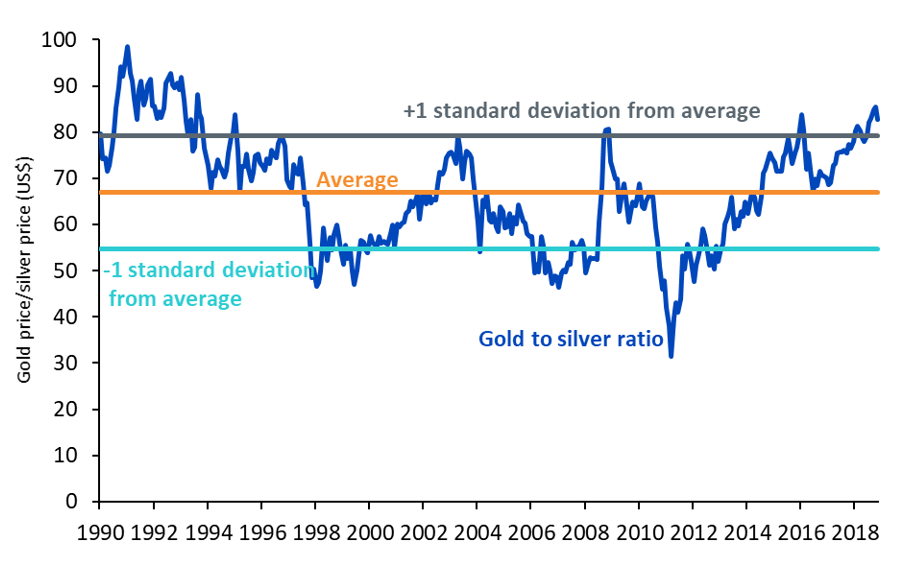
Source: Bloomberg, WisdomTree, data available as of close 31 December 2018. Historical performance is not an indication of future performance and any investments may go down in value.


Market is starting to take US/Iran headlines with a pinch of salt. Brent crude rose $2.8/b yesterday to an official close of $112.1/b. But after that it traded as low as $108.05/b before ending late night at around $109.7/b. Through the day it traded in a range of $106.87 – 112.72/b amid a flurry of news or rumors from Iran and the US. ”US temporary sanctions during negotiations” (falls alarm). ”We will bomb Iran” (not anyhow),… etc. While the market is still fluctuating to this kind of news flow, it is starting to take such headlines with a pinch of salt.

We’ll see. Maybe, maybe not. The Brent M1 contract is trading at $110.2/b this morning which very close to the average ticks through yesterday of $110.4/b.
Trump with bearish, verbal intervention whenever Brent trades above $110/b it seems. What seems to be a pattern is that Trump states something like ”very good negotiations going on with Iran”, ”New leaders in Iran are great,..”, ”Great progress in negotiations,…”, ”Deal in sight,..” etc whenever the Brent M1 contract trades above $110/b. An effort to cool the market. These hot air verbal interventions from Trump used to have a heavy bearish impact on prices, but they now seems to have less and less effect unless they are backed by reality.
As far as we can see there has been no real progress in the negotiations between the US and Iran with both sides still standing by their previous demands.
Iran is getting stronger while the cease fire lasts making a return to war for Trump yet harder. Iran is naturally in constant preparation for a return to war given Trump’s steady threats of bombing Iran again. Iran is naturally doing what ever is possible to prepare for a return to war. And every day the cease fire lasts it is better prepared. This naturally makes it more and more difficult and dangerous for the US to return to warring activity versus Iran as the consequences for energy infrastructure in the Persian Gulf will be more and more severe the longer the cease fire lasts. Israel seems to see it this way as well. That the war is not won and that current frozen state of a cease fire gives Iran opportunity to rebuild military and politically.
Global inventories are drawing down day by day. How much? In the meantime the Strait of Hormuz stays closed. There is varying measures and estimates of how much global inventories are drawing down. Our rough estimate, back of the envelope, is that global inventories are drawing down by at least some 10 mb/d or about 300 mb/d in a balance between loss of supply versus demand destruction. Other estimates we see are a monthly draw of 250-270 mb/d. The IEA only ’measured’ a draw in global observable stocks of 117 mb in April with oil on water rising 53 mb while on shore stocks fell 170 mb. But global stocks are hard to measure with large invisible, unmeasured stocks. As such a back of the envelope approach may be better.
Oil products is what the world is consuming. Oil product prices likely to rise while product stocks fall. Strategic Petroleum Reserves (SPR) are predominantly crude oil. Discharging oil from OECD SPR stocks, a sharp reduction in Chinese crude imports and a reduction in global refinery throughput of 6-7 mb/d has helped to keep crude oil markets satisfactorily supplied. But global inventories are drawing down none the less. And oil products is really what the world is consuming. So if global refinery throughput stays subdued, then demand will eventually have to match the supply of oil products. The likely path forward this summer is a steady draw down in jet fuel, diesel and gasoline. Higher prices for these. Then, if possible, higher refinery throughput and higher usage of crude in response to very profitable refinery margins. And lastly sharper draw in crude stocks and higher prices for these. But some 6 mb/d of oil products used to be exported through the Strait of Hormuz. And it may not be so easy to ramp up refinery activity across the world to compensate. Especially as Ukraine continues to damage Russian refineries as well as Russian crude production and export facilities.
Watch oil product stocks and prices as well as Brent calendar 2027. What to watch for this summer is thus oil product inventories falling and oil product premiums to crude rising. Another measure to watch is the Brent crude 2027 contract as it rises steadily day by day as the Strait of Hormuz stays closed and global oil inventories decline. The latter is close to the highest level since the start of the war and keeps rising.
The Brent M1 contract and the Brent 2027 prices and current price of jet fuel in Europe (ARA). All in USD/b

Our back of the envelope calculation of the global shortage created by the closure of the Strait of Hormuz. Note that 3.5 mb/d of discharge from SPR is also a draw. Note also that ’Forced demand loss’ of 2.5 mb/d is probably temporary and will fall back towards zero as logistics are sorted out leaving ’Price demand loss’ to do the job of balancing the market. Thus a shortfall of at least 9 mb/d created by the closure. More if SPR discharge is included and more if Forced demand loss recedes.

Brent is climbing higher. Front-month is at USD 106.3/bl this morning, close to a weekly high and a USD 9/bl jump from Mondays open. This is the move we flagged as a risk earlier in the week: the market shifting from ”a deal is around the corner” to ”this is going to take longer than we thought”.

Analyst Commodities, SEB
During April, rest-of-year Brent remained remarkably stable around USD 90/bl. A stability which rested on one single assumption: the SoH reopens around 1 May. That assumption is now slowly falling apart.
As we highlighted yesterday: every week of delay beyond 1 May adds (theoretically) ish USD 5/bl to the rest-of-year average, as global inventories draw 100 million barrels per week. i.e., a mid-May reopening implies rest-of-year Brent closer to USD 100/bl, and anything pushing into June or July takes us meaningfully higher.
What’s changed in the last 48 hours:
#1: The US military has formally warned that clearing suspected sea mines from SoH could take up to six months. That is a completely different timescale from what the financial market is pricing. Even a political deal tomorrow does not immediately reopen the strait.
#2: Trump has shifted his tone from urgency to ”strategic patience”. In yesterday’s press conference: ”Don’t rush me… I want a great deal.” The market is reading this as a president no longer feeling pressured by timelines, with the naval blockade running in the background.
#3: So far, the military activity is escalating, not de-escalating. Axios reports Iran is laying more mines in SoH. The US 3rd carrier strike group (USS George H.W. Bush) is arriving with two countermine vessels. Trump yesterday ordered the US Navy to destroy any Iranian boats caught laying mines. While CNN reports that the Pentagon is actively drawing up plans to strike Iranian SoH capabilities and individual Iranian military leaders if the ceasefire collapses. i.e., NOT a attitude consistent with an imminent deal!
Spot crude and product prices eased off the early-April highs on a combination of system rerouting and deal optimism. Both now weakening. Goldman estimates April Gulf output is reduced by 14.5 mbl/d, or 57% of pre-war supply, a number that keeps getting worse the longer this drags on.
Demand-side adaptation is ongoing: S. Korea has cut its Middle East crude dependence from 69% to 56% by pulling more from the Americas and Africa, and Japan is kicking off a second round of SPR releases from 1 May. But SPRs are finite.
Ref. to the negotiations, we should not bet on speed. The current Iranian leadership is dominated by genuine hardliners willing to absorb economic pain and run the clock to extract concessions. That is not a setup for a rapid resolution. US/Israeli media briefings keep framing the delay as ”internal Iranian divisions”, the reality is more complicated and points toward weeks and months, not days.
Our point is that the complexity is large, and higher prices have only just started (given a scenario where the negotiations drag out in time). The market spent April leaning on the USD 90/bl rest-of-year assumption; that case is diminishing by the hour. If ”early May reopening” is replaced by ”June, July or later” over the next week or two, both crude and products have meaningful room to reprice higher from here. There is a high risk being short energy and betting on any immediate political resolution(!).
Down on Friday. Up on Monday. The Brent June crude oil contract traded down 5.1% last week to a close of $90.38/b. It reached a high of $103.87/b last Monday and a low of $86.09/b on Friday as Iran announced that the Strait of Hormuz was fully open for transit. That quickly changed over the weekend as the US upheld its blockade of Iranian oil exports while Iran naturally responded by closing the SoH again. The US blew a hole in the engine room of the Iranian ship TOUSKA and took custody of the ship on Sunday. Brent crude is up 5.6% this morning to $95.4/b.
The cease-fire is expiring tomorrow. The US has said it will send a delegation for a second round of negotiations in Islamabad in Pakistan. But Iran has for now rejected a second round of talks as it views US demands as unrealistic and excessive while the US is also blocking the Strait of Hormuz.
While Brent is up 5% this morning, the financial market is still very optimistic that progress will be made. That talks will continue and that the SoH will fully open by the start of May which is consistent with a rest-of-year average Brent crude oil price of around $90/b with the market now trading that balance at around $88/b.
Financial optimism vs. physical deterioration. We have a divergence where the financial market is trading negotiations, improvements and resolution while at the same time the physical market is deteriorating day by day. Physical oil flows remain constrained by disrupted flows, longer voyage times and elevated freight and insurance costs.
Financial markets are betting that a US/Iranian resolution will save us in time from violent shortages down the road. But every day that the SoH remains closed is bringing us closer to a potentially very painful point of shortages and much higher prices.
The US blockade is also a weapon of leverage against its European and Asian allies. When Iran closed the SoH it held the world economy as a hostage against the US. The US blockade of the SoH is of course blocking Iranian oil exports. But it is also an action of disruption directed towards Europe and Asia. The US has called for the rest of the world to engaged in the war with Iran: ”If you want oil from the Persian Gulf, then go and get it”. A risk is that the US plays brinkmanship with the global oil market directed towards its European and Asian allies and maybe even towards China to force them to engage and take part. Maybe unthinkable. But unthinkable has become the norm with Trump in the White House.


Oil product price pain is set to rise as the Strait of Hormuz stays closed into summer

Solkraften pressar elpriserna dagtid

Michel Gubel ger sin syn på oljemarknaden

Svag vårflod dubblar elpriserna
Brent crude up USD 9/bl on the week… ”deal around the corner” narrative fades
Brent crude up USD 9/bl on the week… ”deal around the corner” narrative fades
Solkraften pressar elpriserna dagtid
Michel Gubel ger sin syn på oljemarknaden
Svag vårflod dubblar elpriserna
Oil product price pain is set to rise as the Strait of Hormuz stays closed into summer
-
 Nyheter3 veckor sedan
Solkraften pressar elpriserna dagtid
-
Analys4 veckor sedan
Brent crude up USD 9/bl on the week… ”deal around the corner” narrative fades
-
 Nyheter3 veckor sedan
Michel Gubel ger sin syn på oljemarknaden
-
Nyheter3 veckor sedan
Svag vårflod dubblar elpriserna
-
Analys2 dagar sedan
Oil product price pain is set to rise as the Strait of Hormuz stays closed into summer