Analys
Silver outlook 2019 – not as good as gold


Figure 1: Silver price forecast

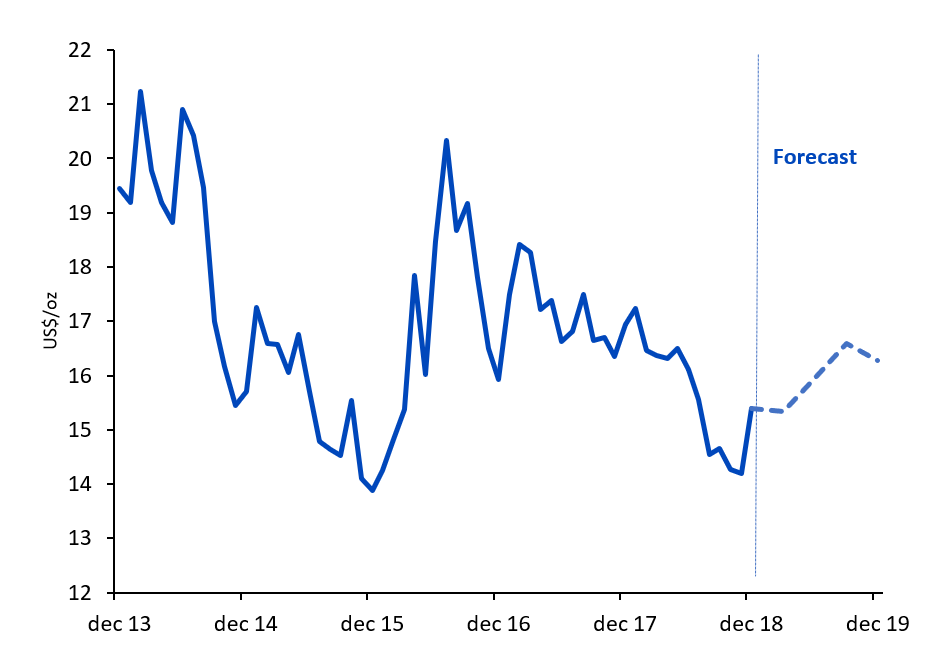
Source: WisdomTree, Bloomberg Historical Data, data available as of close 31 December 2018. Forecasts are not an indicator of future performance and any investments are subject to risks and uncertainties.
Approach
To formulate our forecasts, we utilise the framework outlined in Silver outlook: Searching for a silver lining. In contrast to gold, silver has many traits of an industrial metal, with more than 50% of its use in industrial applications. Supply and demand for physical silver matter more for silver, whereas gold prices tend to be driven more by monetary factors such as Treasury yields, exchange rates and inflation.
Demand for silver could be weighed by decelerating manufacturing growth
Global manufacturing Purchasing Managers Indices (PMIs) peaked in early 2018. We expect PMIs to continue to decline in 2019, although avoid falling below the 50 demarcation between expansion and contraction. However, deceleration in manufacturing activity is likely to slow demand for silver.
Figure 2: Global manufacturing PMIs

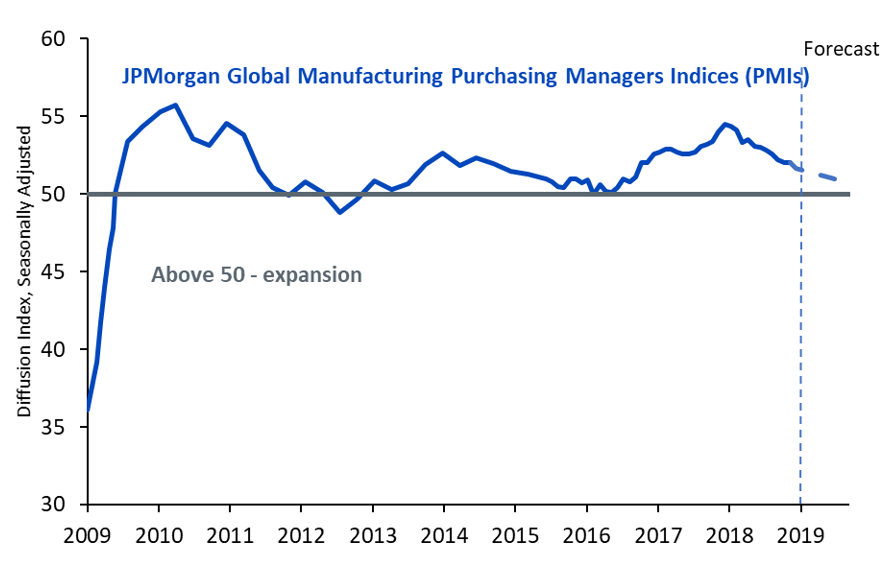
Source: Bloomberg, WisdomTree, data available as of close 31 December 2018. Forecasts are not an indicator of future performance and any investments are subject to risks and uncertainties.
Mining activity could rise as capital investment has been recovering
With mining capital expenditure (capex) having recovered in 2018 after a prolonged period of restraint, we could start to see supply of silver increase as more metal comes out of the ground. Most silver comes as a by-product of mining for other metals. So, the fact that silver looked cheap relative to gold for the last few years, did not mean that miners would restrain from mining the metal.
Figure 3: Top 100 miners capital expenditure growth

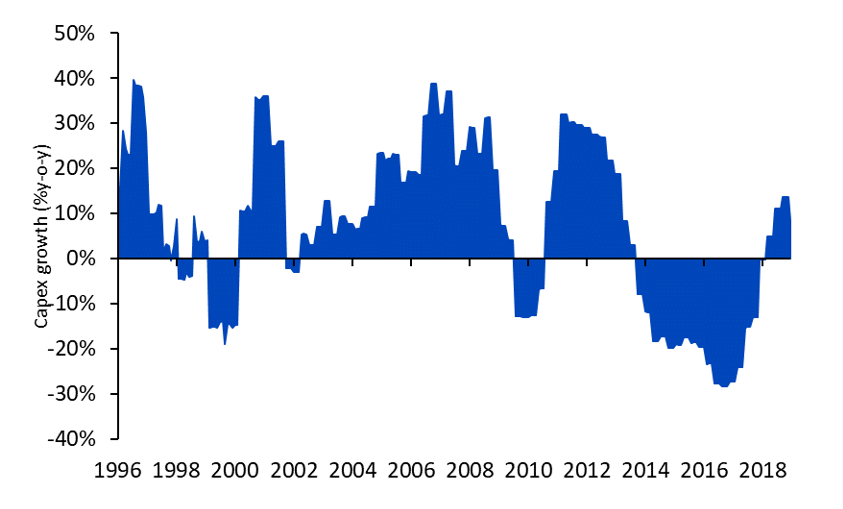
Source: Bloomberg, WisdomTree, data available as of close 03 January 2019. Historical performance is not an indication of future performance and any investments may go down in value.
Silver in a supply surplus
The latest revision of data from the Silver Institute places silver in a supply surplus in both 2017 and 2018. In World Silver Survey 2018, published in H1 2018, the Silver Institute indicated that the silver market was in a deficit in 2017. The facts that they revised the deficit into a surplus and increased the surplus in 2018, indicates an overhang for the metal.
Figure 4: Physical silver supply-demand balance

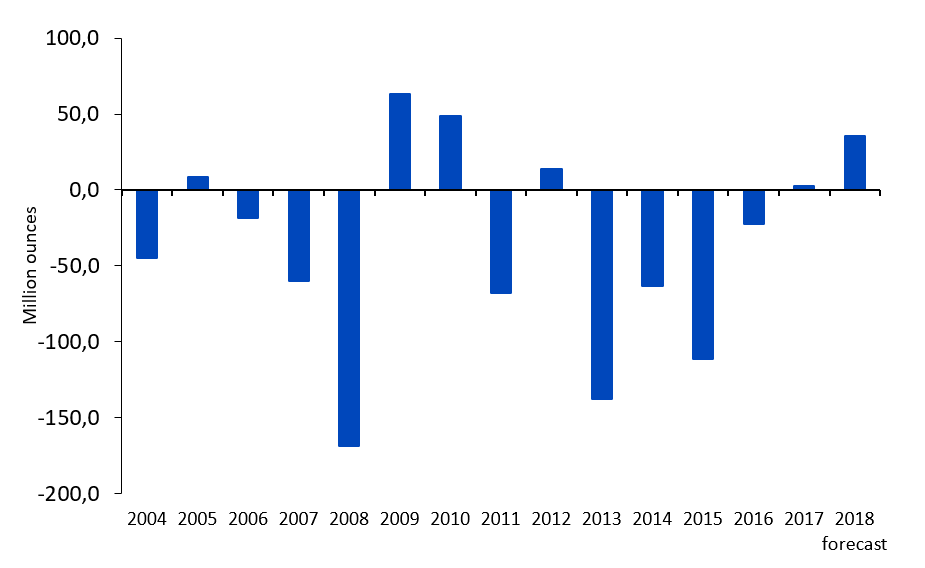
Source: GFMS Thomson Reuters, Silver Institute, WisdomTree, data available as of close 31 December 2018. Forecasts are not an indicator of future performance and any investments are subject to risks and uncertainties.
Rising exchange inventory also indicates strong metal availability
Although most of the gains in silver inventory are in the form of eligible (i.e. meets exchange’s requirements but has not been pledged as collateral against a futures market transaction) as opposed to registered (i.e. meets requirements and has been pledged as collateral for futures market transactions), both have been rising. The trends indicate that there is ample metal availability.
Figure 5: COMEX silver inventory

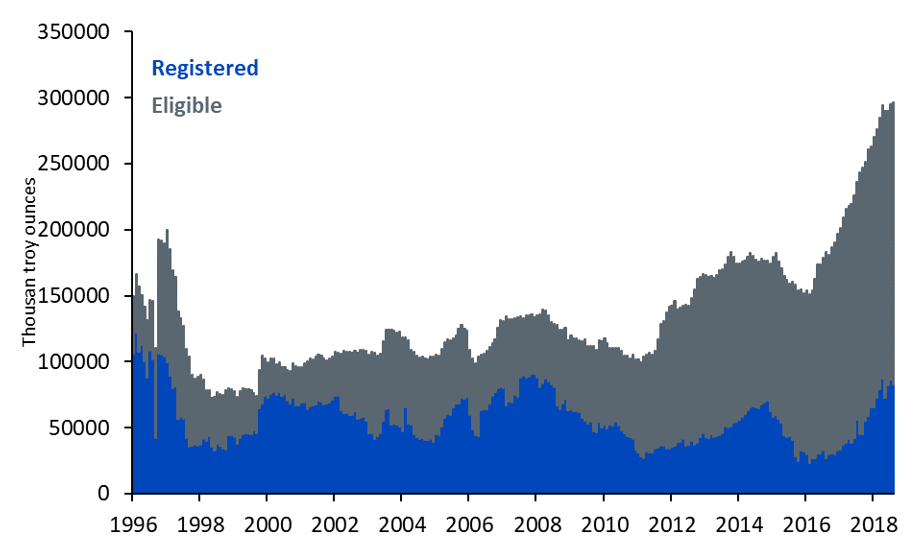
Source: Bloomberg, WisdomTree, data available as of close 31 December 2018. Historical performance is not an indication of future performance and any investments may go down in value.
Relatively cheap, possibly for a reason
The gold-to-silver ratio points to silver being cheap relative to gold, with the ratio over 1 standard deviation above its historic norm. However, with recent gains in silver, that gap is moderating. We believe that gold is likely to outshine silver as a pure defensive asset that does not have the same exposure to the industrial cycle.
Figure 6: Gold to silver ratio

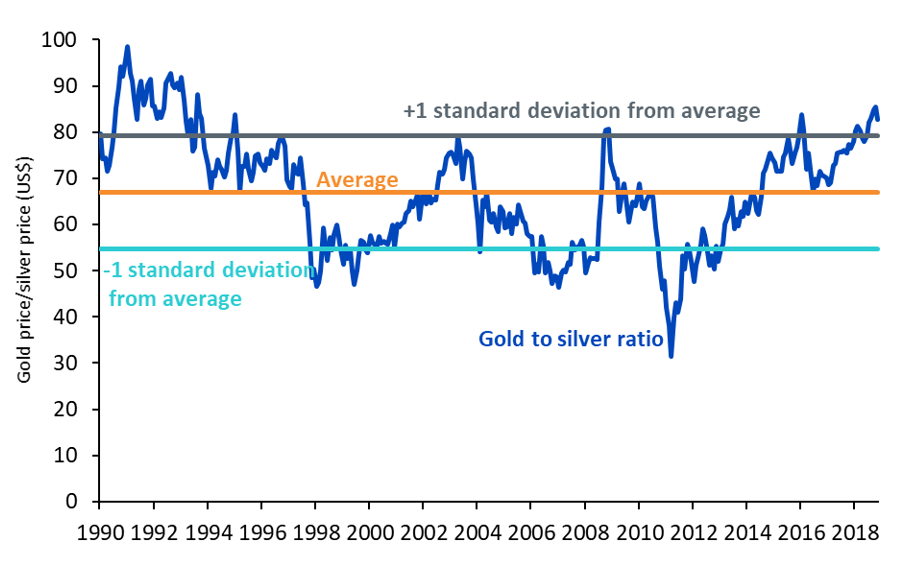
Source: Bloomberg, WisdomTree, data available as of close 31 December 2018. Historical performance is not an indication of future performance and any investments may go down in value.