

Analys
SEB – Råvarukommentarer, 30 september 2013

Rekommendationer
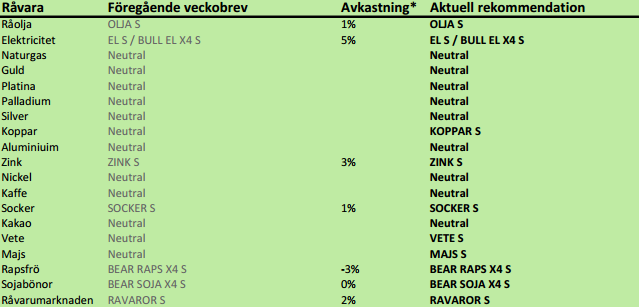
*) Avkastningen anges för 1:1 certifikaten där både BULL och 1:1 certifikat är angivna.
Inledning
Elpriset har fortsatt att stiga och BULL EL X4 S belönade dem som köpt med 17% ytterligare avkastning. Den har stigit med 35% den senaste månaden. Ett högre elpris är fortsatt vår främsta rekommendation. Rekyler ska betraktas som köptillfällen.
Vi anser att vi har tidiga tecken på en vändning uppåt i pristrenden för vete och majs. Därför byter vi rekommendation från neutral till köp på dessa. För oljeväxter har vi fortfarande säljrekommendation. Den tekniska analysen av sojamarknaden indikerar ett nytt stort prisfall från fredagens 1319 till 1250 cent per bushel.
Den sista september är det dags att ta emot lagerstatistiken från USDA: hur stora lagren av spannmål och oljeväxter som fanns i USA den 1 september.
Estimaten hos marknaden är som följer:
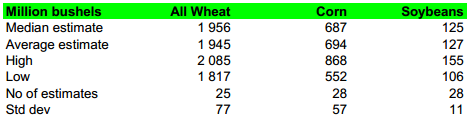
Statistiken publiceras klockan 18:00 svensk tid.
Vi går också över till köprekommendation på koppar och certfikatet KOPPAR S.
Det är den så kallade Golden Week i Kina den här veckan, vilket innebär att affärslivet går på sparlåga där hela veckan
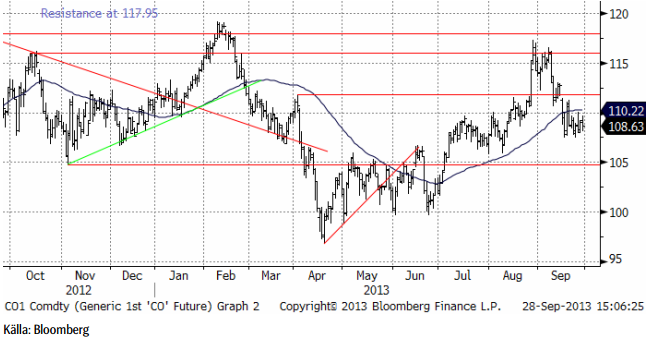
Råolja – Brent
Oljepriset backade med 1% förra veckan. Vi tror det finns risk för ytterligare svaghet i prisutvecklingen.
Terminskurvan för Brent ligger något lägre än förra veckan. Det som annars är så påfallande är rabatten på terminerna i förhållande till spotpriset.
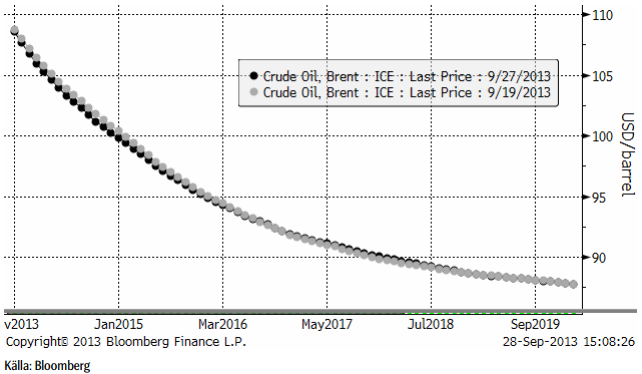
När nu priset fallit tillbaka och rabatten på terminer är så attraktiv, tycker vi att det är ett bra tillfälle att komma in i den lönsamma oljemarknaden och rekommenderar köp av OLJA S. Det är framförallt rabatten på terminerna vi vill komma åt och därför föredrar vi OLJA S framför t ex BULL OLJA X4 S.
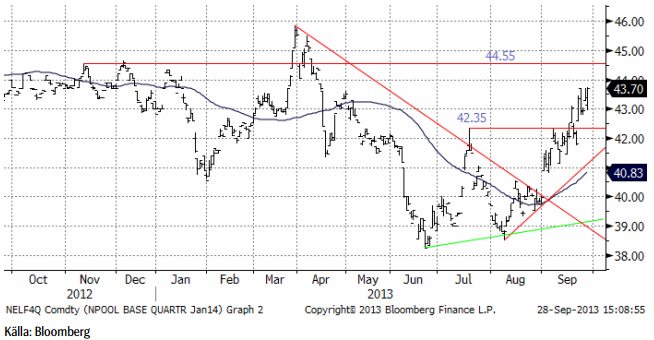
Elektricitet
Elpriset har fortsatt upp, vilket har fört med sig att vår rekommendation av EL S gett 5% den senaste veckan och BULL EL X4 S har gett 17% i avkastning. Vi ser att vi närmar oss ett tekniskt motstånd på 44.55 euro per MWh. Trots vad vi skriver nedan, tror vi det kan finnas anledning att tro att det kan komma en rekyl nedåt. Detta är ett utmärkt tillfälle att komma in i marknaden på. Den här haussen drivs av långsiktiga förändringar i marknaden för kol och energi, som varit fallande i tre år och nu vänt upp igen.
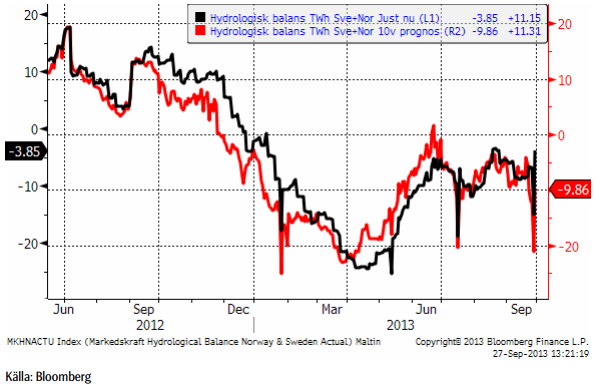
Markedskraft har under hela uppgången haft en säljrekommendation till sina kunder. Och man kan inte heller se någon anledning för dem att tro på en prisuppgång när man ser på deras prognos för hydrologisk balans, som vi ser nedan.
Vi har, som bekant fokuserat på det nedtryckta priset på kol och på att en normalisering av den marknaden har inletts. Ser vi däremot till väderleksprognoser har de inte gett mycket att hålla i. SMHI:s modeller har fladdrat fram och tillbaka mellan blött och torrt den senaste tiden. Den senaste prognosen från i fredags visar på blötare väder. Samtidigt skriver de att det troligaste är ”nog” att det fortsätter som förut. Vi väljer att inte tro på modellerna, utan på vad meteorologerna skriver, alltså håller vi fast vid något torrare väder.
Vad som stödjer detta är beteendet hos den Nordatlantiska Oscillationen / North Atlantic Oscillation (NAO) som har har gått in (djupt) i negativ fas.
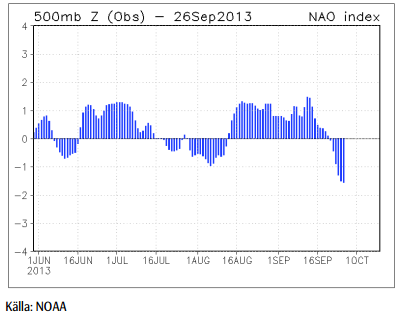
NAO i negativ fas innebär att kall ishavsluft tränger söderut och trycker undan de normala vädervindarna, som normalt bär med sig blöt luft från sydvästra Europa, dvs britiska öarna. När NAO är i negativ fas, tvingas denna ström gå söderöver, dvs över Frankrike. En molnfri, knaster-kall vinterdag, där röken från skorstenarna går rakt upp i torr och vindstilla luft, är det typiska vädret vid NAO i negativ fas. Det är en dag när förbrukningen av el är hög och vindkraften står still och ingen nederbörd fyller på den hydrologiska balansen. Det brukar hänga ihop med höga elpriser.
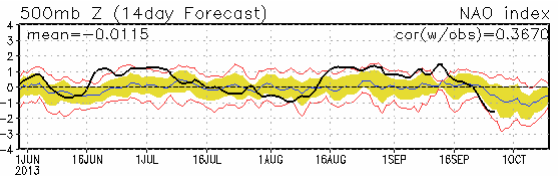
Det är svårt att göra prognoser på NAO långt in i framtiden, mycket svårare än för ENSO. Men det görs ändå och nedanför ser vi NOAA:s 14-dagars prognos. Den visar att att NAO troligtvis kommer att ligga kvar i negativ fas.
Kolmarknaden i Europa har hamnat i backwardation för korta löptider. Handlare berättar att sentimentet i marknaden har svängt. För en månad sedan var det ingen som oroade sig för att kunna få tag på kol. När man sedan började vilja köpa på sig mer för vintern, märkte man att det var svårt att få tag på varan på marknaden. Nyhetsbyrån Montel rapporterade i måndags för en vecka sedan om att det blivit allt svårare att få tag på kol från Ryssland. Lagernivåerna vid gruvorna är höga, men transportkapaciteten, via tåg, har blivit en flaskhals, samtidigt som mer går på export till Fjärran Östern.
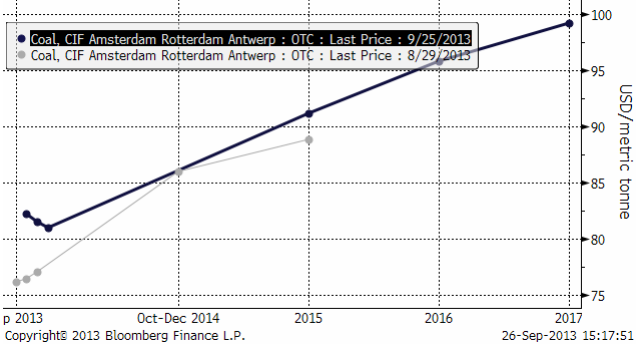
Backwardation är normalt sett ett “bullish” tecken och orsakas oftast av en ökning i efterfrågan, även om förklaringarna som vi sett ovan, bestått av både ökad efterfrågan och hänvisningar till flaskhalsar i transporterna.
Vi rekommenderar köp av el, t ex EL S eller BULL EL X4 S.
Naturgas
Naturgaspriset som förra veckan var uppe på 4 dollar, föll ner mot 3.60, men rekylerade genast upp mot 3.80.
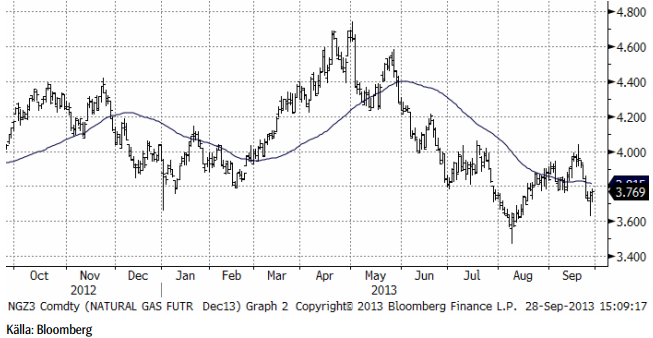
Vi har neutral rekommendation.
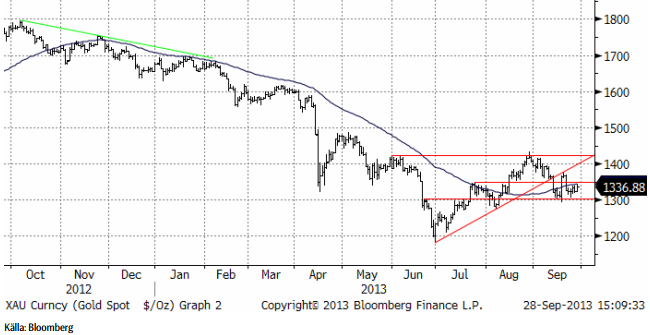
Guld & Silver
Guldpriset, som bröt uppgångsfasen i början på september, ligger nu mellan ett stöd på 1300 och ett motstånd på 1340 – 1350. Det mesta talar trots allt för att det blir en ny nedgångsfas mot 1200 dollar, men det är inte säkert.
Nedan ser vi kursdiagrammet för silver i dollar per troy ounce. Priset ligger precis under en motståndsnivå, men det ser inte ut som en stark startpunkt för veckans handel.
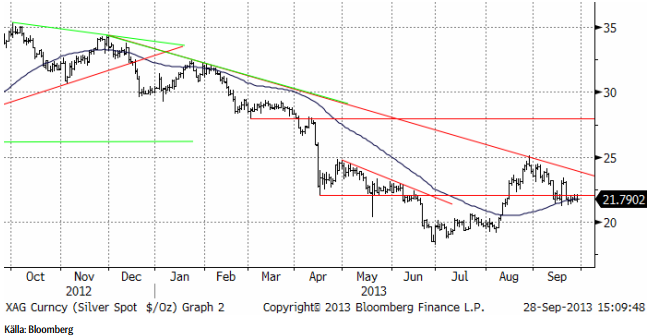
Vi fortsätter att vara neutrala guld och silver och skulle inte vilja köpa någon av dem idag.
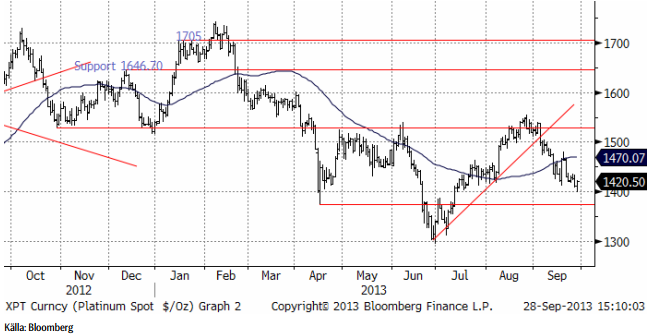
Platina & Palladium
Platinapriset har fallit ner till ett stöd på 1400 dollar. Där studsade priset upp under fredagens handel. Den kortsiktiga trenden är nedåtriktad, men det är möjligt att det finns tillräckligt med stöd på 1400 för att få till stånd en rekyl uppåt.
Nedan ser vi frontmånadskontraktet på palladium. Palladium ligger fortfarande i en slags sidledes rörelse, utan trend.
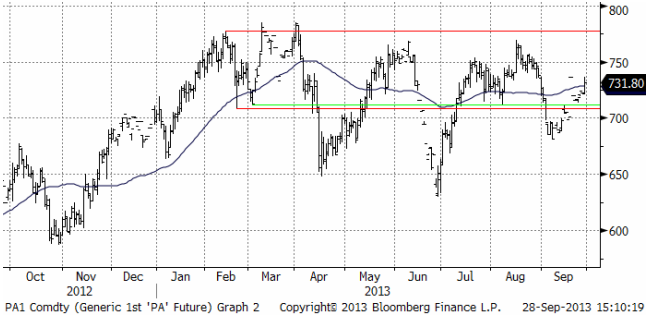
Vi är för närvarande neutrala platina och palladium, men om palladium skulle falla bara något lite ytterligare, skulle vi vilja haka på och ta en kort position via BEAR PALLAD X4 S. Vi skulle absolut inte vilja köpa någon av dem.
Koppar
Det är vid den här tiden på året som Codelco bestämmer sig för premien för katoder. Den premie som Codelco bestämmer anses vara industrins benchmark och sprider sig genom värdekedjan. Codelco producerar 10% av världens koppar. Förhandlingarna avslutas precis före den traditionella LME-veckan som börjar måndagen den 7 oktober. Europas största kopparsmältverk Aurubis annonserade i fredags att deras premium för 2014 blir 105 dollar per ton. Det är 22% högre än årets nivå. Detta tyder på att Codelco också kommer att lägga sig högre. Högre premier för fysisk metall präglar alla metaller, vilket har LME:s kapacitetsproblem vid sina lagerhus som gemensam nämnare. Det kan också i och för sig vara ett tecken på högre efterfrågan generellt.
Lagren vid LME fortsatte att minska i veckan som gick och vi tror att kopparpriset kommer att testa motstånden från i somras.
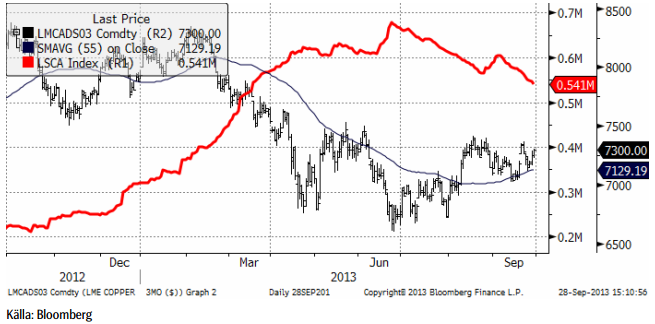
Vi går därmed över till köprekommendation på koppar och rekommenderar köp av KOPPAR S.
Aluminium
Tekniskt beter sig aluminiummarknaden som om den stod inför en uppgång mot 1900 – 1950 i det korta perspektivet. Veckan bjöd på en lagerminskning. Handlare har generellt sett en negativ vy på aluminiummarknaden och det är en god grogrund för en uppgång. Marknaden behöver dock produktionsminskningar och det är en fråga om när dessa sker; som vi skrev förra veckan tror vi att det tar längre tid än marknaden hoppas. Den fysiska premien fortsatte att falla i veckan som gick.
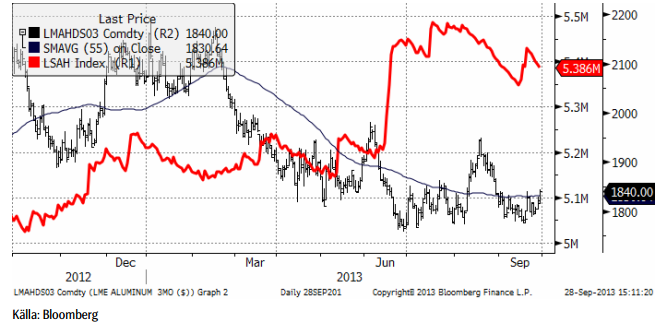
Vi har neutra rekommendation, men lutar mot en köprekommendation.
Zink
Som vi har påpekat tidigare är zinkmarknaden gott och väl i en överskottssituation, arbetar sig branschen åt rätt håll. Rekyler nedåt är köptillfällen. Förra veckan bjöd på +2.3%. Till viss del beror veckans lite större plus på den enligt vår mening omotiverade baissiga stängningen på fredagen för en vecka sedan.
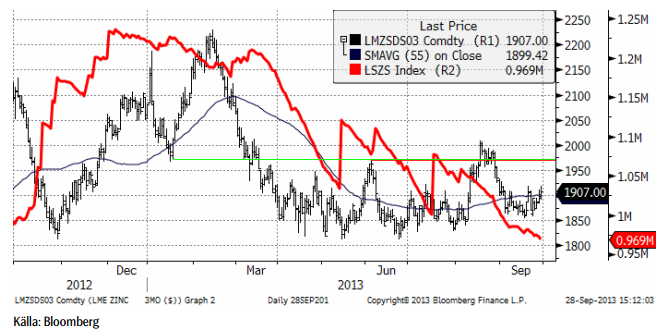
Vi fortsätter med en försiktig köprekommendation, av ZINK S.
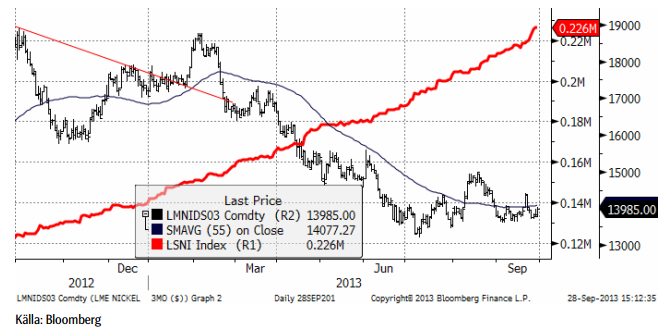
Nickel
Nickelpriset stängde mer eller mindre på oförändrat pris på veckan. Det har varit tyst på nyhetsfronten och priset har följt de andra metallernas rörelser.
Kaffe
Kaffepriset noterade nya, fräscha, bottennoteringar i veckan som gick. Trenden är nedåtriktad. Vi väntar på en uppgång, men fortsätter att vänta.
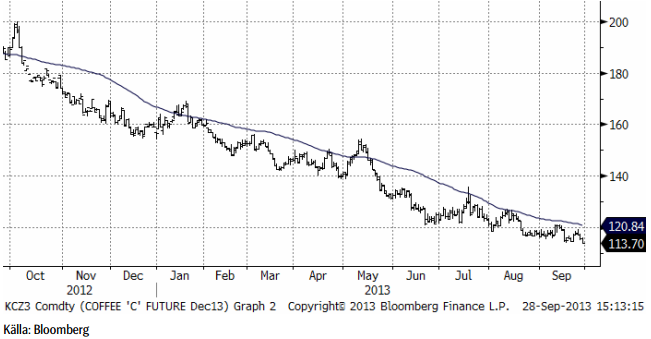
Vi behåller tills vidare neutral rekommendation, tills vi ser tecken på ett trendbrott.
[box]SEB Veckobrev Veckans råvarukommentar är producerat av SEB Merchant Banking och publiceras i samarbete och med tillstånd på Råvarumarknaden.se[/box]
Disclaimer
The information in this document has been compiled by SEB Merchant Banking, a division within Skandinaviska Enskilda Banken AB (publ) (“SEB”).
Opinions contained in this report represent the bank’s present opinion only and are subject to change without notice. All information contained in this report has been compiled in good faith from sources believed to be reliable. However, no representation or warranty, expressed or implied, is made with respect to the completeness or accuracy of its contents and the information is not to be relied upon as authoritative. Anyone considering taking actions based upon the content of this document is urged to base his or her investment decisions upon such investigations as he or she deems necessary. This document is being provided as information only, and no specific actions are being solicited as a result of it; to the extent permitted by law, no liability whatsoever is accepted for any direct or consequential loss arising from use of this document or its contents.
About SEB
SEB is a public company incorporated in Stockholm, Sweden, with limited liability. It is a participant at major Nordic and other European Regulated Markets and Multilateral Trading Facilities (as well as some non-European equivalent markets) for trading in financial instruments, such as markets operated by NASDAQ OMX, NYSE Euronext, London Stock Exchange, Deutsche Börse, Swiss Exchanges, Turquoise and Chi-X. SEB is authorized and regulated by Finansinspektionen in Sweden; it is authorized and subject to limited regulation by the Financial Services Authority for the conduct of designated investment business in the UK, and is subject to the provisions of relevant regulators in all other jurisdictions where SEB conducts operations. SEB Merchant Banking. All rights reserved.

Lower as OPEC+ keeps fast-tracking redeployment of previous cuts. Brent closed down 1.3% yesterday to USD 68.76/b on the back of the news over the weekend that OPEC+ (V8) lifted its quota by 547 kb/d for September. Intraday it traded to a low of USD 68.0/b but then pushed higher as Trump threatened to slap sanctions on India if it continues to buy loads of Russian oil. An effort by Donald Trump to force Putin to a truce in Ukraine. This morning it is trading down 0.6% at USD 68.3/b which is just USD 1.3/b below its July average.

Only US shale can hand back the market share which OPEC+ is after. The overall picture in the oil market today and the coming 18 months is that OPEC+ is in the process of taking back market share which it lost over the past years in exchange for higher prices. There is only one source of oil supply which has sufficient reactivity and that is US shale. Average liquids production in the US is set to average 23.1 mb/d in 2025 which is up a whooping 3.4 mb/d since 2021 while it is only up 280 kb/d versus 2024.
Taking back market share is usually a messy business involving a deep trough in prices and significant economic pain for the involved parties. The original plan of OPEC+ (V8) was to tip-toe the 2.2 mb/d cuts gradually back into the market over the course to December 2026. Hoping that robust demand growth and slower non-OPEC+ supply growth would make room for the re-deployment without pushing oil prices down too much.
From tip-toing to fast-tracking. Though still not full aggression. US trade war, weaker global growth outlook and Trump insisting on a lower oil price, and persistent robust non-OPEC+ supply growth changed their minds. Now it is much more fast-track with the re-deployment of the 2.2 mb/d done already by September this year. Though with some adjustments. Lifting quotas is not immediately the same as lifting production as Russia and Iraq first have to pay down their production debt. The OPEC+ organization is also holding the door open for production cuts if need be. And the group is not blasting the market with oil. So far it has all been very orderly with limited impact on prices. Despite the fast-tracking.
The overall process is nonetheless still to take back market share. And that won’t be without pain. The good news for OPEC+ is of course that US shale now is cooling down when WTI is south of USD 65/b rather than heating up when WTI is north of USD 45/b as was the case before.
OPEC+ will have to break some eggs in the US shale oil patches to take back lost market share. The process is already in play. Global oil inventories have been building and they will build more and the oil price will be pushed lower.
A Brent average of USD 60/b in 2026 implies a low of the year of USD 45-47.5/b. Assume that an average Brent crude oil price of USD 60/b and an average WTI price of USD 57.5/b in 2026 is sufficient to drive US oil rig count down by another 100 rigs and US crude production down by 1.5 mb/d from Dec-25 to Dec-26. A Brent crude average of USD 60/b sounds like a nice price. Do remember though that over the course of a year Brent crude fluctuates +/- USD 10-15/b around the average. So if USD 60/b is the average price, then the low of the year is in the mid to the high USD 40ies/b.
US shale oil producers are likely bracing themselves for what’s in store. US shale oil producers are aware of what is in store. They can see that inventories are rising and they have been cutting rigs and drilling activity since mid-April. But significantly more is needed over the coming 18 months or so. The faster they cut the better off they will be. Cutting 5 drilling rigs per week to the end of the year, an additional total of 100 rigs, will likely drive US crude oil production down by 1.5 mb/d from Dec-25 to Dec-26 and come a long way of handing back the market share OPEC+ is after.
The OPEC+ subgroup V8 this weekend decided to fully unwind their voluntary cut of 2.2 mb/d. The September quota hike was set at 547 kb/d thereby unwinding the full 2.2 mb/d. This still leaves another layer of voluntary cuts of 1.6 mb/d which is likely to be unwind at some point.
Higher quotas however do not immediately translate to equally higher production. This because Russia and Iraq have ”production debts” of cumulative over-production which they need to pay back by holding production below the agreed quotas. I.e. they cannot (should not) lift production before Jan (Russia) and March (Iraq) next year.
Argus estimates that global oil stocks have increased by 180 mb so far this year but with large skews. Strong build in Asia while Europe and the US still have low inventories. US Gulf stocks are at the lowest level in 35 years. This strong skew is likely due to political sanctions towards Russian and Iranian oil exports and the shadow fleet used to export their oil. These sanctions naturally drive their oil exports to Asia and non-OECD countries. That is where the surplus over the past half year has been going and where inventories have been building. An area which has a much more opaque oil market. Relatively low visibility with respect to oil inventories and thus weaker price signals from inventory dynamics there.
This has helped shield Brent and WTI crude oil price benchmarks to some degree from the running, global surplus over the past half year. Brent crude averaged USD 73/b in December 2024 and at current USD 69.7/b it is not all that much lower today despite an estimated global stock build of 180 mb since the end of last year and a highly anticipated equally large stock build for the rest of the year.
What helps to blur the message from OPEC+ in its current process of unwinding cuts and taking back market share, is that, while lifting quotas, it is at the same time also quite explicit that this is not a one way street. That it may turn around make new cuts if need be.
This is very different from its previous efforts to take back market share from US shale oil producers. In its previous efforts it typically tried to shock US shale oil producers out of the market. But they came back very, very quickly.
When OPEC+ now is taking back market share from US shale oil it is more like it is exerting a continuous, gradually increasing pressure towards US shale oil rather than trying to shock it out of the market which it tried before. OPEC+ is now forcing US shale oil producers to gradually back off. US oil drilling rig count is down from 480 in Q1-25 to now 410 last week and it is typically falling by some 4-5 rigs per week currently. This has happened at an average WTI price of about USD 65/b. This is very different from earlier when US shale oil activity exploded when WTI went north of USD 45/b. This helps to give OPEC+ a lot of confidence.
Global oil inventories are set to rise further in H2-25 and crude oil prices will likely be forced lower though the global skew in terms of where inventories are building is muddying the picture. US shale oil activity will likely decline further in H2-25 as well with rig count down maybe another 100 rigs. Thus making room for more oil from OPEC+.
The latest weekly report from the US DOE showed a substantial drawdown across key petroleum categories, adding more upside potential to the fundamental picture.

Commercial crude inventories (excl. SPR) fell by 5.8 million barrels, bringing total inventories down to 415.1 million barrels. Now sitting 11% below the five-year seasonal norm and placed in the lowest 2015-2022 range (see picture below).
Product inventories also tightened further last week. Gasoline inventories declined by 2.1 million barrels, with reductions seen in both finished gasoline and blending components. Current gasoline levels are about 3% below the five-year average for this time of year.
Among products, the most notable move came in diesel, where inventories dropped by almost 4.1 million barrels, deepening the deficit to around 20% below seasonal norms – continuing to underscore the persistent supply tightness in diesel markets.
The only area of inventory growth was in propane/propylene, which posted a significant 5.1-million-barrel build and now stands 9% above the five-year average.
Total commercial petroleum inventories (crude plus refined products) declined by 4.2 million barrels on the week, reinforcing the overall tightening of US crude and products.


Guld stiger till över 3500 USD på osäkerhet i världen

Lyten, tillverkare av litium-svavelbatterier, tar över Northvolts tillgångar i Sverige och Tyskland

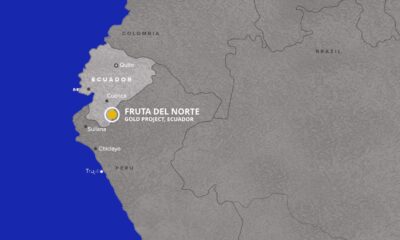
Lundin Gold hittar ny koppar-guld-fyndighet vid Fruta del Norte-gruvan

Alkane Resources och Mandalay Resources har gått samman, aktör inom guld och antimon
Breaking some eggs in US shale

USA inför 93,5 % tull på kinesisk grafit

Fusionsföretag visar hur guld kan produceras av kvicksilver i stor skala – alkemidrömmen ska bli verklighet

Westinghouse planerar tio nya stora kärnreaktorer i USA – byggstart senast 2030

Ryska militären har skjutit ihjäl minst 11 guldletare vid sin gruva i Centralafrikanska republiken

Eurobattery Minerals förvärvar majoritet i spansk volframgruva
-
 Nyheter3 veckor sedan
USA inför 93,5 % tull på kinesisk grafit
-
 Nyheter3 veckor sedan
Fusionsföretag visar hur guld kan produceras av kvicksilver i stor skala – alkemidrömmen ska bli verklighet
-
 Nyheter3 veckor sedan
Westinghouse planerar tio nya stora kärnreaktorer i USA – byggstart senast 2030
-
 Nyheter3 veckor sedan
Ryska militären har skjutit ihjäl minst 11 guldletare vid sin gruva i Centralafrikanska republiken
-
 Nyheter4 veckor sedan
Eurobattery Minerals förvärvar majoritet i spansk volframgruva
-

 Nyheter1 vecka sedan
Kopparpriset i fritt fall i USA efter att tullregler presenterats
-
 Nyheter1 vecka sedan
Lundin Gold rapporterar enastående borrresultat vid Fruta del Norte
-

 Nyheter3 veckor sedan
Kina skärper kontrollen av sällsynta jordartsmetaller, vill stoppa olaglig export