

Analys
SEB – Råvarukommentarer, 24 november 2014

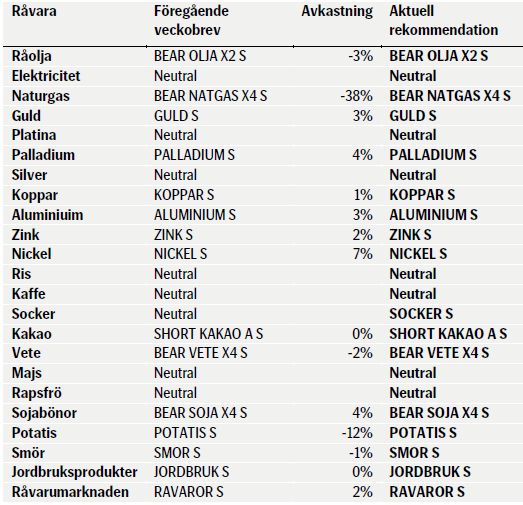
Veckans rekommendationer
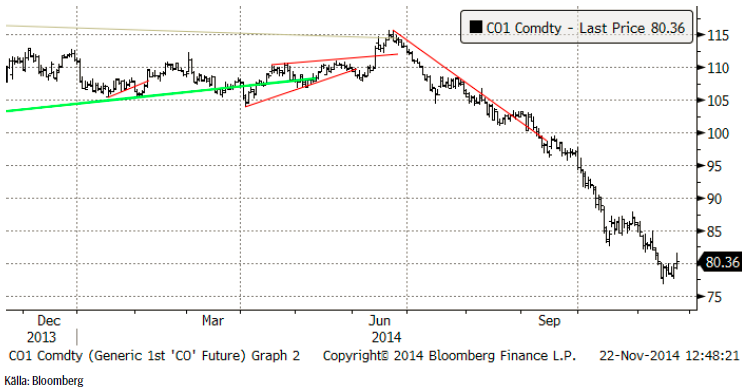
Råolja – Brent
OPEC möts i Wien på torsdag, den 27 november. Redan den 24 november (när det här brevet skickas ut), är det deadline för Irans kärnvapenförhandlingar. Iran vill ha en komplett överenskommelse och inte ett delvis lyftande av sanktionerna. Vi tror att sannolikheten för en överenskommelse till måndag är liten och det verkar marknaden tro också. Om det skulle bli en överenskommelse, skulle det leda till +1 mbpd ökat utbud det närmaste året och det vore riktigt negativt för oljepriset. Ett besked om att ingen överenskommelse nås den 24 november ger å andra sidan säkert bara lite stöd för oljepriset.
Mötet i Wien ska ses mot bakgrund av produktionen utanför OPEC och efterfrågetillväxten är sådan att ”call on OPEC” är ca 29.2 mbpd idag. OPEC skulle helst behöva se en mindre ökningstakt i produktionen av skifferolja och högre ökningstakt i efterfrågan globalt. OPEC ser idag ut att producera mer än 29.5 mbpd nästa år.
Libyen har hittills i år producerat i genomsnitt 0.45 mbpd och nästa år når de säkert 0.75 mbpd. Irak kommer att öka med 0.1 och kanske till och med 0.3 mbpd. Ett lägre oljepris dämpar ökningstakten i skifferoljeproduktion, men med eftersläpning. Nästa år ökar produktionen sannolikt med 0.1 mbpd – per månad, så att USA:s produktion ökar med 1 – 1.1 mbpd i produktionstakt.
Konsumtionen från IEA och EIA ligger också för högt. Således måste estimaten för efterfrågan justeras ner med kanske 0.3 mbpd. Med andra ord, kan ”call on OPEC” falla från 29.2 till 28.9. Det ska alltså jämföras med en produktionstakt inom OPEC på 30.3 mbpd hittills i år.
Nästa år kommer alltså att präglas av ökande lager och därmed contango i terminsmarknaden pga lagerkostnaden, starkare dollar och mindre spread mellan WTI och Brent, eventuellt.
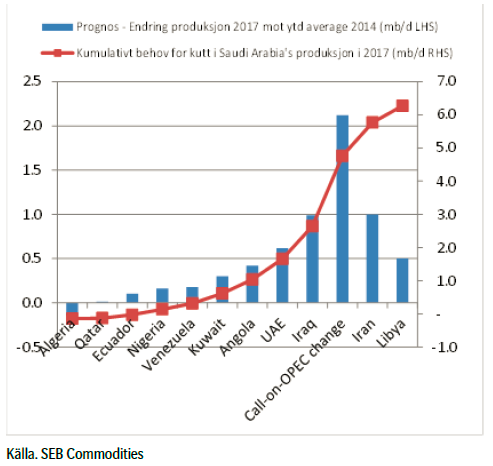
Förväntningen på mötet i Wien den 27 november är att OPEC ska sänka produktionen. I själva verket har flera länder i OPEC behov av att öka produktionen, vilket ger ett kumulativt behov för Saudiarabien att reducera produktionen med 6 mpbp. Vi ser ett diagram över detta nedan.
Eurozonens PMI, som publicerades i torsdags kom in lägre på 51.4 jämfört med oktobers 52.1. Förväntat var en ökning till 52.3. Ett PMI över 50 anses tyda på tillväxt i ekonomin. Sedan juli har PMI kommit in lägre än förväntat, men avvikelsen har inte varit så stor på åtminstone ett år. EU:s ekonomi utvecklar sig alltså väsentligt svagare än vad analytiker i gemen förväntar sig.
Även Kinas PMI kom in lägre än förväntat på torsdagen. Väntat var 50.2 och PMI blev 50, alltså precis på gränsen mellan tillväxt i tillverkningsindustrin och tillbakagång. I fredags sänkte Kina styrräntan och det fick bland annat metallerna att flyga.
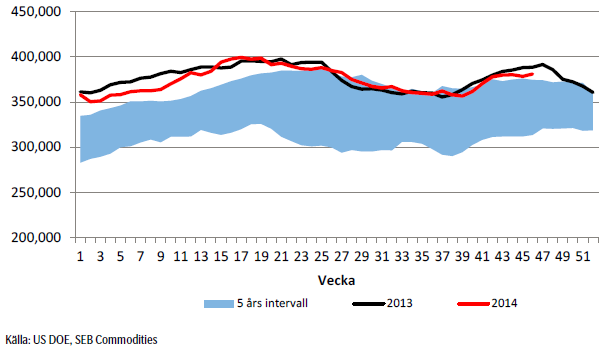
Lagren i USA ökade med 2.5 miljoner fat.
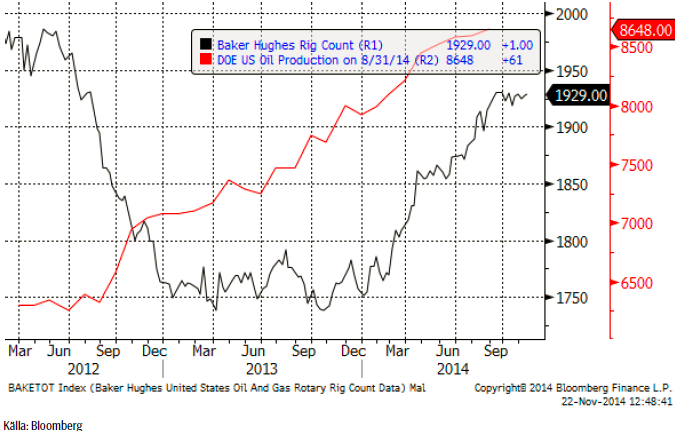
Nedan ser vi ett diagram på antalet oljeriggar i USA, enligt Baker Hughes statistik (svart). Antalet riggar i drift ökade med en från förra veckan till 1929 stycken enligt fredagskvällens statistik.
Vi rekommenderar en kort position, t ex med BEAR OLJA X2 S.
Elektricitet
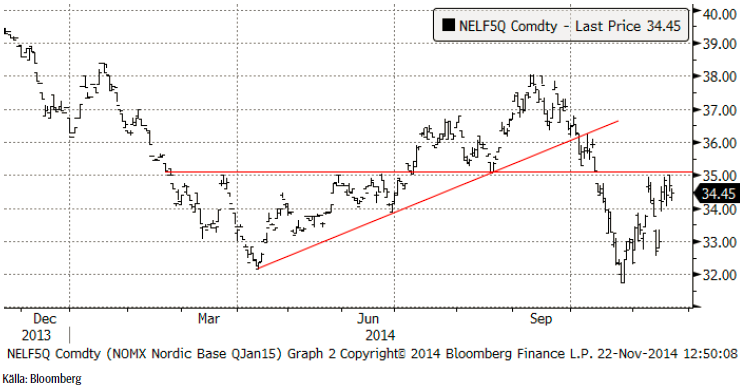
Priset på första kvartalets termin har sedan förra veckan stigit från 32.99 till 34.45 euro per MWh. 35 euro är dock ett starkt tekniskt motstånd. Priset på kol och utsläpssrätter har gått upp. Hydrologisk balans har gått ner något. Väderleksprognosen (se nedan under odlingsväder) har dock slagit om till rejält blötare än normalt för Norge och Sverige. Temperaturen i Stockholm ner till Malmö väntas också bli ett par grader över det normala.
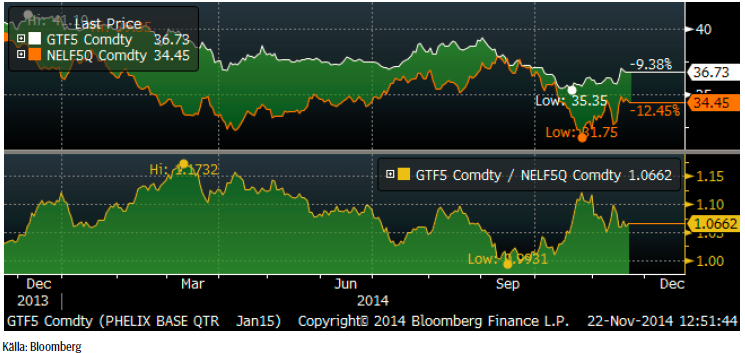
Nedan ser vi kvoten mellan priset på terminen för tysk el under första kvartalet och terminen för nordisk el för samma kvartal. Tysk el har inte fallit i pris på samma sätt under hösten som nordisk el har gjort, utan snarare gått upp något lite. Sedan september har skillnaden minskat från noll till 9.45%.
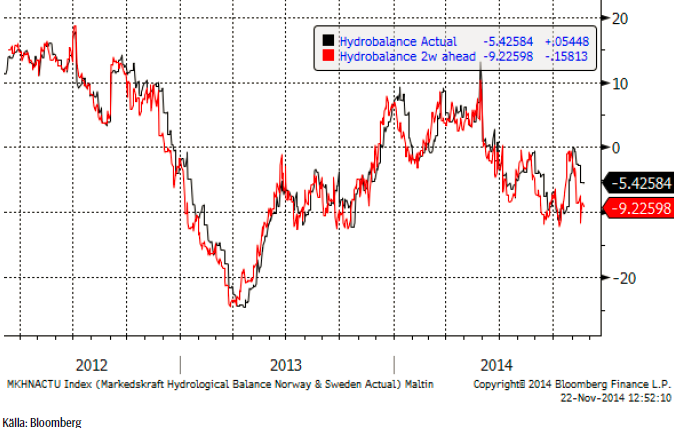
Hydrologisk balans har enligt 2-veckors prognosen fallit tillbaka ytterligare. Förra veckan prognosticerades ett underskott på 7.46 TWh och nu har underskottet ökat till -9.23 TWh.
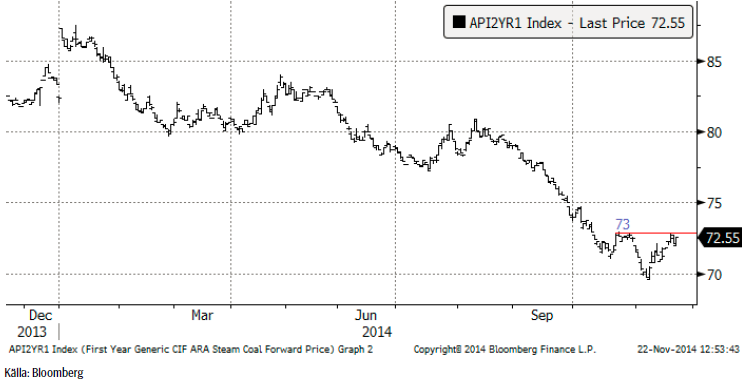
Nedan ser vi terminskontraktet för leverans av kol under 2015, som stigit från 71.25 till 72.55 dollar per ton. Notera att det verkar finnas ett tekniskt motstånd vid 73 dollar. Bryts det, ligger nästa motstånd vid 75 dollar, men det är inte särskilt starkt. Ett lite starkare motstånd finns vid 77 dollar.
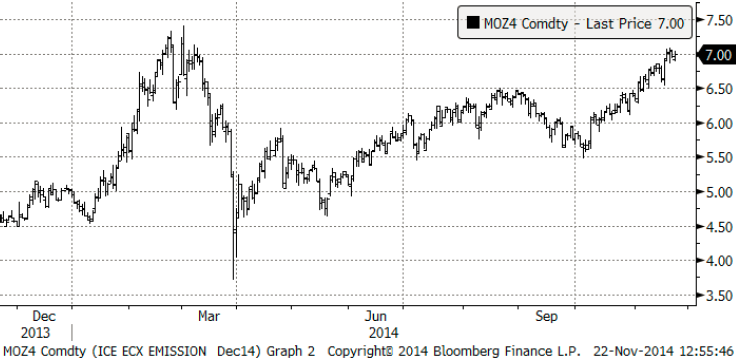
Priset på utsläppsrätter har också stigit och nådde det högsta priset sedan i mars i år.
Naturgas
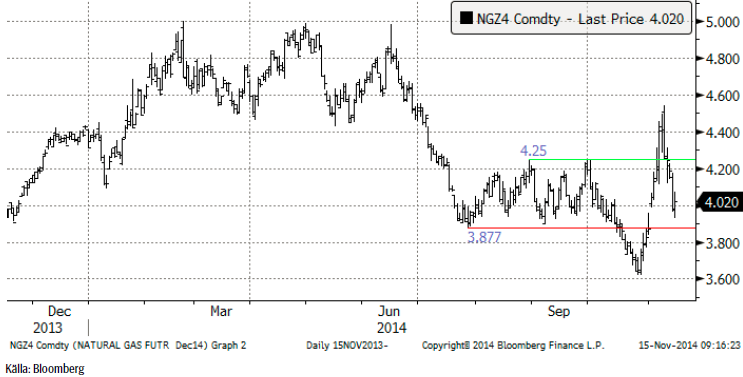
Naturgaspriset har i samband med snöstormen i nordöstra USA och kylan som drabbat nästan hela landet, varit extremt volatilt. Priset vände upp från förra veckans stängningspris på 4.02 dollar till nästan samma toppnivå som för två veckor sedan, till 4.53 dollar innan priset i fredags föll kraftigt och stängde på 4.266 dollar per miljon BTU.
Efter förra veckans uppgång på 54% i BEAR NATGAS X4 S byttes denna vecka till en nedgång på 38%.
Koppar
På samma tema som förra veckan, om hypotesen att Kinas strategiska reserv, SRB, successivt köper koppar, kom i veckan en artikel i Wall Street Journal som handlade om detta. En analytiker som intervjuas i artikeln, säger att planen kan vara att köpa upp till 2 miljoner ton koppar! Enligt artikeln har köpen hittills i år uppgått till 0.5 miljoner ton. Det stämmer överens med vad du kunde läsa här förra veckan (överensstämmer med hur mycket i lagerhus utanför LME som ”försvunnit”, enligt Metal Bulletin). Metal Bulletin har samlat ihop produktionsdata för det tredje kvartalet och skriver i sin senaste rapport, att kvartalet i sin helhet kan ha haft oförändrad eller till och med lägre produktion. Anledningen skulle vara lägre halter i malmen, vilket har varit ett problem för gruvindustrin i många år. Kopparpriset visar tecken på att bottna ut. Det är lite för tidigt att säga, men vi vidhåller att priset antagligen står inför en uppgångsfas (liksom resten av basmetallerna).
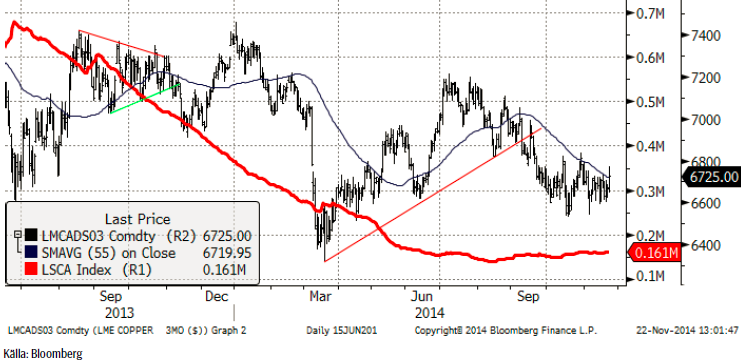
Koppar är den enda metallen som handlas på en amerikansk terminsbörs och är därför den enda vi får någon information om vad spekulanterna gör. Som vi ser nedan är de fortfarande rätt sålda men 1000 kontrakt mindre än förra veckan.
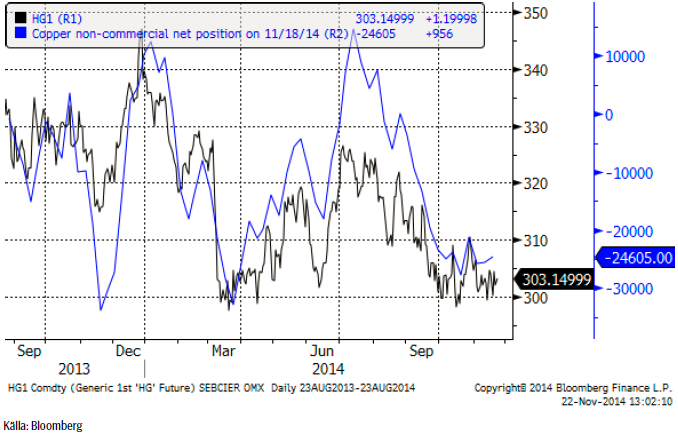
Vi håller fast vid vår rekommendation av KOPPAR S.
Aluminium
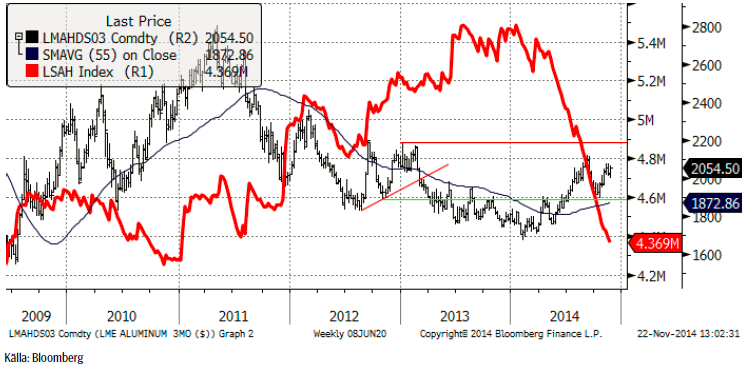
Terminskurvan börjar med backwardation från december till februari och därefter i contango. Det mest iögonenfallande är dock att kurvan är nästan helt platt under större delen av nästa år. Tecknen på brist i den närmaste delen av terminskurvan är delvis en funktion av att korta positioner rullas längre fram. Inte så mycket material har levererats i samband med den tredje onsdagen i månaden och det kan vara ett tecken på att den korta sidan består av fonder, som inte har så mycket att leverera. Terminerna längre ut är däremot säkert under prispress från producenter. Icke desto mindre har marknaden stärkts i veckan som gått, särskilt i fredags. Från ett tekniskt perspektiv handlar aluminium i ett brett tradingintervall mellan 2000 och 2075 dollar med en slagsida mot uppsidan.
Vi fortsätter att rekommendera köp av ALUMINIUM S.
Zink
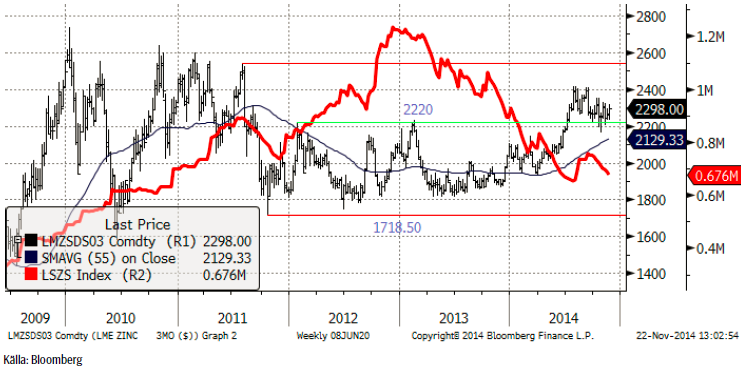
Som vi noterade förra veckan, ser kursutvecklingen i zink ungefär likadan ut som för koppar. Fredagens handel ser ut att ha brutit det tekniska motståndet. Styrkan i marknaden är förvånande för många aktörer. Det fundamentala underskottet i marknaden har ännu inte bitit ordentligt och investerare som köpt sig in i bull-caset har gått i och ur marknaden, vilket skapat en svängig, men trendlös marknad. Frågan är nu om marknaden håller på att diskontera allt för mycket av en ljus framtid. Tekniskt ser vi att det finns åtskilliga motstånd för en stigande trend att klara av. På kort sikt tror vi dock att zinkpriset kommer att följa med i en allmän prisuppgång på basmetaller fram till årsskiftet.
Vi rekommenderar köp av ZINK S.
Nickel
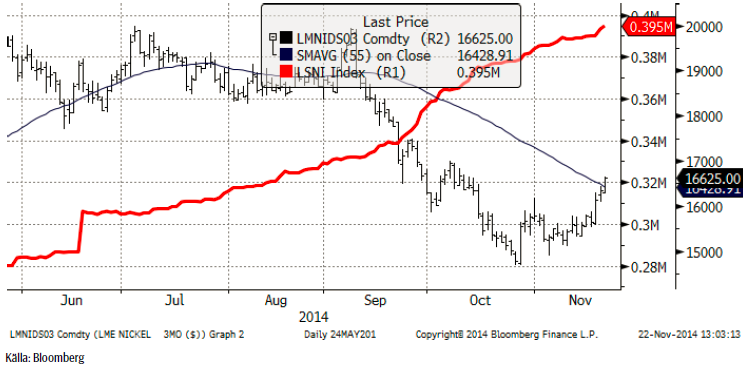
Nickelpriset steg starkt i veckan. Vi skrev förra veckan att det kunde vara dags för nickelmarknaden att vända uppåt – och det gjorde den med besked! Vi tittade på chartet och lagren och såg att priset verkade ha funnit en botten medan lagerökningen verkade ha tagit slut. Lagerökningen fortsatte faktiskt under veckan, så det var inte det som det handlade om. Icke desto mindre har antalet anullerade lagerbevis (warrants) ökat med 5000 ton mellan den 18 och 19 november. Det mesta skedde i Malaysia. Det kan vara ett tecken på en kommande vändning – och det är vad marknaden fokuserade på i veckan. Den utlösande faktorn var dock att den nya Indonesiska regeringen upprepade beslutet om exportstoppet. Vi erfar att uppgången handlar om en kombination av short-covering i terminsmarknaden och påfyllnad av lager hos industrin, som också legat ”kort” i förhållande till normal lagernivå. Tekniskt ser marknaden rätt positiv ut och indikerar högre pris på kort sikt. Brottet av triangelformationen i kombination med trendkanalsmotstånd pekar mot 17,000 dollarsnivån som mål.
Vi rekommenderar köp av NICKEL S.
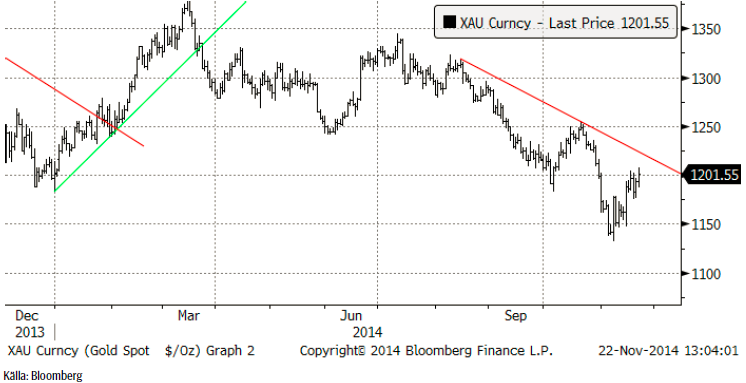
Guld
ECB-chefen Mario Draghis uttalande i måndags att ECB kan komma att köpa tillgångar som guld och ETF:er på guld, för att stimulera ekonomin genom utbetalning av mer pengar, fick guldpriset att stiga.
På söndagen den 30 november går schweizarna till röstlokalerna för att bestämma om centralbanken ska köpa tillbaka 1500 ton guld som såldes i början av guldboomen på 00-talet. I den senaste opinionsmätningen var bara 38% för förslaget, så det är inte sannolikt att det går igenom. Studerar man historien, ser man att centralbanker generellt sett tenderar att sälja innan en fas av prisuppgång börjar, eller alldeles i början av den och köpa mot nära eller efter att toppen har nåtts. Ett ”ja” i den schweiziska folkomröstningen skulle snarare bekräfta den tendensen, än att vara en ”köpsignal” för oss andra. Centralbanker började köpa för några år sedan, strax innan guldpriset toppade ur och har fortsatt med det. Den senaste tiden har Ryssland köpt mest.
Fredagens prisuppgång beror till stor del på att Kina sänkte styrräntan, efter den svaga PMI-statistiken i torsdags.
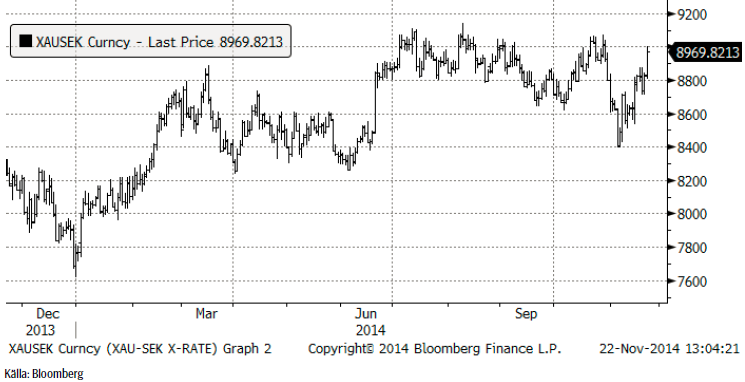
Chartet för guld i kronor steg likaså.
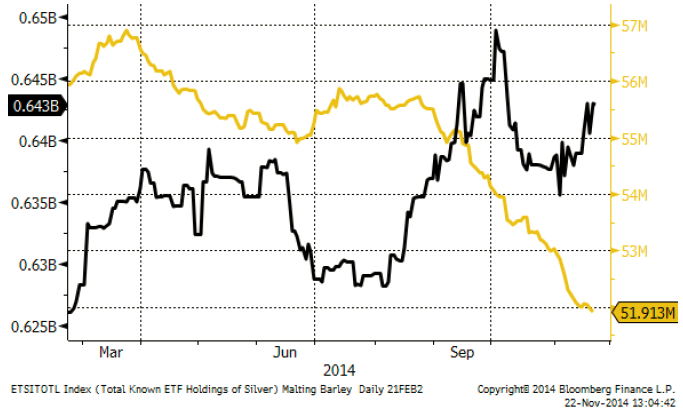
Institutionella investerare äger via ETF/ETC-er 51.91 miljoner uns guld. Förra veckan var det 52.02 miljoner uns. Investerare har däremot ökat innehaven av silver till 643 miljoner uns från 639 miljoner uns.
Vi håller fast vid positionen i GULD S, ännu lite till.
Silver
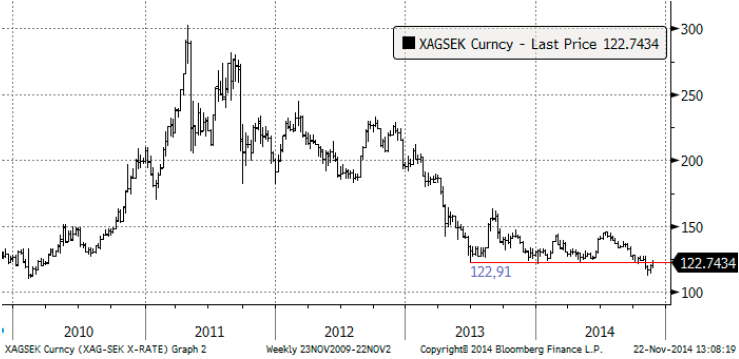
Silverpriset håller eventuellt på att bryta den fallande pristrenden, men än är det lite för tidigt att dra den slutsatsen.
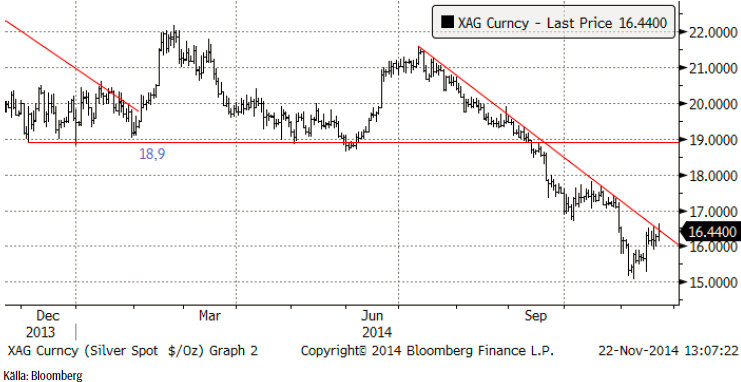
Silverpriset i kronor, nedan visat i ett veckochart, har stigit från120.53 kronor per uns förra veckan till 122.74 i fredags. Notera att motståndet vid 122.91 ännu inte är brutet. Den här uppgången är därmed mer av ett säljtillfälle. Skulle dock silver handlas i 123 eller något högre, måste man ta en stopp-loss på en position i BEAR SILVER X4 S. Tills vidare fortsätter vi dock att rekommendera köp av BEAR SILVER X4 S.
Platina & Palladium
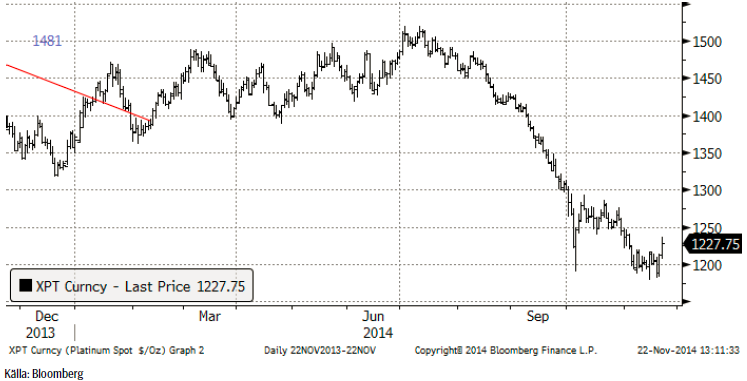
Platina har ökat i pris från förra veckans 1213 dollar till 1227.75 vid fredagens stängning. 1250 är ett motstånd, som marknaden måste passera innan man kan börja tala om trendvändning uppåt.
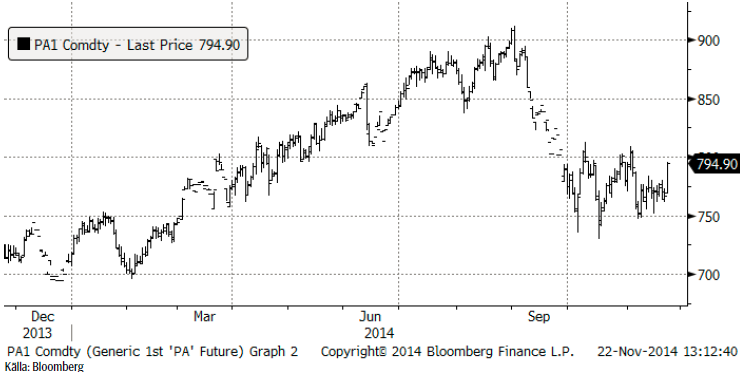
Palladiumpriset har stigit från 771 förra veckan till 794.90 i fredags. Ett nytt test av motståndet som ligger strax ovanför 800 verkar troligt.
Nedanför ser vi hur mycket metall som finns i börshandlade fonder för platina respektive palladium. Investerare har sålt platina och köpt palladium den senaste veckan.
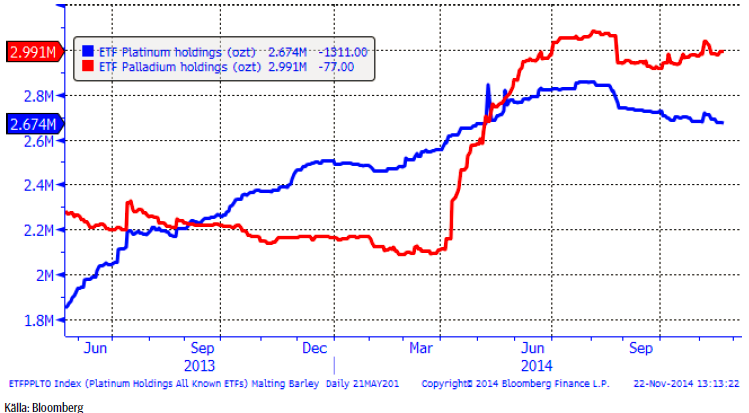
Vi fortsätter med neutral rekommendation på platina, men rekommenderar köp av palladium via t ex PALLADIUM S.
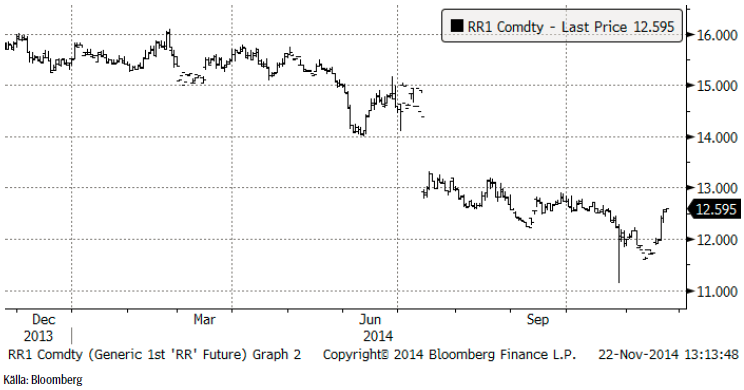
Ris
Priset på ris fortsatte att gå ner och stängde på 11.73 dollar per cwt.
För fler analyser på fler jordbruksråvaror, så som vete, majs, kaffe och kakao se SEB analysbrev om jordbruksråvaror.
[box]SEB Veckobrev Veckans råvarukommentar är producerat av SEB Merchant Banking och publiceras i samarbete och med tillstånd på Råvarumarknaden.se[/box]
Disclaimer
The information in this document has been compiled by SEB Merchant Banking, a division within Skandinaviska Enskilda Banken AB (publ) (“SEB”).
Opinions contained in this report represent the bank’s present opinion only and are subject to change without notice. All information contained in this report has been compiled in good faith from sources believed to be reliable. However, no representation or warranty, expressed or implied, is made with respect to the completeness or accuracy of its contents and the information is not to be relied upon as authoritative. Anyone considering taking actions based upon the content of this document is urged to base his or her investment decisions upon such investigations as he or she deems necessary. This document is being provided as information only, and no specific actions are being solicited as a result of it; to the extent permitted by law, no liability whatsoever is accepted for any direct or consequential loss arising from use of this document or its contents.
About SEB
SEB is a public company incorporated in Stockholm, Sweden, with limited liability. It is a participant at major Nordic and other European Regulated Markets and Multilateral Trading Facilities (as well as some non-European equivalent markets) for trading in financial instruments, such as markets operated by NASDAQ OMX, NYSE Euronext, London Stock Exchange, Deutsche Börse, Swiss Exchanges, Turquoise and Chi-X. SEB is authorized and regulated by Finansinspektionen in Sweden; it is authorized and subject to limited regulation by the Financial Services Authority for the conduct of designated investment business in the UK, and is subject to the provisions of relevant regulators in all other jurisdictions where SEB conducts operations. SEB Merchant Banking. All rights reserved.

Selling down on a ”deal”. Brent crude fell 6.2% last week with accelerated weakness towards the end of the week. Close of the week at $87.33/b and low of the week (and on Friday) of $85.8/b. Brent is falling another 4% this morning to $83.7/b on confirmation by Iran that a MoU text has been reached and that it will be signed on Friday this week.

So what is this ”deal” worth? Talk on the desk here this morning is that it is much like ”putting lipstick on a pig” where Trump has to sell this at home as a victory where ”the SoH has reopened”, the nuclear issue will be ironed out over the coming 60 days (or maybe 600 days?) and US consumers are getting a lower gasoline price and maybe US republicans survives the midterm elections.
The importance for Iran is that it emerges as the defacto winner of this war in the eyes of the non-US public world. That Iran now onwards is the ”ruler of the SoH” (combo of geography and new weapons systems like drones) or more softer: ”the guarantor of safe passage through the SoH”.
Iran doesn’t need nuclear weapons any more. Nuclear deterrence doesn’t work any more. Ukraine has made many attacks deep into Russia without being nuked in return. Plenty of Iranian ballistic rockets blasts over Israel but Iran wasn’t nuked in return.
There is no trust between the US and Iran. We don’t know all the details yet of the MoU. But what we do know is that there is no trust between the US and Iran what so ever. This is probably more like a descriptive text on how they can cooperate in a way where both sides keeps tactical leverage. Neither side makes irreversible concessions. Violations can be punished quickly. Cooperation produces immediate benefits.
This is a fragile structure. It can easily break down. There may be details which cannot be overcome. To be seen on Friday. The US has to show that it is willing put enough force behind managing and restraining Israel versus Hezbollah in Lebanon. We have seen that Netanyahu hasn’t listened all that much to Trump’s directives and wishes. This could be a major obstacle.
A gradual reopening is tactically preferable for Iran. A tactical leverage for Iran right now is that global oil stocks have been drawn down towards painful and increasingly dangerous levels with increasing risks for oil price spikes in mid-July to August. This together with US midterm elections on 3 November gives tactical leverage to Iran. Iran probably doesn’t want to fully give up on that leverage. A rapid, full reopening where global stocks are able to refill over the coming 60 days will significantly erode that leverage. If Iran reinstates a closure of the SoH after 60 days (if talks break down again), then the effect won’t be that impactful in terms of prices and the US midterm elections.
So a gradual and partial reopening where global markets gets the oil they need while they are unable to rebuild stocks could be a practical middle way for both parties. Trump can sell it as ”the SoH has reopened” and get affordable gasoline for US consumers. Iran can sell it as ”the SoH has fully reopened, but there is some friction” so flow is only 60-80% of normal.
Not much real demand destruction below $100/b. What we do know is that there is not much real price pain demand destruction for oil globally at an oil price below $100/b. A lot of demand-shock destruction. Fear. But demand should now come roaring back towards normal with fear for exceptionally high prices now is rapidly receding.
Sudden China demand destruction due to EVs? Bullocks. EV share of total Chinese carpool now around 13%. Share of new sales of EVs has reached 50%. This is a very gradual process. It doesn’t make oil demand fall like a rock over night. When EV new sales share reaches 100%, then the gasoline car pool will contract by some 5-10% per year. But that is only gasoline. Sudden reduction in Chinese oil demand is more about shock and risk.
Chinese crude oil imports will come roaring back. At what price? Today’s ”neutral” oil price is $70/b. That is the five year price which has steadily traded around the $70/b mark over the past 3-4 years. With still a risky picture one would think that China and the rest of the world will be big buyers of oil in the range of $70-85/b.
Global demand will likely snap back towards normal, forecasted demand and growth at such prices.
Physical reopening is a gradual process. The physical and practical reopening of the SoH will likely be gradual rather than sudden. And that probably suites Iran tactically as well.
Brent M1 price versus the Brent 5-yr (today’s ”normal” price)

Market is starting to take US/Iran headlines with a pinch of salt. Brent crude rose $2.8/b yesterday to an official close of $112.1/b. But after that it traded as low as $108.05/b before ending late night at around $109.7/b. Through the day it traded in a range of $106.87 – 112.72/b amid a flurry of news or rumors from Iran and the US. ”US temporary sanctions during negotiations” (falls alarm). ”We will bomb Iran” (not anyhow),… etc. While the market is still fluctuating to this kind of news flow, it is starting to take such headlines with a pinch of salt.
We’ll see. Maybe, maybe not. The Brent M1 contract is trading at $110.2/b this morning which very close to the average ticks through yesterday of $110.4/b.
Trump with bearish, verbal intervention whenever Brent trades above $110/b it seems. What seems to be a pattern is that Trump states something like ”very good negotiations going on with Iran”, ”New leaders in Iran are great,..”, ”Great progress in negotiations,…”, ”Deal in sight,..” etc whenever the Brent M1 contract trades above $110/b. An effort to cool the market. These hot air verbal interventions from Trump used to have a heavy bearish impact on prices, but they now seems to have less and less effect unless they are backed by reality.
As far as we can see there has been no real progress in the negotiations between the US and Iran with both sides still standing by their previous demands.
Iran is getting stronger while the cease fire lasts making a return to war for Trump yet harder. Iran is naturally in constant preparation for a return to war given Trump’s steady threats of bombing Iran again. Iran is naturally doing what ever is possible to prepare for a return to war. And every day the cease fire lasts it is better prepared. This naturally makes it more and more difficult and dangerous for the US to return to warring activity versus Iran as the consequences for energy infrastructure in the Persian Gulf will be more and more severe the longer the cease fire lasts. Israel seems to see it this way as well. That the war is not won and that current frozen state of a cease fire gives Iran opportunity to rebuild military and politically.
Global inventories are drawing down day by day. How much? In the meantime the Strait of Hormuz stays closed. There is varying measures and estimates of how much global inventories are drawing down. Our rough estimate, back of the envelope, is that global inventories are drawing down by at least some 10 mb/d or about 300 mb/d in a balance between loss of supply versus demand destruction. Other estimates we see are a monthly draw of 250-270 mb/d. The IEA only ’measured’ a draw in global observable stocks of 117 mb in April with oil on water rising 53 mb while on shore stocks fell 170 mb. But global stocks are hard to measure with large invisible, unmeasured stocks. As such a back of the envelope approach may be better.
Oil products is what the world is consuming. Oil product prices likely to rise while product stocks fall. Strategic Petroleum Reserves (SPR) are predominantly crude oil. Discharging oil from OECD SPR stocks, a sharp reduction in Chinese crude imports and a reduction in global refinery throughput of 6-7 mb/d has helped to keep crude oil markets satisfactorily supplied. But global inventories are drawing down none the less. And oil products is really what the world is consuming. So if global refinery throughput stays subdued, then demand will eventually have to match the supply of oil products. The likely path forward this summer is a steady draw down in jet fuel, diesel and gasoline. Higher prices for these. Then, if possible, higher refinery throughput and higher usage of crude in response to very profitable refinery margins. And lastly sharper draw in crude stocks and higher prices for these. But some 6 mb/d of oil products used to be exported through the Strait of Hormuz. And it may not be so easy to ramp up refinery activity across the world to compensate. Especially as Ukraine continues to damage Russian refineries as well as Russian crude production and export facilities.
Watch oil product stocks and prices as well as Brent calendar 2027. What to watch for this summer is thus oil product inventories falling and oil product premiums to crude rising. Another measure to watch is the Brent crude 2027 contract as it rises steadily day by day as the Strait of Hormuz stays closed and global oil inventories decline. The latter is close to the highest level since the start of the war and keeps rising.
The Brent M1 contract and the Brent 2027 prices and current price of jet fuel in Europe (ARA). All in USD/b

Our back of the envelope calculation of the global shortage created by the closure of the Strait of Hormuz. Note that 3.5 mb/d of discharge from SPR is also a draw. Note also that ’Forced demand loss’ of 2.5 mb/d is probably temporary and will fall back towards zero as logistics are sorted out leaving ’Price demand loss’ to do the job of balancing the market. Thus a shortfall of at least 9 mb/d created by the closure. More if SPR discharge is included and more if Forced demand loss recedes.

Brent is climbing higher. Front-month is at USD 106.3/bl this morning, close to a weekly high and a USD 9/bl jump from Mondays open. This is the move we flagged as a risk earlier in the week: the market shifting from ”a deal is around the corner” to ”this is going to take longer than we thought”.

Analyst Commodities, SEB
During April, rest-of-year Brent remained remarkably stable around USD 90/bl. A stability which rested on one single assumption: the SoH reopens around 1 May. That assumption is now slowly falling apart.
As we highlighted yesterday: every week of delay beyond 1 May adds (theoretically) ish USD 5/bl to the rest-of-year average, as global inventories draw 100 million barrels per week. i.e., a mid-May reopening implies rest-of-year Brent closer to USD 100/bl, and anything pushing into June or July takes us meaningfully higher.
What’s changed in the last 48 hours:
#1: The US military has formally warned that clearing suspected sea mines from SoH could take up to six months. That is a completely different timescale from what the financial market is pricing. Even a political deal tomorrow does not immediately reopen the strait.
#2: Trump has shifted his tone from urgency to ”strategic patience”. In yesterday’s press conference: ”Don’t rush me… I want a great deal.” The market is reading this as a president no longer feeling pressured by timelines, with the naval blockade running in the background.
#3: So far, the military activity is escalating, not de-escalating. Axios reports Iran is laying more mines in SoH. The US 3rd carrier strike group (USS George H.W. Bush) is arriving with two countermine vessels. Trump yesterday ordered the US Navy to destroy any Iranian boats caught laying mines. While CNN reports that the Pentagon is actively drawing up plans to strike Iranian SoH capabilities and individual Iranian military leaders if the ceasefire collapses. i.e., NOT a attitude consistent with an imminent deal!
Spot crude and product prices eased off the early-April highs on a combination of system rerouting and deal optimism. Both now weakening. Goldman estimates April Gulf output is reduced by 14.5 mbl/d, or 57% of pre-war supply, a number that keeps getting worse the longer this drags on.
Demand-side adaptation is ongoing: S. Korea has cut its Middle East crude dependence from 69% to 56% by pulling more from the Americas and Africa, and Japan is kicking off a second round of SPR releases from 1 May. But SPRs are finite.
Ref. to the negotiations, we should not bet on speed. The current Iranian leadership is dominated by genuine hardliners willing to absorb economic pain and run the clock to extract concessions. That is not a setup for a rapid resolution. US/Israeli media briefings keep framing the delay as ”internal Iranian divisions”, the reality is more complicated and points toward weeks and months, not days.
Our point is that the complexity is large, and higher prices have only just started (given a scenario where the negotiations drag out in time). The market spent April leaning on the USD 90/bl rest-of-year assumption; that case is diminishing by the hour. If ”early May reopening” is replaced by ”June, July or later” over the next week or two, both crude and products have meaningful room to reprice higher from here. There is a high risk being short energy and betting on any immediate political resolution(!).


Vattenfalls och Industrikrafts kärnkraftsbolag Videberg Kraft har valt Rolls-Royce SMR
Selling down on a ”deal”

Sommarväder skapar prisrally på elbörsen
Oil product price pain is set to rise as the Strait of Hormuz stays closed into summer

