

Analys
SEB Jordbruksprodukter, 24 november 2014

 Marknaderna för jordbruksprodukter var ganska lugn i veckan. Oron för utvintring av höstvetet i USA har lagt sig. Franskt vete fortsätter att vinna exportordrar, i veckan både till Egypten och till USA, vilket ger stöd för en prisuppgång på Matif, men inte i Chicago.
Priset på mjölkprodukter fortsätter att notera lägre priser. På Global Dairy Trade noterades det lägsta genomsnittliga priset på nästan 5 och ett halvt år.
Kinas PMI (inköpschefsindex) kom in lägre än förväntat på torsdagen. Väntat var 50.2 och PMI blev 50, alltså precis på gränsen mellan tillväxt i tillverkningsindustrin och tillbakagång. I fredags sänkte Kina styrräntan, förmodligen som ett svar på detta, och det fick såväl aktier som metaller och flera andra Kina-relaterade råvaror att lyfta kraftigt. Inköpschefsindex för Eurozonen kom in mycket lägre än förra månaden och marknaden hade förväntat sig en högre siffra än förra månaden. ECB sade samtidigt att de skulle göra ”vad som helst” för att skapa inflation, vilket fick kapital att flytta från euron till dollarn. Den ekonomiska tillväxten har problem överallt, utom i USA. Mer pengar leder på kort sikt till högre tillgångspriser, men inte nödvändigtvis till högre tillväxt och konsumtion (av mat, till exempel). Tvärtom kan lägre tillväxt faktiskt ge lägre pris på mat.
Marknaden har inte riktigt tagit till sig att det ser ut att bli ett El Niño från Jul. Ett sådant ger regn över Sydamerika, vilket ger en boost för produktionen av sojabönor och majs. Det ger också en bra start för odlingssäsongen på norra halvklotet. Inget av detta är positivt för prisutvecklingen på jordbruksprodukter.
Odlingsväder
NOAA publicerade sin långtidsprognos för december i torsdags och det ser gynnsamt ut för höstgrödorna. De förutspår att vädret i södra USA blir kallare än normalt och att det blir normal nederbörd i norra och centrala USA, vilket ger ytterligare snötäcke. Detta är i linje med den allmänna El Niño-stämning som jag rapporterade om förra veckan.
Det kan tilläggas att om El Niño verkligen slår in och håller i sig fram till våren, ger detta ett gynnsamt odlingsväder på norra halvklotet.
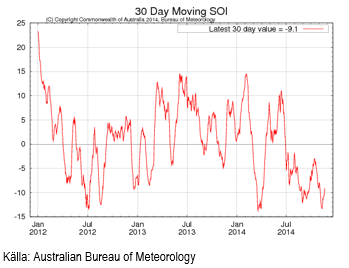
Southern Oscillation Index ligger vid -10.9 efter att ha fallit och nått -13.3 som lägst. Ett SOI under -8 kan indikera ett El Niño. I diagrammet nedan ser vi ett 30-dagars glidande medelvärde av SOI.
I USA väntas temperaturen fortsätta att ligga 5 till 10 grader under det normala i ’corn belt’. Resten av landet får normal temperatur, utom västkusten som blir varmare än normalt. Nederbörden i USA blir högre än normalt där det brukar regna och torrare än normalt där det brukar vara torrt (New Mexico, Arizona). Den enda avvikelsen är att Texas blir mycket blötare än normalt. Såsom är vanligt vid ett El Niño blir det blötare i Montana.
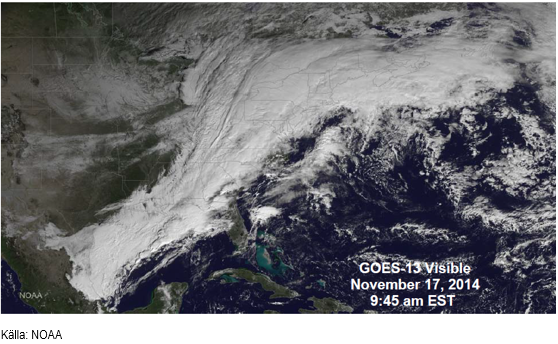
Nedan ser vi en satellitbild från GOES-13, som visar snöovädret som drog förbi tidigare i veckan. Notera att det ser ut att finnas ett snötäcke på marken väster om där snöovädret drar fram.
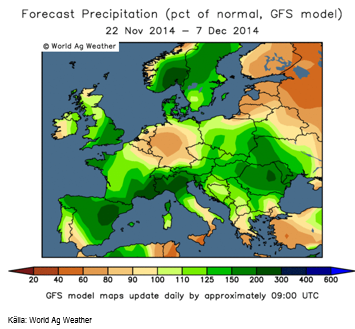
Noterbart för Europa är att Sverige och Norge får väsentligt mycket mer nederbörd än vad förra veckans prognos visade. Det påverkar elpriset negativt. Generellt sett förutspås ovanligt mycket nederbörd över Europa, utom över Benelux och Tyskland. Baltikum, Finland och Ryssland är dock torrare än normalt. Temperaturerna blir normala i hela Europa, utom i Baltikum och Ryssland där det blir några grader kallare än normalt.
North Atlantic Oscillation förutspås bli mer positiv. Ett negativt NAO ger kyla och vindstilla väder i Nordeuropa.
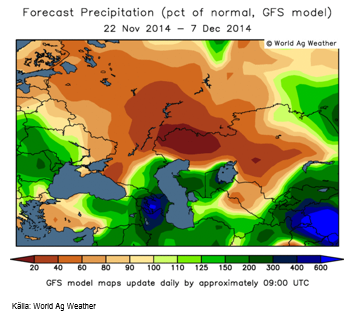
Ryssland ser i den senaste 14-dagarsprognosen fortsatt torrt ut. Nederbörden väntas ligga på mellan 40 och 60% av normal nederbörd. Västra Ukraina väntas däremot liksom i förra veckans prognos få upp till 3 gånger normal nederbörd. Temperaturen sjunker om en vecka till under det normala i Ryssland. Öster om Uralbergen sjunker temperaturen till 10 grader under det normala.
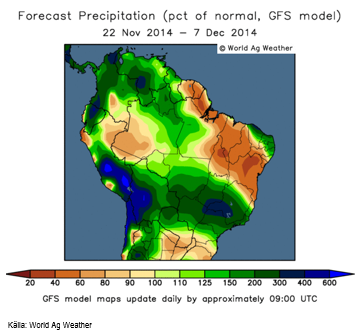
Nederbörden i Brasilien ökar från förra veckans tvåveckorsprognos. Onormalt mycket nederbörd fortsätter att förutspås för São Paulo, Minas Gerais, Goiás och Mato Grosso. I hörnet där dessa delstater möts väntas upp till fyra gånger normal nederbörd falla.
Notera nederbörden i Peru och norra Chile, som är typisk för El Niño, med upp till sex gånger normal nederbörd i prognosen. Från Peru rapporteras också att ansjovisen försvunnit från fiskebankarna, vilket också är ett säkert tecken på att El Niño är i antågande.
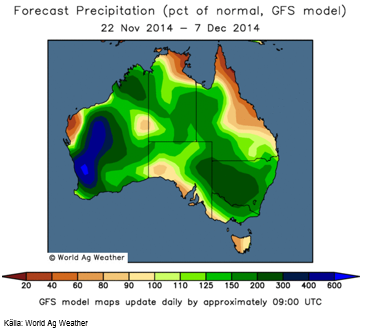
El Niño innebär också att Australien ska vara torrt, men det är det verkligen inte. Tvärtom faller i västra Australien upp till 7 gånger så mycket regn som normalt, medan den östra sidan får upp till 3 gånger så mycket som normalt. Hela kontinenten ser blötare ut än normalt. Detta är knappast bra för kvaliteten på vetet som skördas nu.
Vete
Trots oron för kylan i USA, var måndagens crop condition oförändrat på höga 60% good/excellent.
Tisdagens stora nyhet var att Frankrike lyckats sälja den största lasten av fodervete till USA. Det var den största lasten på 12 år.
Frankrike har vunnit en rad GASC-tendrar de senaste veckorna. Det beror delvis på att euron är svag mot dollarn. Torsdagens GASC vanns återigen av Soufflet, som fick sälja 60,000 ton 259.87 dollar inklusive frakt. Vi kan se av offerterna att den erbjöds till 243.74 dollar, så mellanskillnaden är frakt. Exklusive frakt motsvarar det ett pris på 194.20 euro per ton. När januarikontraktet på MATIF handlas på 174, motsvarar det alltså en premie på 20 euro per ton för 200 i falltal för vetet. Totalt offererades 300 kt franskt, 405 kt ryskt, 120 kt rumänskt och 55 kt ukrainskt vete. Värt att notera är att amerikanskt vete återigen inte ens ställde upp i budgivningen.
Ukrainas departement för ekonomisk utveckling estimerar årets skörd i landet till rekordhöga 63.2 mt, vilket är lite högre än förra årets 63 mt (som då inkluderade Krim). De estimerar veteproduktionen till 24 mt och majsskörden till 28 mt. USDA:s estimat är 24.5 mt respektive 27 mt. Alltså lite positivt med avseende på vetepris och lite negativt för majspris.
Argentinas skörd rapporterades i veckan vara klar till 22%, vilket är snabbare än förra årets 13% så här års. Skörden väntas vara klar i januari.
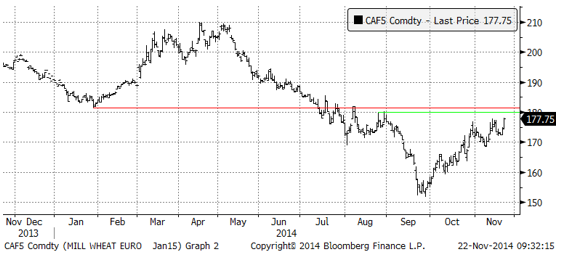
Vetepriset på Matif har segat sig upp till 177.75 euro per ton för januarileverans. Det franska vetet vinner ju exportordrar, så vetet handlas successivt upp. Strax över 180 finns ett motstånd, som marknaden borde få problem med.
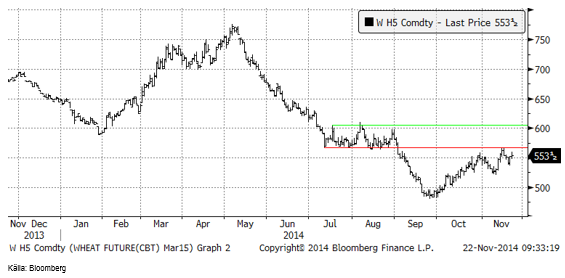
Chicagovetet (mars) har inte utvecklat sig lika positivt som Matif, men så vinner inte heller det amerikanska vetet några exportordrar. Marknaden har inte lyckats ta sig över det tekniska motstånd som begränsar uppsidan.
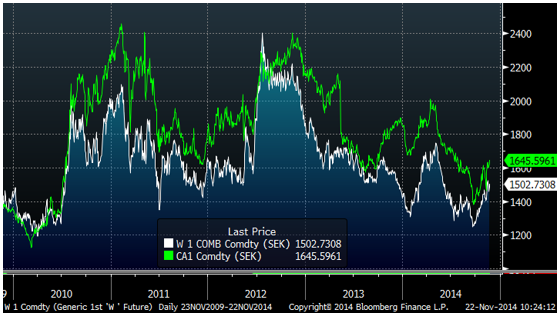
Medan prisutvecklingen i dollartermer ser svag ut för vetepriset, får man en något annan bild när man räknar om priset till kronor per ton. I diagrammet nedan ser vi den senaste femårsperioden för priset på spotkontraktet på Matif respektive Chicago. Vi ser att priset på vete basis Chicago har gått upp från 1257 till 1502 kr sedan slutet av september. Matif har under tiden gått upp från 1392 till 1645 kr.
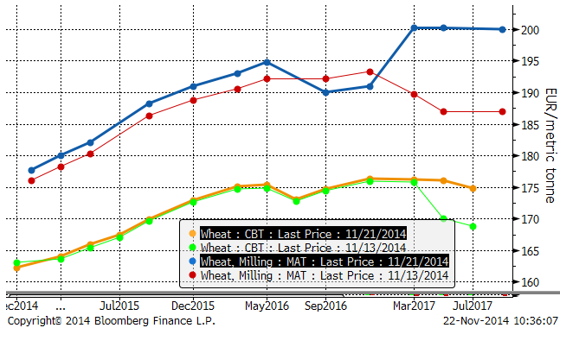
Nedan ser vi terminskurvorna i fredags och en vecka tidigare för Matif respektive Chicago. Det är contango på båda marknader. Här ser vi att den senaste veckan har Matifs terminskurva gått upp i euro, medan Chicagos faktiskt varit oförändrad, när vi räknar om den till euro.
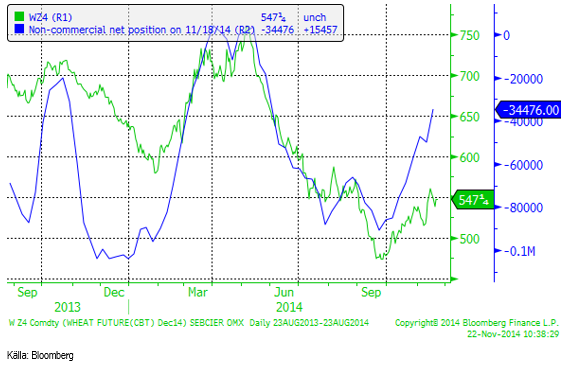
Så slutligen till vad spekulanterna gjort i Chicagovetet. Vi ser att de har köpt tillbaka ytterligare 15,457 kontrakt och nu är nettosålda 34,476 kontrakt. Vid slutet av september var de nettosålda 90,000 kontrakt.
Majs
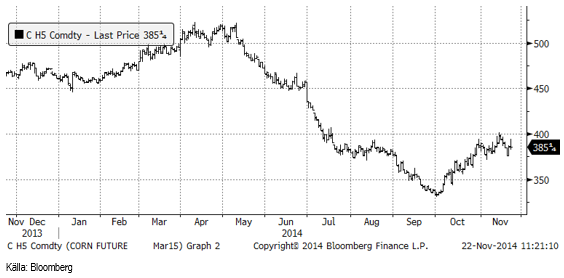
Decemberkontraktet CZ4 har gått ner med 2% sedan förra veckan och stängde i fredags på 385.25 cent.
Skörden av majs accelererade enligt måndagens rapport från 80 till 89% klart. Normal takt är 80%. Skördearbetet har gått fortare mot slutet.

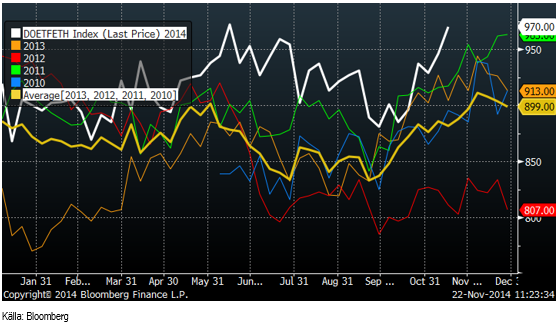
Etanolproduktionen i USA ligger på 970,000 fat per dag. Det är nästan lika högt som den rekordvecka som noterades i mitten av juni med en produktionstakt på 972,000 fat om dagen. Etanolproduktionen har hämtat sig sedan en botten i början av år 2013 på 770,000 fat per dag, då den fallit från en topp på 963,000 fat vid årsskiftet 2011/2012.
EPA i USA har ännu inte bestämt hur mycket etanol som ska blandas in i amerikansk bensin under år 2014. Ett beslut kommer alltså att bli retroaktivt, vilket föranlett skrammel om stämningar i domstol från tillverkarna. Förseningen verkar bero på att presidenten ännu inte uttalat sig i frågan, vilket kan tolkas som att entusiasmen över stödet till förnybart bränsle har svalnat. Lagen infördes under Bush-eran år 2005 för att minska USA:s beroende av importerad olja och samtidigt ge stöd till amerikanska lantbrukare. Detta var innan ”råvaruboomen” tog fart på allvar och priset på majs hade legat på ungefär samma nivå sedan 1980. Läget idag är ett helt annat. Dels kommer USA att vara självförsörjande på olja inom fem år och dels är priset på majs avsevärt högre och spannmålsbönderna inte i behov av stöd på samma sätt. USA har reducerat utsläpp av CO2 väsentligt mycket mer än andra länder, t ex EU genom att använda mer naturgas, som produceras billigt med ny teknik (fracking). Stödet till etanol är troligtvis på upphällningen och presidentens tvekan att spendera pengar på detta är troligtvis ett tecken på våndan att fatta rätt beslut och politiskt korrekt beslut.
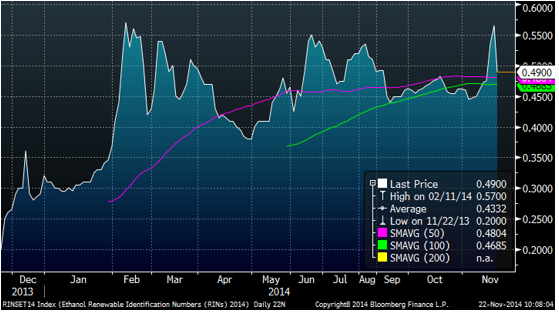
Renewable Identification Numbers (RINs) är ett slags certifikat man erhåller när man blandar en gallon av etanol i bensin. RINs kan sedan handlas som ett värdepapper, ungefär som en utsläppsrätt i EU. Priset på RINs har stigit i november, men föll ganska kraftigt i fredags från 0.57 dollar per gallon till 0.49 dollar. Prisfallet är sannolikt ett svar på den höga produktionen av etanol och farhågor om stödets vare eller inte vara.
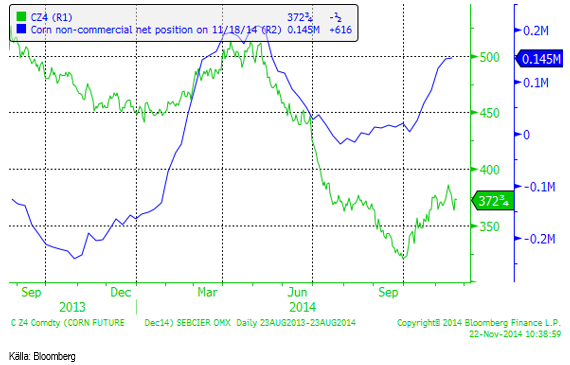
Non-commercials var efter den senaste tidens lite ”sidledes” rörelse i priset på majs lite mindre på köpsidan. De är nu nettoköpta med 145,000 kontrakt och det är bara lite mer än förra veckan.
El Niño i antågande, som ger en boost åt nederbörden i Sydamerika och goda förutsättningar för odling på norra halvklotet i vår och spekulanter som redan är tämligen köpta redan gör det svårt att se positivt på prisutvecklingen. Vi fortsätter med neutral rekommendation.
Sojabönor
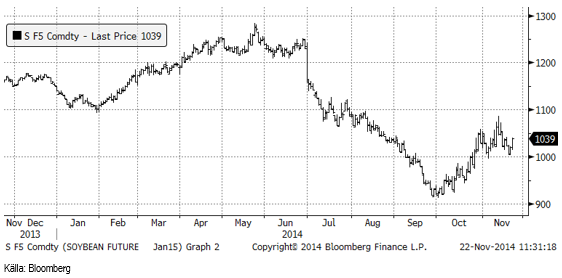
Sojabönorna (SF5) steg med 2% medan både sojamjöl och sojaolja steg med 1%. Crushers har alltså fått ännu bättre villkor sedan förra veckan. Januarikontraktet på sojabönor backade initialt under veckan, men fann stöd på 1000 cent och rekylerade upp till 1039 i fredags. Marknaden stängde på dagshögsta.
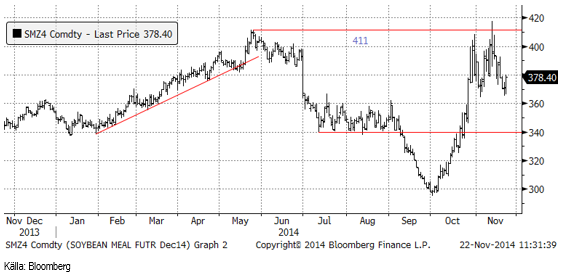
Sojamjölet utvecklades svagare än sojabönorna. Konsolideringsfasen som skett under hög volatilitet sedan slutet av oktober på mellan 370 och 420 dollar är ännu inte över. Det är oklart ur teknisk synvinkel om konsolideringen är en paus inför vidare prisuppgång eller en toppformation som följs av prisfall.
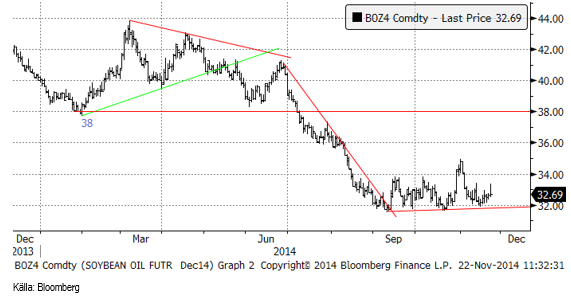
Sojaoljan ligger fortfarande i konsolidering strax över 32 cent per pund.
Skörden av sojabönor i USA avancerade från 90% skördat till 94%. Därmed är skörden nästan klar.
Amerikansk export av sojabönor var låg, men försäljningen av mjöl hög.
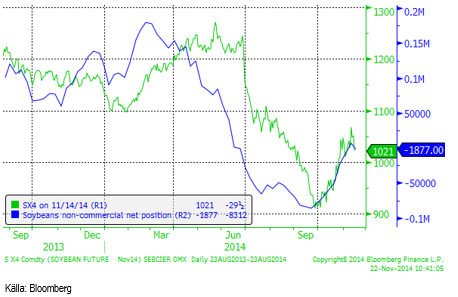
Non-commmercials sålde, som vi förutspådde förra veckan eftersom priset gått ner, drygt 8000 terminskontrakt på sojabönor och är därmed återigen nettosålda, men inte med mycket. Antagligen kommer rapporten på fredag, som visar ställnigen på tisdag, att visa att de köpt, eftersom priset gått upp sedan i tisdags.
Vi tror att det återigen ganska höga priset kan attrahera ytterligare areal i Brasilien. Crushers bör utnyttja tillfället att köpa sojabönsterminer och sälja terminer på mjöl och olja det kan sätta press på dessa två specifikt.
Raps
Februarikontraktet på rapsfrö steg med 1%, medan de längre kontrakten var oförändrade i pris sedan förra veckan. Motståndet på 350 euro begränsar uppsidan. Stöd finns vid 330. Det verkar finnas starka säljintressen, eftersom varje försök att handla upp priset stöter på säljare som snabbt trycker tillbaka priset.
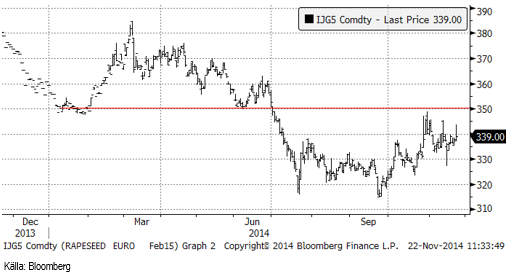
Vi fortsätter med neutral rekommendation på raps.
Potatis
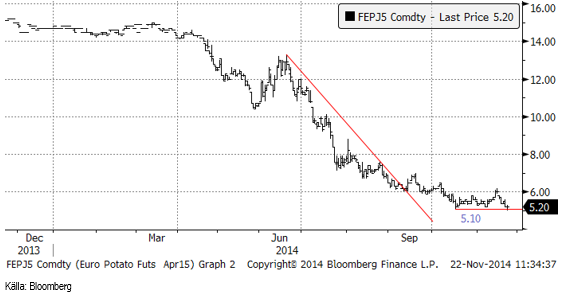
Potatisterminen sjönk med 13% (april). Priset var temporärt nere vid det tekniska stödet på 5.10 euro per 100 Kg, men stängde i fredags över den nivån på 5.20. Frågan är nu om 5.10 kommer att brytas eller hålla. Stödet har testats och hållit tre gånger de senaste två månaderna. Bryts nivån öppnar det för ytterligare prisfall, som kan bli stora i procent räknat. Om stödet håller, kan en uppgång till 6 euro ske, och till 8 euro som högst, enligt den tekniska analysen.
Gris
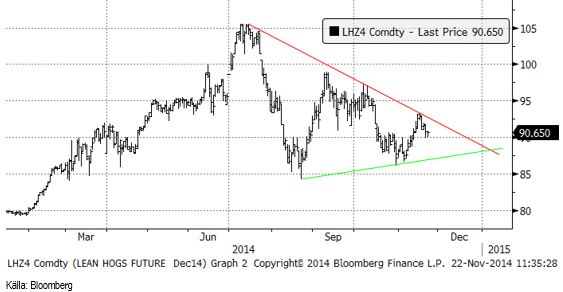
Lean hogs aprilkontrakt föll med 13% och decemberkontraktet med något mindre till 90.65 cent. Sedan i somras har svängningarna i priset blivit successivt mindre utan att priset trendat åt något håll. Detta brukar inte bli bestående, utan i regel följas av en ny trend, uppåt eller nedåt. Tumregeln är att invänta besked från marknaden och sedan haka på – uppåt eller nedåt. Det rimliga borde vara en ny fallande pristrend, eftersom PED-viruset är övervunnet.
Mjölk
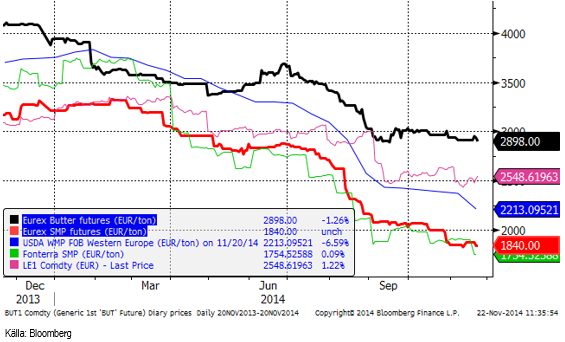
Terminerna på SMP föll med 1 till 2% i veckan, medan terminerna på smör förändrades med 0 till -1%, olika för olika löptider. Global Dairy Trade-auktionen i tisdags noterades det genomsittliga priset 3.1% lägre, i 2561 dollar. Det är den lägsta noteringen sedan den 4 augusti 2009. Delvis är det en funktion av en superstark US-Dollar, men också förstås en tillika svag mjölkmarknad. På auktionen sjönk WMP med 5.1%, SMP med 5.7%, medan priset på smör steg med 6% och priset på cheddar steg med 5%. Vi kan se med blotta ögat att pristrenden fortfarande är fallande för såväl smör som SMP på EUREX.
EUREX senaste index för spotpriset på smör och SMP ger med aktuell växelkurs ett produkt-värde på mjölkråvara på 2.93 kr / Kg. Den sista oktober var priset 2.99 kr / Kg. Priset har alltså sjunkit med nästan 2% på tre veckor. Ett mejeri kan inte rimligen köpa in råvaran för över tre kronor kilot, tillverka smör och SMP och sälja dessa produkter för 2.93 Kr någon längre tid. Ytterligare sänkning av avräkningspris borde vara att vänta.
Socker
Regn i Brasilien tynger marknaden och i Uttar Pradesh i Indien börjar sockerindustrin att processa skörden av sockerrör mot slutet av månaden. Tekniskt rör sig priset inom en nedåtriktad triangelformation. Eftersom den är nedåtriktad är sannolikheten större för en prisuppgång än en nedgång när väl ett brott av triangelns ovansida eller undersida sker. Marknaden testar just nu den övre sidan och det skulle inte förvåna om det blev ett utbrott uppåt.
På lite spekulation går vi därför över till köprekommendation.
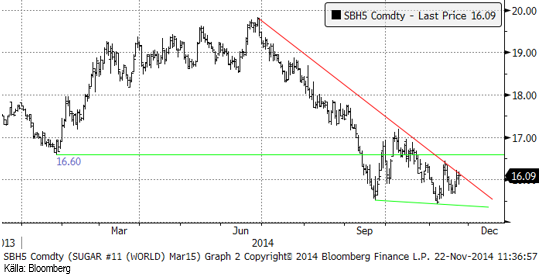
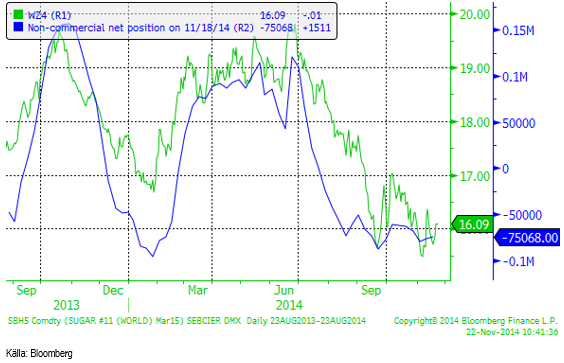
Non-commercials köpte 1500 kontrakt med är fortfarande maximalt sålda med 75,000 kontrakt.
Gödsel
Man hör ibland från politiskt håll att fosfor kommer att ta slut. Det finns ingen grund för det påståendet. Det finns ingen ”ändlig” råvara som konsumeras mindre av idag än för exempelvis 50 år sedan, undantaget asbest och kvicksilver. Att konsumtionen av dessa gått ner beror inte på att de tagit slut, utan på att intresset att använda dem minskat.
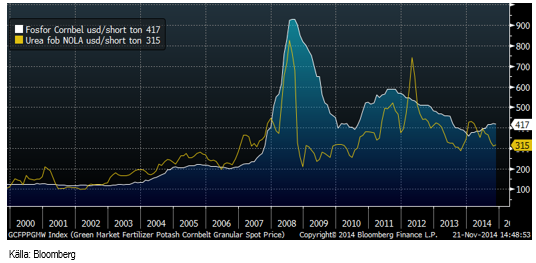
Nedan ser vi prisutvecklingen sedan år 2000 på fosfor i dollar per short ton i ’corn belt’ i USA och urea FOB New Orleans (NOLA), också i dollar per short ton. Prisutvecklingen är snarlik. Fosforpriset påverkas av att det tidigare har funnits en kartell, liknande OPEC för olja. Nu har kartellen övergått i ett oligopol. Substitut finns. Under andra världskriget utvanns den fosfor som finns i svensk järnmalm, vilket idag är något för dyrt i jämförelse med de rikare fyndigheter som finns på andra håll. Vi kan dock se att prisutvecklingen ganska väl följer prisutvecklingen på spannmål.
Kaffe
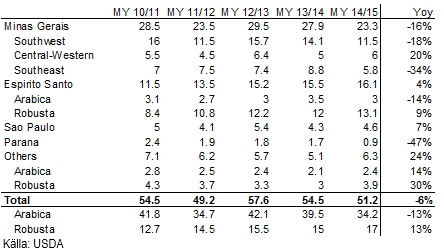
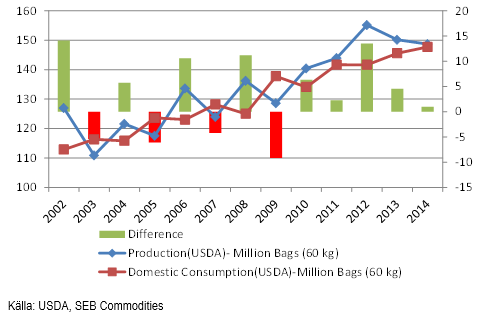
USDA publicerade en GAIN-rapport i veckan. De justerar upp prognosen för Brasiliens produktion av kaffe 2014/15 (i somras) till 51.2 miljoner säckar. Det är endast 6% lägre än förra året, enligt USDA:s siffor. CONAB estimerade i september skörden till 45.14 miljoner säckar. Även det var en uppjustering från CONAB:s estimat i maj. Nedan ser vi USDA:s senaste estimat för Brasiliens produktion för de senaste marknadsföringsåren (Marketing Year).
Nedan ser vi USDA:s estimat för global produktion och konsumtion av kaffe med skalan på västra axeln i miljoner säckar. Stapeldiagrammet visar överskott och underskott per år och skalan visas på högra y-axeln. Vi ser att inte ens i år blir det ett underskott, utan ett överskott på 0.96 miljoner säckar. De senaste åren har det producerats mer kaffe än vad som konsumerats, vilket pressade ner priset för en botten för ett år sedan. Torka har sedan drivit upp priset och gett respit för producenterna. I år skulle ha varit ett ”bra” år för odlarna i Brasilien, där arabican är en typisk ”vartannatsårs-gröda”. Nästa år kommer att vara ett sämre år enligt den cykeln, vilket gör att det ändå finns viss oro för utbudet det kommande året.
F.O. Licht rapporterade i torsdags att de tror att skörden av robusta i Vietnam bir 25.5 miljoner säckar för året som där börjar den 1 oktober 2014 och löper till den sista september 2015. Skörden börjar i oktober i Vietnam, till skillnad från Brasilien, där skörden börjar i april. Produktionen väntas bli 300,000 säckar mindre än 2013/14 när den uppgick till 25.8 miljoner säckar. Orsaken till den lägre produktionen är inte tillfällig, som i Brasilien, utan det finns en trend där avkastningen blir lägre pga åldrande träd.
F.O. Licht skriver också att de väntar sig att global produktion blir 145.7 miljoner säckar, medan konsumtionen blir 146 miljoner. Detta är i linje med vad man kunnat förstå tidigare under året efter nedjusteringen av Brasiliens skörd efter torkan i våras.
Det kom också rapporter om robustan i Vietnam har små bönor i år. Det kan också ha bidragit till prisuppgången i veckan.
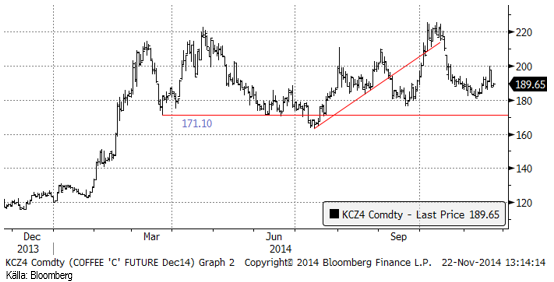
Efter USDA-rapporten föll marknaden och prisuppgången räckte inte för att ta marknaden över 200 cent igen. Uppenbarligen finns många som tycker att 200 cent är ett bra pris att sälja på.
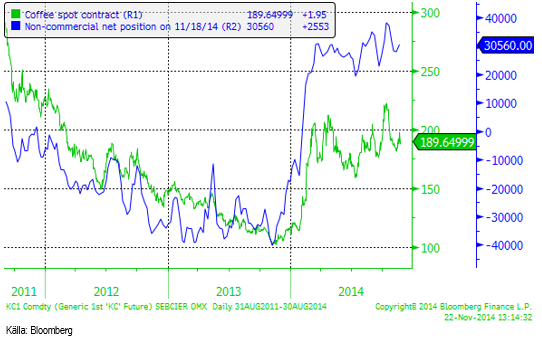
Som vi ser i nedanstående diagram är non-commercials köpte 2500 kontrakt från förra veckan. COT-rapporten avläses på tisdagskvällar och i tisdags hade marknaden stigit, vilket förklarar varför non-commercials köpte. Om priset fortsätter ner kommer vi att se att non-commercials har sålt igen.
Troligen får vi återigen en vecka med ”sidledes” prisrörelse. Det finns analytiker, framstående sådana, som tror att priset kommer att gå upp kraftigt. Jag är inte alls lika säker. Dels är den ekonomiska tillväxten svagare i världen och dels regnar det mer än normalt i Sydamerika. Får vi dessutom ett El Niño är haussen historia och sannolikheten för det är ganska hög.
Kakao
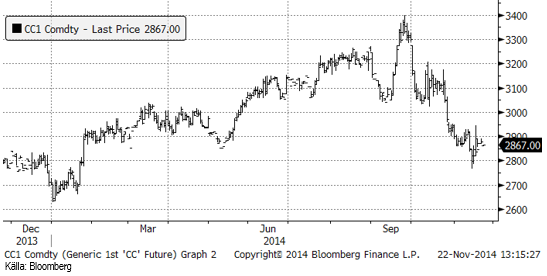
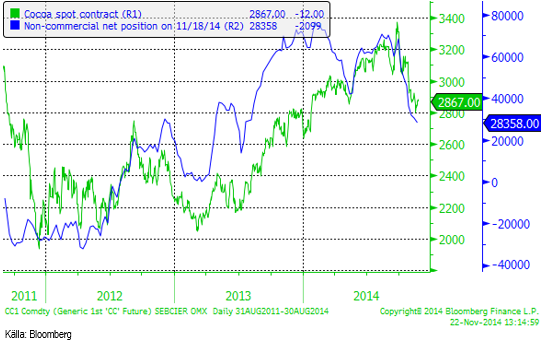
Kakaopriset gick upp från 2847 till 2867 i fredags, avseende spotkontraktet på ICE i New York.
ICCO sa i fredags att ”As far as the ICCO’s current projections are concerned, there is no immediate cause for concern about the supply of cocoa for the next five years”. De sa också att medan deras prognoser visar att underskott förmodligen kommer att uppstå, finns tillräckliga lager för att buffra dessa till dess produktionstakten ökar.
Non-commercials fortsätter sälja av terminer på kakao, förra veckan med 2100 kontrakt.
[box]SEB Veckobrev Jordbruksprodukter är producerat av SEB Commodities Sales desk och publiceras i samarbete och med tillstånd på Råvarumarknaden.se[/box]
Detta marknadsföringsmaterial, framtaget av SEB’s Commodities Sales desk, har upprättats enbart i informationssyfte.
Även om innehållet är baserat på källor som SEB bedömt som tillförlitliga ansvarar SEB inte för fel eller brister i informationen. Den utgör inte oberoende, objektiv investeringsanalys och skyddas därför inte av de bestämmelser som SEB har infört för att förebygga potentiella intressekonflikter. Yttranden från SEB’s Commodities Sales desk kan vara oförenliga med tidigare publicerat material från SEB, då den senare hänvisas uppmanas du att läsa den fullständiga rapporten innan någon åtgärd vidtas.
Dokumentationen utgör inte någon investeringsrådgivning och tillhandahålls till dig utan hänsyn till dina investeringsmål. Du uppmanas att självständigt bedöma och komplettera uppgifterna i denna dokumentation och att basera dina investeringsbeslut på material som bedöms erforderligt. Alla framåtblickande uttalanden, åsikter och förväntningar är föremål för risker, osäkerheter och andra faktorer och kan orsaka att det faktiska resultatet avviker väsentligt från det förväntade. Historisk avkastning är ingen garanti för framtida resultat. Detta dokument utgör inte ett erbjudande att teckna några värdepapper eller andra finansiella instrument. SEB svarar inte för förlust eller skada – direkt eller indirekt, eller av vad slag det vara må – som kan uppkomma till följd av användandet av detta material eller dess innehåll.
Observera att det kan förekomma att SEB, dess ledamöter, dess anställda eller dess moder- och/eller dotterbolag vid olika tillfällen innehar, har innehaft eller kommer att inneha aktier, positioner, rådgivningsuppdrag i samband med corporate finance-transaktioner, investment- eller merchantbankinguppdrag och/eller lån i de bolag/finansiella instrument som nämns i materialet.
Materialet är avsett för mottagaren, all spridning, distribuering mångfaldigande eller annan användning av detta meddelande får inte ske utan SEB:s medgivande. Oaktat detta får SEB tillåta omfördelning av materialet till utvald tredje part i enlighet med gällande avtal. Materialet får inte spridas till fysiska eller juridiska personer som är medborgare eller har hemvist i ett land där sådan spridning är otillåten enligt tillämplig lag eller annan bestämmelse.
Skandinaviska Enskilda Banken AB (publ) är ett [publikt] aktiebolag och står under tillsyn av Finansinspektionen samt de lokala finansiella tillsynsmyndigheter i varje jurisdiktionen där SEB har filial eller dotterbolag.

Selling down on a ”deal”. Brent crude fell 6.2% last week with accelerated weakness towards the end of the week. Close of the week at $87.33/b and low of the week (and on Friday) of $85.8/b. Brent is falling another 4% this morning to $83.7/b on confirmation by Iran that a MoU text has been reached and that it will be signed on Friday this week.

So what is this ”deal” worth? Talk on the desk here this morning is that it is much like ”putting lipstick on a pig” where Trump has to sell this at home as a victory where ”the SoH has reopened”, the nuclear issue will be ironed out over the coming 60 days (or maybe 600 days?) and US consumers are getting a lower gasoline price and maybe US republicans survives the midterm elections.
The importance for Iran is that it emerges as the defacto winner of this war in the eyes of the non-US public world. That Iran now onwards is the ”ruler of the SoH” (combo of geography and new weapons systems like drones) or more softer: ”the guarantor of safe passage through the SoH”.
Iran doesn’t need nuclear weapons any more. Nuclear deterrence doesn’t work any more. Ukraine has made many attacks deep into Russia without being nuked in return. Plenty of Iranian ballistic rockets blasts over Israel but Iran wasn’t nuked in return.
There is no trust between the US and Iran. We don’t know all the details yet of the MoU. But what we do know is that there is no trust between the US and Iran what so ever. This is probably more like a descriptive text on how they can cooperate in a way where both sides keeps tactical leverage. Neither side makes irreversible concessions. Violations can be punished quickly. Cooperation produces immediate benefits.
This is a fragile structure. It can easily break down. There may be details which cannot be overcome. To be seen on Friday. The US has to show that it is willing put enough force behind managing and restraining Israel versus Hezbollah in Lebanon. We have seen that Netanyahu hasn’t listened all that much to Trump’s directives and wishes. This could be a major obstacle.
A gradual reopening is tactically preferable for Iran. A tactical leverage for Iran right now is that global oil stocks have been drawn down towards painful and increasingly dangerous levels with increasing risks for oil price spikes in mid-July to August. This together with US midterm elections on 3 November gives tactical leverage to Iran. Iran probably doesn’t want to fully give up on that leverage. A rapid, full reopening where global stocks are able to refill over the coming 60 days will significantly erode that leverage. If Iran reinstates a closure of the SoH after 60 days (if talks break down again), then the effect won’t be that impactful in terms of prices and the US midterm elections.
So a gradual and partial reopening where global markets gets the oil they need while they are unable to rebuild stocks could be a practical middle way for both parties. Trump can sell it as ”the SoH has reopened” and get affordable gasoline for US consumers. Iran can sell it as ”the SoH has fully reopened, but there is some friction” so flow is only 60-80% of normal.
Not much real demand destruction below $100/b. What we do know is that there is not much real price pain demand destruction for oil globally at an oil price below $100/b. A lot of demand-shock destruction. Fear. But demand should now come roaring back towards normal with fear for exceptionally high prices now is rapidly receding.
Sudden China demand destruction due to EVs? Bullocks. EV share of total Chinese carpool now around 13%. Share of new sales of EVs has reached 50%. This is a very gradual process. It doesn’t make oil demand fall like a rock over night. When EV new sales share reaches 100%, then the gasoline car pool will contract by some 5-10% per year. But that is only gasoline. Sudden reduction in Chinese oil demand is more about shock and risk.
Chinese crude oil imports will come roaring back. At what price? Today’s ”neutral” oil price is $70/b. That is the five year price which has steadily traded around the $70/b mark over the past 3-4 years. With still a risky picture one would think that China and the rest of the world will be big buyers of oil in the range of $70-85/b.
Global demand will likely snap back towards normal, forecasted demand and growth at such prices.
Physical reopening is a gradual process. The physical and practical reopening of the SoH will likely be gradual rather than sudden. And that probably suites Iran tactically as well.
Brent M1 price versus the Brent 5-yr (today’s ”normal” price)

Market is starting to take US/Iran headlines with a pinch of salt. Brent crude rose $2.8/b yesterday to an official close of $112.1/b. But after that it traded as low as $108.05/b before ending late night at around $109.7/b. Through the day it traded in a range of $106.87 – 112.72/b amid a flurry of news or rumors from Iran and the US. ”US temporary sanctions during negotiations” (falls alarm). ”We will bomb Iran” (not anyhow),… etc. While the market is still fluctuating to this kind of news flow, it is starting to take such headlines with a pinch of salt.
We’ll see. Maybe, maybe not. The Brent M1 contract is trading at $110.2/b this morning which very close to the average ticks through yesterday of $110.4/b.
Trump with bearish, verbal intervention whenever Brent trades above $110/b it seems. What seems to be a pattern is that Trump states something like ”very good negotiations going on with Iran”, ”New leaders in Iran are great,..”, ”Great progress in negotiations,…”, ”Deal in sight,..” etc whenever the Brent M1 contract trades above $110/b. An effort to cool the market. These hot air verbal interventions from Trump used to have a heavy bearish impact on prices, but they now seems to have less and less effect unless they are backed by reality.
As far as we can see there has been no real progress in the negotiations between the US and Iran with both sides still standing by their previous demands.
Iran is getting stronger while the cease fire lasts making a return to war for Trump yet harder. Iran is naturally in constant preparation for a return to war given Trump’s steady threats of bombing Iran again. Iran is naturally doing what ever is possible to prepare for a return to war. And every day the cease fire lasts it is better prepared. This naturally makes it more and more difficult and dangerous for the US to return to warring activity versus Iran as the consequences for energy infrastructure in the Persian Gulf will be more and more severe the longer the cease fire lasts. Israel seems to see it this way as well. That the war is not won and that current frozen state of a cease fire gives Iran opportunity to rebuild military and politically.
Global inventories are drawing down day by day. How much? In the meantime the Strait of Hormuz stays closed. There is varying measures and estimates of how much global inventories are drawing down. Our rough estimate, back of the envelope, is that global inventories are drawing down by at least some 10 mb/d or about 300 mb/d in a balance between loss of supply versus demand destruction. Other estimates we see are a monthly draw of 250-270 mb/d. The IEA only ’measured’ a draw in global observable stocks of 117 mb in April with oil on water rising 53 mb while on shore stocks fell 170 mb. But global stocks are hard to measure with large invisible, unmeasured stocks. As such a back of the envelope approach may be better.
Oil products is what the world is consuming. Oil product prices likely to rise while product stocks fall. Strategic Petroleum Reserves (SPR) are predominantly crude oil. Discharging oil from OECD SPR stocks, a sharp reduction in Chinese crude imports and a reduction in global refinery throughput of 6-7 mb/d has helped to keep crude oil markets satisfactorily supplied. But global inventories are drawing down none the less. And oil products is really what the world is consuming. So if global refinery throughput stays subdued, then demand will eventually have to match the supply of oil products. The likely path forward this summer is a steady draw down in jet fuel, diesel and gasoline. Higher prices for these. Then, if possible, higher refinery throughput and higher usage of crude in response to very profitable refinery margins. And lastly sharper draw in crude stocks and higher prices for these. But some 6 mb/d of oil products used to be exported through the Strait of Hormuz. And it may not be so easy to ramp up refinery activity across the world to compensate. Especially as Ukraine continues to damage Russian refineries as well as Russian crude production and export facilities.
Watch oil product stocks and prices as well as Brent calendar 2027. What to watch for this summer is thus oil product inventories falling and oil product premiums to crude rising. Another measure to watch is the Brent crude 2027 contract as it rises steadily day by day as the Strait of Hormuz stays closed and global oil inventories decline. The latter is close to the highest level since the start of the war and keeps rising.
The Brent M1 contract and the Brent 2027 prices and current price of jet fuel in Europe (ARA). All in USD/b

Our back of the envelope calculation of the global shortage created by the closure of the Strait of Hormuz. Note that 3.5 mb/d of discharge from SPR is also a draw. Note also that ’Forced demand loss’ of 2.5 mb/d is probably temporary and will fall back towards zero as logistics are sorted out leaving ’Price demand loss’ to do the job of balancing the market. Thus a shortfall of at least 9 mb/d created by the closure. More if SPR discharge is included and more if Forced demand loss recedes.

Brent is climbing higher. Front-month is at USD 106.3/bl this morning, close to a weekly high and a USD 9/bl jump from Mondays open. This is the move we flagged as a risk earlier in the week: the market shifting from ”a deal is around the corner” to ”this is going to take longer than we thought”.

Analyst Commodities, SEB
During April, rest-of-year Brent remained remarkably stable around USD 90/bl. A stability which rested on one single assumption: the SoH reopens around 1 May. That assumption is now slowly falling apart.
As we highlighted yesterday: every week of delay beyond 1 May adds (theoretically) ish USD 5/bl to the rest-of-year average, as global inventories draw 100 million barrels per week. i.e., a mid-May reopening implies rest-of-year Brent closer to USD 100/bl, and anything pushing into June or July takes us meaningfully higher.
What’s changed in the last 48 hours:
#1: The US military has formally warned that clearing suspected sea mines from SoH could take up to six months. That is a completely different timescale from what the financial market is pricing. Even a political deal tomorrow does not immediately reopen the strait.
#2: Trump has shifted his tone from urgency to ”strategic patience”. In yesterday’s press conference: ”Don’t rush me… I want a great deal.” The market is reading this as a president no longer feeling pressured by timelines, with the naval blockade running in the background.
#3: So far, the military activity is escalating, not de-escalating. Axios reports Iran is laying more mines in SoH. The US 3rd carrier strike group (USS George H.W. Bush) is arriving with two countermine vessels. Trump yesterday ordered the US Navy to destroy any Iranian boats caught laying mines. While CNN reports that the Pentagon is actively drawing up plans to strike Iranian SoH capabilities and individual Iranian military leaders if the ceasefire collapses. i.e., NOT a attitude consistent with an imminent deal!
Spot crude and product prices eased off the early-April highs on a combination of system rerouting and deal optimism. Both now weakening. Goldman estimates April Gulf output is reduced by 14.5 mbl/d, or 57% of pre-war supply, a number that keeps getting worse the longer this drags on.
Demand-side adaptation is ongoing: S. Korea has cut its Middle East crude dependence from 69% to 56% by pulling more from the Americas and Africa, and Japan is kicking off a second round of SPR releases from 1 May. But SPRs are finite.
Ref. to the negotiations, we should not bet on speed. The current Iranian leadership is dominated by genuine hardliners willing to absorb economic pain and run the clock to extract concessions. That is not a setup for a rapid resolution. US/Israeli media briefings keep framing the delay as ”internal Iranian divisions”, the reality is more complicated and points toward weeks and months, not days.
Our point is that the complexity is large, and higher prices have only just started (given a scenario where the negotiations drag out in time). The market spent April leaning on the USD 90/bl rest-of-year assumption; that case is diminishing by the hour. If ”early May reopening” is replaced by ”June, July or later” over the next week or two, both crude and products have meaningful room to reprice higher from here. There is a high risk being short energy and betting on any immediate political resolution(!).


Vattenfalls och Industrikrafts kärnkraftsbolag Videberg Kraft har valt Rolls-Royce SMR
Selling down on a ”deal”

Sommarväder skapar prisrally på elbörsen
Oil product price pain is set to rise as the Strait of Hormuz stays closed into summer

