

Analys
SEB – Råvarukommentarer, 17 mars 2015

Pessimisterna leder och dollarn blir ännu starkare
MARKNADEN I KORTHET
 Nästan alla korta positioner gick med vinst förra veckan (fredag till fredag) eftersom i princip alla råvaror gick ned i dollartermer. Dessutom försvagades kronan med 3 procent mot US dollar. Så de som hade ett kort råvarucertifikat förra veckan tjänade pengar både som ett resultat av råvaruprisfallet men också på grund av kronkursen. Dollarindex fortsatte upp med ett starkt 2,8 procent och sänkte förstås dollardenominerade råvaror. Den enda sektorn som steg i förra veckan var basmetaller som gick upp med 0,6 procent på grund av en 2 procents prisökning i koppar. Kinesisk statistik var blandad under veckan med negativa fundamenta i industriproduktion, investeringar och detaljhandelsförsäljning i början av veckan. Detta möttes dock av kinesiska data för utlåning och penningmängd som var bättre än väntat och förbättrade sentimentet för Kina något.
Vinnare under förra veckan (mätt fredag till fredag) var de som hade en kort position i olja. Majkontraktet som våra certifikat följer för närvarande föll med nästan 9 procent, och den som investerade i certifikat noterade i kronor fick en extra skjuts av kronförsvagningen på ca 3 procent. Oljeoptimisterna som har pressat upp priset sedan slutet av januari fick vika sig förra veckan då amerikansk produktion av råolja såväl som lagren fortsatte att öka.
Den näst bästa positionen förra veckan var en kort position i kaffe, då majterminen föll drygt 7 procent i dollartermer. På tredje plats kom en kort position i socker, där majkontraktet föll med 5,5 procent. Även för kaffe och socker fick placeringar i certifikat noterade i kronor förstås en ännu bättre utveckling på grund av kronförsvagningen. Även guldpriset har fallit sedan rekommendationen av en kort position i förra veckan. Vi är fortfarande negativa till guld och ligger därför kvar med vår rekommendation.
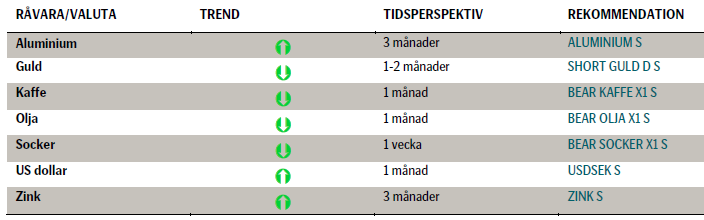
TRENDER I SAMMANDRAG
- Brentolja negativ. Optimisterna har lagt sig. Amerikansk produktion och lager fortsätter obönhörligen högre och WTI har nått nivåer under lägstanivåerna för januari, och vi måste se tillbaka ända till 2009 för att se jämförbara nivåer. WTI råolja ser ut att kunna handlas under 40 USD/fat och kommer dra med Brentoljan ned under 50 USD/fat (jämfört med nuvarande dryga 53 USD/fat).
- Kaffe ser fortfarande svagt ut både fundamentalt och tekniskt även om vi såg en rekyl uppåt den 16 mars då priset steg med 6,7 procent på grund av att korta positioner täcktes.
- Socker är i en ordentlig nedåttrend som vi tror kommer att hålla i sig och vi förväntar oss ännu lägre priser.
- US dollar befinner sig i ett episkt rally. Vi förväntar oss ytterligare förstärkning. Detta kommer att pressa ner priset på råvaror i dollartermer. Vi rekommenderar därför även en placering i valutacertifikat USDSEK S.
REKOMMENDATIONER
En placering i certifikat och warranter är förknippat med risker. Du kan förlora hela ditt investerade kapital. Läs mer om riskerna i SEB:s offentliggjorda Grundprospekt för certifikat- och warrantprogram på seb.se/cert eller seb.se/mini.
OLJA
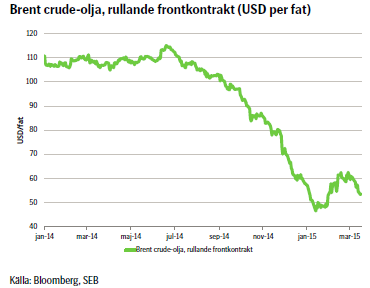 Det är kritiskt läge för WTI den närmaste månaden medan amerikansk råoljeproduktion och råoljelager fortsätter att växa. ”Oljeoptimisterna” lyckades trycka både Brentoljan och WTI in i ett rally som började i slutet av januari. Detta rally är nu över. Fundamenta har tagit över och pressar priset nedåt igen. De som har trott på en uppgång viker sig nu och tar sina förluster och WTI är nere på nya lägstanivåer för året (42,85 USD/fat) – priser som inte har setts sedan 2009. Under de närmaste veckorna och månaderna kommer WTI antagligen att handla under 40 USD/fat och Brentoljan kommer att dras med ner till under 50 USD/fat (handlas för närvarande runt 53,50 USD/fat). Vi är nu mitt i den svagaste delen av året. Raffinaderier kommer att i ökad utsträckning stänga för underhåll i Europa och Asien och detta kommer att leda till minskad efterfrågan på olja utanför USA. Detta skapar ofta en prismässig svaghet för Brentoljan.
Vi är negativa till oljepriset för närvarande. Det kommer en vändning på sikt, men vi är inte där ännu.
TREND
- Det är kritiskt läge för WTI och Brentoljan dras med ned
- Lägre efterfrågan på råolja från raffinaderier i Europa och Asien i april och maj på grund av underhållsarbete
- OPEC fortsätter att producera 30,2 miljoner fat per dag, vilket är över ”taket” och över behovet. Behovet av OPEC olja under andra kvartalet 2015 är bara 28,5 miljoner fat per dag
- Vi tror att Brentoljan kommer att handlas under 50 USD/fat i närtid.
REKOMMENDATION
- BEAR OLJA X1 S
KAFFE
Utvecklingen i kaffepriset är intressant; inte minst på grund av sin stora rörelse under 2014. Låt oss därför se litet närmare på priset för Arabica-kaffe: Mellan 2011 och 2014 såg vi en klar och tydlig nedåtgående trend vad gäller terminpriset, men det fick ett abrupt slut på grund av kraftig torka i Brasilien samt svampangrepp på plantor i Centralamerika. Efter att det regnade i områden med just kaffeproduktion hämtade sig skörden, åtminstone delvis och priset har fallit sedan slutet av 2014. Bara sedan årsskiftet har det fallit drygt 20 procent och med hela 40 procent sedan den högsta noteringen under 2014. Över förra veckan (fredag till fredag) är samma notering drygt -7 procent. De brasilianska skördarna överraskat på uppsidan efter torkan, även om vissa bedömare tror att det blir ett bortfall motsvarande ungefär 1,5 procent av världens totala kaffeproduktion. Sammantaget ser vi nu en kraftig korrektion nedåt på priset mot den trend vi såg innan torkan i Brasilien.
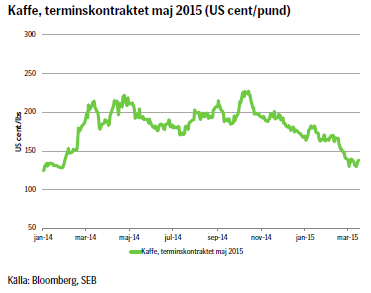 Finansiellt har de långa nettopositionerna minskat kraftigt och terminskurvan har skiftat inåt över det senaste året. Den brasilianska realen har försvagats tämligen kraftigt mot dollarn och det finns en stark korrelation mellan den svagare valutan och ett lägre kaffepris. Förklaringen är att bönder i Brasilien har fått relativt bättre betalt, sålt mer, exporten har ökat och det har blivit press nedåt på priset.
Även tekniskt ser vi ett fortsatt nedåttryck och för att bryta detta behöver priset stiga ända till 162,15 US cent per pund. Sedan förra veckan har säljtrycket mattats något, men det underliggande vågmönstret gör att vi tror att det kommer att fortsätta, med nästa stöd nedåt vid 119,02 US dollar per pund.
TREND
- Fundamentala faktorer talar för press nedåt på priset
- Tekniska faktorer talar också för ett fall mot stödet 119,02 US cent per pund
- Vi tror att kaffepriset kommer röra sig nedåt på kort sikt.
REKOMMENDATION
- BEAR KAFFE X5 S
SOCKER
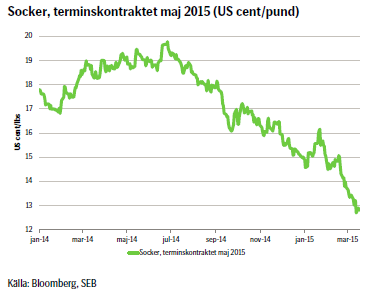 Vår vy om en kort position i socker har gett oss fortsatt utdelning. Under fredagens handel föll priset på ICE med nästan 4 procent för att notera den lägsta nivån på 6 år. Samtidigt så fick topp producenten Brasilien se sin valuta real sjunka till den lägsta nivån mot dollarn på 12 år under veckans sista handelsdag. Det brasilianska konsultföretaget AgroConsult justerar upp sin prognos för produktionen av sockerrör 2015/16 med 20 miljoner ton till 620 miljoner ton i regionen Centrum Syd, som står för 90 procent av landets produktion.
TREND
- Så länge priset inte bryter igenom det tekniska motståndet på 13,21 US cent så fortsätter vi med en kort position och håller ett öga på om marknaden kan hitta en stödnivå ner mot 12 US cent.
REKOMMENDATION
- BEAR SOCKER X 1 S
BASMETALLER – ALUMINIUM & ZINK
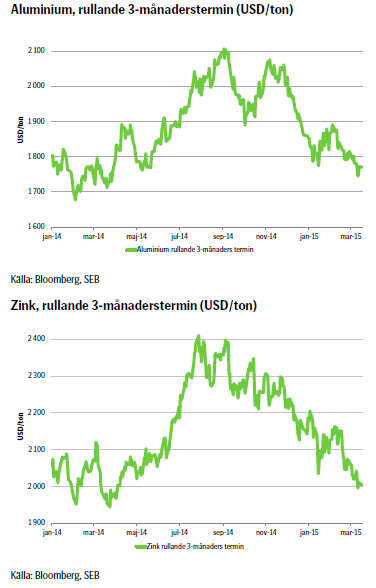 Fokus under veckan har legat på den fortsatt starka dollarn. Den starka arbetsmarknadsstatistiken veckan före i kombination med de påbörjade obligationsköpen i Europa har pressat EUR/SEK kontinuerligt ned mot 1,05. Den negativa korrelationen mot de dollarnoterade metallerna gör sig gällande. Intressant att notera den senaste veckan att priserna håller emot bättre. Räknat i Euro och SEK är priserna på relativt höga nivåer. Till exempel zink handlas på den högsta nivån sedan maj 2010. I veckan som gick är uppgången ca 2,5 procent för zink och aluminium som vi har bevakat de senaste veckorna. Priserna har dock fallit tillbaka räknat i den noterade valutan USD. Vi bedömer dock att nedgången inte riktigt speglar den fundamentala situationen fullt ut. En stabilisering av dollar skulle enligt vår mening lätta på trycket och sannolikt stärka priserna ytterligare. Vi kvarstår med tidigare bedömning om en starkare prisbild under andra kvartalet 2015.
TREND
- I takt med att den fundamentala balansen förbättras bedöms priserna på aluminium och zink succesivt stärkas under året.
- Flera gruvstängningar i år och nästa, kommer inte fullt ut att ersättas. Risk för brist 2016 (zink).
- Efterfrågan på aluminium har ökat 4-7 % den senaste 3-4 åren, en trend som förväntas fortsätta.
REKOMMENDATION
- ALUMINIUM S och ZINK S
[box]SEB Veckobrev Veckans råvarukommentar är producerat av SEB:s Commodities Sales desk och publiceras i samarbete och med tillstånd på Råvarumarknaden.se[/box]
KÄLLOR
Bloomberg, Reuters, SEB
VILLKOR
För varje enskilt certifikat/mini future finns Slutliga Villkor som anger de fullständiga villkoren. Slutliga Villkor finns tillgängligt på kurssidan för respektive certifikat/mini future på www.seb.se, Börs & finans, fliken Strukturerade placeringar.
RISKER
En sammanfattning av de risker som är förknippade med Börshandlade certifikat generellt finns i Produktbroschyren för respektive certifikat eller mini future som är tillgängligt på seb.se/cert respektive seb.se/mini. För en fullständig bild av riskerna behöver du ta del av SEB:s offentliggjorda Grundprospekt för Certifikat- och Warrantprogram som är publicerat på www.seb.se/cert respektive seb.se/mini.
DISCLAIMER
Detta marknadsföringsmaterial, framtaget av SEB:s Commodities Sales desk, har upprättats enbart i informationssyfte.
Även om innehållet är baserat på källor som SEB bedömt som tillförlitliga ansvarar SEB inte för fel eller brister i informationen. Den utgör inte oberoende, objektiv investeringsanalys och skyddas därför inte av de bestämmelser som SEB har infört för att förebygga potentiella intressekonflikter. Yttranden från SEB:s Commodities Sales desk kan vara oförenliga med tidigare publicerat material från SEB, då den senare hänvisas uppmanas du att läsa den fullständiga rapporten innan någon åtgärd vidtas.
Dokumentationen utgör inte någon investeringsrådgivning och tillhandahålls till dig utan hänsyn till dina investeringsmål. Du uppmanas att självständigt bedöma och komplettera uppgifterna i denna dokumentation och att basera dina investeringsbeslut på material som bedöms erforderligt. Alla framåtblickande uttalanden, åsikter och förväntningar är föremål för risker, osäkerheter och andra faktorer och kan orsaka att det faktiska resultatet avviker väsentligt från det förväntade. Historisk avkastning är ingen garanti för framtida resultat. Detta dokument utgör inte ett erbjudande att teckna några värdepapper eller andra finansiella instrument. SEB svarar inte för förlust eller skada – direkt eller indirekt, eller av vad slag det vara må – som kan uppkomma till följd av användandet av detta material eller dess innehåll.
Observera att det kan förekomma att SEB, dess ledamöter, dess anställda eller dess moder- och/eller dotterbolag vid olika tillfällen innehar, har innehaft eller kommer att inneha aktier, positioner, rådgivningsuppdrag i samband med corporate finance-transaktioner, investment- eller merchantbanking-uppdrag och/eller lån i de bolag/finansiella instrument som nämns i materialet.
Materialet är avsett för mottagaren, all spridning, distribuering mångfaldigande eller annan användning av detta meddelande får inte ske utan SEB:s medgivande. Materialet riktar sig inte till personer vars medverkan kräver ytterligare prospekt, registrerings- eller andra åtgärder än vad som följer av svensk rätt. Det åligger var och en att iaktta sådana restriktioner. Materialet får inte distribueras i eller till land där distribution kräver ovan nämnda åtgärder eller strider mot reglering i sådant land. Materialet riktar sig således inte till fysiska eller juridiska personer hemmahörande i USA eller i något annat land där publicering eller tillhandahållande av materialet är förbjudet eller strider mot tillämpliga bestämmelser i landet.
Oaktat detta får SEB tillåta omfördelning av materialet till utvald tredje part i enlighet med gällande avtal. Materialet får inte spridas till fysiska eller juridiska personer som är medborgare eller har hemvist i ett land där sådan spridning är otillåten enligt tillämplig lag eller annan bestämmelse.
Skandinaviska Enskilda Banken AB (publ) är ett publikt aktiebolag och står under tillsyn av Finansinspektionen samt de lokala finansiella tillsynsmyndigheter i varje jurisdiktionen där SEB har filial eller dotterbolag.

Selling down on a ”deal”. Brent crude fell 6.2% last week with accelerated weakness towards the end of the week. Close of the week at $87.33/b and low of the week (and on Friday) of $85.8/b. Brent is falling another 4% this morning to $83.7/b on confirmation by Iran that a MoU text has been reached and that it will be signed on Friday this week.

So what is this ”deal” worth? Talk on the desk here this morning is that it is much like ”putting lipstick on a pig” where Trump has to sell this at home as a victory where ”the SoH has reopened”, the nuclear issue will be ironed out over the coming 60 days (or maybe 600 days?) and US consumers are getting a lower gasoline price and maybe US republicans survives the midterm elections.
The importance for Iran is that it emerges as the defacto winner of this war in the eyes of the non-US public world. That Iran now onwards is the ”ruler of the SoH” (combo of geography and new weapons systems like drones) or more softer: ”the guarantor of safe passage through the SoH”.
Iran doesn’t need nuclear weapons any more. Nuclear deterrence doesn’t work any more. Ukraine has made many attacks deep into Russia without being nuked in return. Plenty of Iranian ballistic rockets blasts over Israel but Iran wasn’t nuked in return.
There is no trust between the US and Iran. We don’t know all the details yet of the MoU. But what we do know is that there is no trust between the US and Iran what so ever. This is probably more like a descriptive text on how they can cooperate in a way where both sides keeps tactical leverage. Neither side makes irreversible concessions. Violations can be punished quickly. Cooperation produces immediate benefits.
This is a fragile structure. It can easily break down. There may be details which cannot be overcome. To be seen on Friday. The US has to show that it is willing put enough force behind managing and restraining Israel versus Hezbollah in Lebanon. We have seen that Netanyahu hasn’t listened all that much to Trump’s directives and wishes. This could be a major obstacle.
A gradual reopening is tactically preferable for Iran. A tactical leverage for Iran right now is that global oil stocks have been drawn down towards painful and increasingly dangerous levels with increasing risks for oil price spikes in mid-July to August. This together with US midterm elections on 3 November gives tactical leverage to Iran. Iran probably doesn’t want to fully give up on that leverage. A rapid, full reopening where global stocks are able to refill over the coming 60 days will significantly erode that leverage. If Iran reinstates a closure of the SoH after 60 days (if talks break down again), then the effect won’t be that impactful in terms of prices and the US midterm elections.
So a gradual and partial reopening where global markets gets the oil they need while they are unable to rebuild stocks could be a practical middle way for both parties. Trump can sell it as ”the SoH has reopened” and get affordable gasoline for US consumers. Iran can sell it as ”the SoH has fully reopened, but there is some friction” so flow is only 60-80% of normal.
Not much real demand destruction below $100/b. What we do know is that there is not much real price pain demand destruction for oil globally at an oil price below $100/b. A lot of demand-shock destruction. Fear. But demand should now come roaring back towards normal with fear for exceptionally high prices now is rapidly receding.
Sudden China demand destruction due to EVs? Bullocks. EV share of total Chinese carpool now around 13%. Share of new sales of EVs has reached 50%. This is a very gradual process. It doesn’t make oil demand fall like a rock over night. When EV new sales share reaches 100%, then the gasoline car pool will contract by some 5-10% per year. But that is only gasoline. Sudden reduction in Chinese oil demand is more about shock and risk.
Chinese crude oil imports will come roaring back. At what price? Today’s ”neutral” oil price is $70/b. That is the five year price which has steadily traded around the $70/b mark over the past 3-4 years. With still a risky picture one would think that China and the rest of the world will be big buyers of oil in the range of $70-85/b.
Global demand will likely snap back towards normal, forecasted demand and growth at such prices.
Physical reopening is a gradual process. The physical and practical reopening of the SoH will likely be gradual rather than sudden. And that probably suites Iran tactically as well.
Brent M1 price versus the Brent 5-yr (today’s ”normal” price)

Market is starting to take US/Iran headlines with a pinch of salt. Brent crude rose $2.8/b yesterday to an official close of $112.1/b. But after that it traded as low as $108.05/b before ending late night at around $109.7/b. Through the day it traded in a range of $106.87 – 112.72/b amid a flurry of news or rumors from Iran and the US. ”US temporary sanctions during negotiations” (falls alarm). ”We will bomb Iran” (not anyhow),… etc. While the market is still fluctuating to this kind of news flow, it is starting to take such headlines with a pinch of salt.
We’ll see. Maybe, maybe not. The Brent M1 contract is trading at $110.2/b this morning which very close to the average ticks through yesterday of $110.4/b.
Trump with bearish, verbal intervention whenever Brent trades above $110/b it seems. What seems to be a pattern is that Trump states something like ”very good negotiations going on with Iran”, ”New leaders in Iran are great,..”, ”Great progress in negotiations,…”, ”Deal in sight,..” etc whenever the Brent M1 contract trades above $110/b. An effort to cool the market. These hot air verbal interventions from Trump used to have a heavy bearish impact on prices, but they now seems to have less and less effect unless they are backed by reality.
As far as we can see there has been no real progress in the negotiations between the US and Iran with both sides still standing by their previous demands.
Iran is getting stronger while the cease fire lasts making a return to war for Trump yet harder. Iran is naturally in constant preparation for a return to war given Trump’s steady threats of bombing Iran again. Iran is naturally doing what ever is possible to prepare for a return to war. And every day the cease fire lasts it is better prepared. This naturally makes it more and more difficult and dangerous for the US to return to warring activity versus Iran as the consequences for energy infrastructure in the Persian Gulf will be more and more severe the longer the cease fire lasts. Israel seems to see it this way as well. That the war is not won and that current frozen state of a cease fire gives Iran opportunity to rebuild military and politically.
Global inventories are drawing down day by day. How much? In the meantime the Strait of Hormuz stays closed. There is varying measures and estimates of how much global inventories are drawing down. Our rough estimate, back of the envelope, is that global inventories are drawing down by at least some 10 mb/d or about 300 mb/d in a balance between loss of supply versus demand destruction. Other estimates we see are a monthly draw of 250-270 mb/d. The IEA only ’measured’ a draw in global observable stocks of 117 mb in April with oil on water rising 53 mb while on shore stocks fell 170 mb. But global stocks are hard to measure with large invisible, unmeasured stocks. As such a back of the envelope approach may be better.
Oil products is what the world is consuming. Oil product prices likely to rise while product stocks fall. Strategic Petroleum Reserves (SPR) are predominantly crude oil. Discharging oil from OECD SPR stocks, a sharp reduction in Chinese crude imports and a reduction in global refinery throughput of 6-7 mb/d has helped to keep crude oil markets satisfactorily supplied. But global inventories are drawing down none the less. And oil products is really what the world is consuming. So if global refinery throughput stays subdued, then demand will eventually have to match the supply of oil products. The likely path forward this summer is a steady draw down in jet fuel, diesel and gasoline. Higher prices for these. Then, if possible, higher refinery throughput and higher usage of crude in response to very profitable refinery margins. And lastly sharper draw in crude stocks and higher prices for these. But some 6 mb/d of oil products used to be exported through the Strait of Hormuz. And it may not be so easy to ramp up refinery activity across the world to compensate. Especially as Ukraine continues to damage Russian refineries as well as Russian crude production and export facilities.
Watch oil product stocks and prices as well as Brent calendar 2027. What to watch for this summer is thus oil product inventories falling and oil product premiums to crude rising. Another measure to watch is the Brent crude 2027 contract as it rises steadily day by day as the Strait of Hormuz stays closed and global oil inventories decline. The latter is close to the highest level since the start of the war and keeps rising.
The Brent M1 contract and the Brent 2027 prices and current price of jet fuel in Europe (ARA). All in USD/b

Our back of the envelope calculation of the global shortage created by the closure of the Strait of Hormuz. Note that 3.5 mb/d of discharge from SPR is also a draw. Note also that ’Forced demand loss’ of 2.5 mb/d is probably temporary and will fall back towards zero as logistics are sorted out leaving ’Price demand loss’ to do the job of balancing the market. Thus a shortfall of at least 9 mb/d created by the closure. More if SPR discharge is included and more if Forced demand loss recedes.

Brent is climbing higher. Front-month is at USD 106.3/bl this morning, close to a weekly high and a USD 9/bl jump from Mondays open. This is the move we flagged as a risk earlier in the week: the market shifting from ”a deal is around the corner” to ”this is going to take longer than we thought”.

Analyst Commodities, SEB
During April, rest-of-year Brent remained remarkably stable around USD 90/bl. A stability which rested on one single assumption: the SoH reopens around 1 May. That assumption is now slowly falling apart.
As we highlighted yesterday: every week of delay beyond 1 May adds (theoretically) ish USD 5/bl to the rest-of-year average, as global inventories draw 100 million barrels per week. i.e., a mid-May reopening implies rest-of-year Brent closer to USD 100/bl, and anything pushing into June or July takes us meaningfully higher.
What’s changed in the last 48 hours:
#1: The US military has formally warned that clearing suspected sea mines from SoH could take up to six months. That is a completely different timescale from what the financial market is pricing. Even a political deal tomorrow does not immediately reopen the strait.
#2: Trump has shifted his tone from urgency to ”strategic patience”. In yesterday’s press conference: ”Don’t rush me… I want a great deal.” The market is reading this as a president no longer feeling pressured by timelines, with the naval blockade running in the background.
#3: So far, the military activity is escalating, not de-escalating. Axios reports Iran is laying more mines in SoH. The US 3rd carrier strike group (USS George H.W. Bush) is arriving with two countermine vessels. Trump yesterday ordered the US Navy to destroy any Iranian boats caught laying mines. While CNN reports that the Pentagon is actively drawing up plans to strike Iranian SoH capabilities and individual Iranian military leaders if the ceasefire collapses. i.e., NOT a attitude consistent with an imminent deal!
Spot crude and product prices eased off the early-April highs on a combination of system rerouting and deal optimism. Both now weakening. Goldman estimates April Gulf output is reduced by 14.5 mbl/d, or 57% of pre-war supply, a number that keeps getting worse the longer this drags on.
Demand-side adaptation is ongoing: S. Korea has cut its Middle East crude dependence from 69% to 56% by pulling more from the Americas and Africa, and Japan is kicking off a second round of SPR releases from 1 May. But SPRs are finite.
Ref. to the negotiations, we should not bet on speed. The current Iranian leadership is dominated by genuine hardliners willing to absorb economic pain and run the clock to extract concessions. That is not a setup for a rapid resolution. US/Israeli media briefings keep framing the delay as ”internal Iranian divisions”, the reality is more complicated and points toward weeks and months, not days.
Our point is that the complexity is large, and higher prices have only just started (given a scenario where the negotiations drag out in time). The market spent April leaning on the USD 90/bl rest-of-year assumption; that case is diminishing by the hour. If ”early May reopening” is replaced by ”June, July or later” over the next week or two, both crude and products have meaningful room to reprice higher from here. There is a high risk being short energy and betting on any immediate political resolution(!).


Vattenfalls och Industrikrafts kärnkraftsbolag Videberg Kraft har valt Rolls-Royce SMR
Selling down on a ”deal”

Sommarväder skapar prisrally på elbörsen
Oil product price pain is set to rise as the Strait of Hormuz stays closed into summer

Solkraften pressar elpriserna dagtid
Oil product price pain is set to rise as the Strait of Hormuz stays closed into summer
Sommarväder skapar prisrally på elbörsen
Vattenfalls och Industrikrafts kärnkraftsbolag Videberg Kraft har valt Rolls-Royce SMR
Selling down on a ”deal”
-
Analys4 veckor sedan
Oil product price pain is set to rise as the Strait of Hormuz stays closed into summer
-
Nyheter2 veckor sedan
Sommarväder skapar prisrally på elbörsen
-
 Nyheter2 dagar sedan
Vattenfalls och Industrikrafts kärnkraftsbolag Videberg Kraft har valt Rolls-Royce SMR
-
Analys2 dagar sedan
Selling down on a ”deal”