

Analys
SEB – Råvarukommentarer, 14 januari 2013
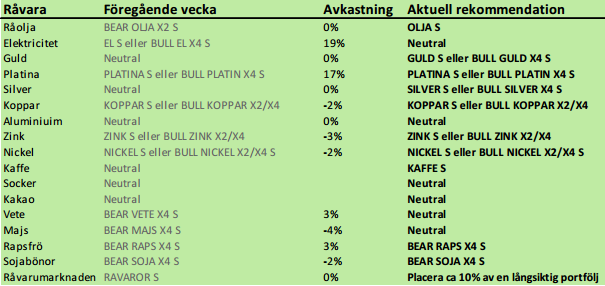
Sammanfattning av rekommendationer
Inledning
Råvaruindex var oförändrat i veckan som gick. Till vinnarna hörde platina, el, majs och kaffe. De som föll mest var utsläppsrätter för CO2 och kol (som båda används för att producera el) och zink. På grund av diskrepansen mellan elpris och kostnaden för att producera el, går vi över till neutral rekommendation på el. I fredags kväll publicerade det amerikanska jordbruksdepartementet (USDA) också sina månatliga estimat på jordbruksprodukter, samt höstsådd av vete och lager per 1 december. Efter att ha analyserat den statistiken ändrar vi också säljrekommendationerna för majs och vete till neutral rekommendation. Socker och i synnerhet kaffe ser ut att bilda en botten efter en lång tid av fallande pristrend. För kaffe går vi över till en köprekommendation av KAFFE S, men avvaktar med socker i neutralt läge.
Råolja – Brent
Priset på råolja föll kraftigt i fredags, vilket vi ser som en några dagar försenad nedgång. På den positiva sidan meddelade Saudiarabien att de sänker sin produktion med 4.9% till 9.025 miljoner fat om dagen från december för att undvika ”överproduktion” under det första halvåret i år. Det visar en påtaglig vilja att hålla priset stabilt på den här nivån.
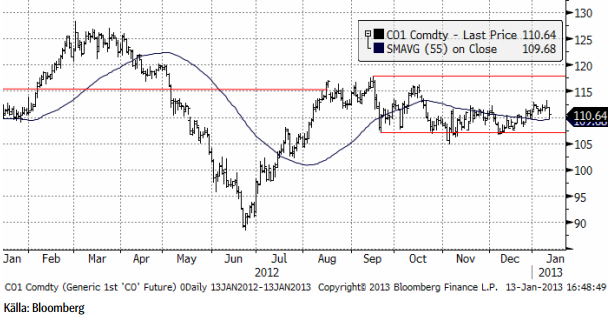
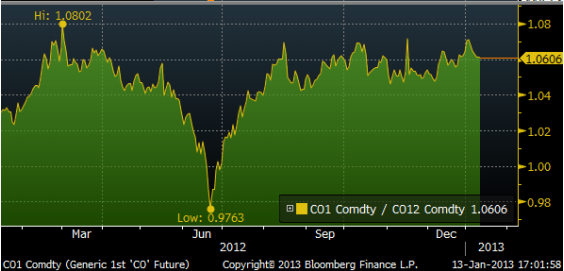
Oljemarknaden ter sig väldigt tråkig, eftersom det är näst intill inga kursrörelser. Däremot ger den en ganska attraktiv avkastning för den som bara vill äga OLJA S. I diagrammet nedan ser vi prisskillnaden mellan det 12 månader långa terminskontraktet och det kortaste (”spotkontraktet”). Den visar att den som på årsbasis äger oljeterminer tjänar 6% utöver spotprisförändringen. Det är en ganska god avkastning, även om spotpriset inte rör sig.
Den senaste veckan har skillnaden mellan 12-månaders terminskontrakt och spotkontraktet fallit. Det innebär att marknaden tycker att det blivit mindre brist på spotmarknaden, vilket rimmar illa med att Saudiarabien har strypt sin produktion.
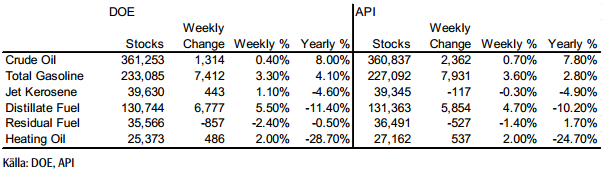
Nedan ser vi den veckovisa lagerstatistiken från USA. Den visade på en ökning av råoljelagren i linje med förväntningarna, men en ökning av bensin och destillatlagren som var större än väntat.
Sammanfattningsvis, råolja har blivit en lite tråkig marknad, men den erbjuder en stabil extraintjäning, utöver räntan (som i och för sig just nu är noll i dollar), som är attraktiv, samtidigt som man äger en råvara som har en chans att stiga om värre oro uppstår i t ex Mellanöstern. Detta brukar vara negativt för aktiemarknaden, så olja har alltid varit en bra råvara att vara investerad i. Vi rekommenderar alltså köp av OLJA S.
Elektricitet
Elpriset, som ”gappade” upp över motståndslinjen (nu stödlinjen) på 36.75 euro per MWh, har stabiliserats kring 38 euro. Det vanliga är att ”gap” fylls. Det skulle innebära att vi får se en rekyl ner mot stödlinjen. Fundamenta talar också för lägre pris. Vi rekommenderar alltså att man kortsiktigt tar hem vinster på långa positioner.
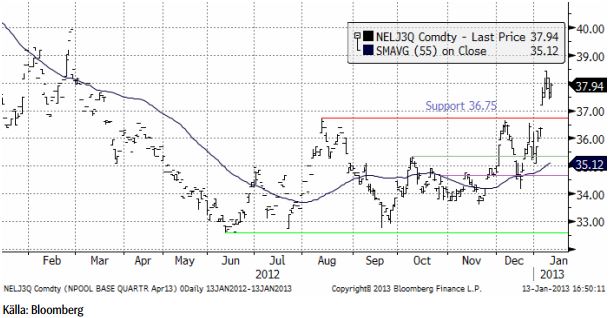
Nedan ser vi terminspriset för andra kvartalet och marginalkostnaden för att producera elektricitet med kol, i euro per MWh. På lång sikt är det marginalkostnaden för kolkraft som styr elpriset i Sverige. Vatten- och kärnkraft räcker inte till och då är det kol som styr vid den konsumtion vi ligger på idag (och konsumtionen har varit ungefär på konstant nivå de senaste åren).
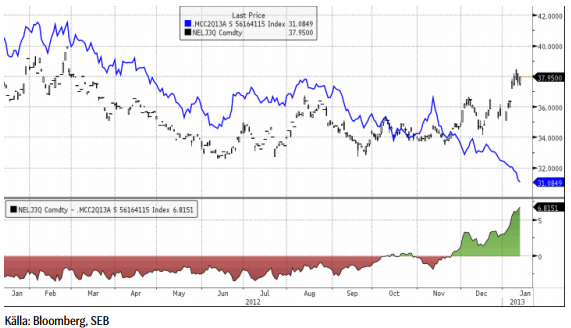
Det är naturligtvis orimligt att priset ska stiga samtidigt som kostnaden faller. Anledningen till avvikelsen kan möjligtvis finns i förändringar i den hydrologiska balansen.
Markedskraft publicerar statistik på den hydrologiska balansen för Norge och Sverige. Den anges i TWh kraft som finns lagrat i vatten som kan passera ett vattenkraftverk. I diagrammet nedan visas hur mycket mer / mindre som finns i förhållande till vad som är normalt. Och med normalt avses genomsnittet för respektive dag på året mellan 1962 och 2006. Vi ser i diagrammet att den hydrologiska balansen gått från ett överskott på ca 10 TWh till ett litet underskott. Detta har skett på bara lite drygt en månad.
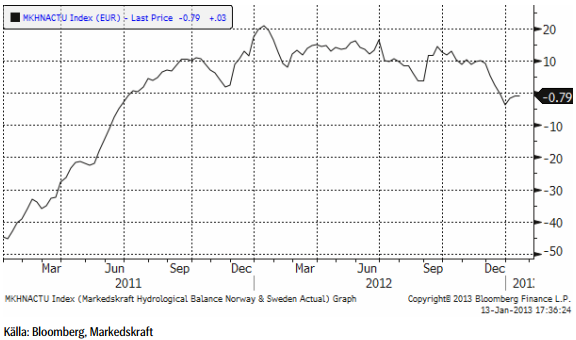
December och januari är de månader när vattenkraftverken producerar mest elektricitet, men vi kan se skillnaden på utvecklingen i år jämfört med årsskiftet mellan år 2011 och 2012, när den hydrologiska balansen ökade.
Sammantaget tror vi ändå att elpriset rusat iväg lite för fort på tekniska faktorer och att fundamenta kommer att dra ner priset igen, åtminstone på kort sikt. Vi rekommenderar därför att man går ur långa positioner.
Naturgas
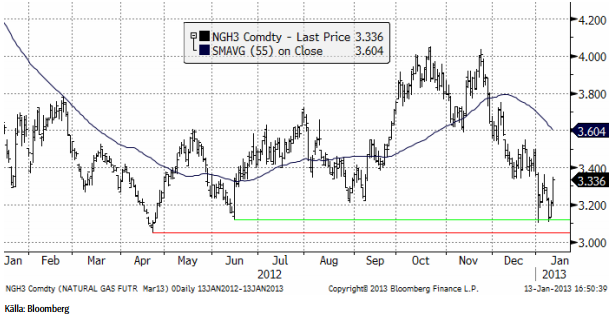
Naturgasterminen på NYMEX (mars 2013) steg med 2.6% i fredags upp från stödnivåerna vi skrev om i förra veckobrevet. Tekniskt ser marknaden ut att vilja rekylera uppåt efter att ha varit i fallande trend sedan oktober-november. Prisuppgången var en reaktion på att USA:s Energy Information Administration (EIA) rapporterade den största lagerminskningen på veckobasis sedan februari för två år sedan. Lagren minskade med 201 miljarder kubikfot, betydligt mer än väntade 191 miljarder kubikfot.
Men ovanligt varmt väder är på väg in över USA och prognosen är att det ska hänga sig kvar i veckan. Temperaturen spelar stor roll, eftersom 50% av amerikanska hem använder gas för uppvärmning. I fredags publicerade Bloomberg en sammanställning av 14 tillfrågade gasmarknadsanalytiker. Den visade att 10 av dem (71%) förutspådde lägre priser på naturgas i veckan som kommer, pga det varmare vädret. Å andra sidan var visserligen temperaturen ovanligt hög (den högsta de senaste fem åren) i Chicago i fredags, men hade i går (söndags) fallit abrupt ner till för årstiden normala nivåer igen.
Nedan ser vi ett kursdiagram på mars-kontraktet på NYMEX-börsen. Det är detta kontrakt som just nu är underliggande i BULL NATGAS X4 S och BEAR NATGAS X4 S. Vi ser att det finns starka stöd precis under dagens kursnivå. Det ger i sig ingen anledning att rekommendera köp, men man bör i vart fall inte vara köpt BEAR NATGAS X4 S, så länge stödnivåerna håller
Guld och Silver
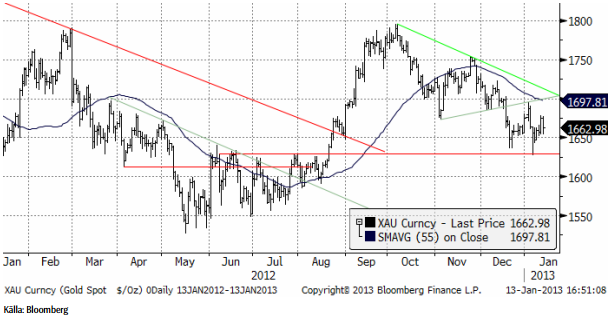
Guldpriset har fortsatt att handlas i fallande trend. Det tekniska stödet på strax över 1625 höll när det testades tidigare i år. Det talas i USA om behov av ännu mer monetär stimulans (ökning av penningmängden). Det tynger dollarn och stärker därmed guldpriset (som noteras i dollar).
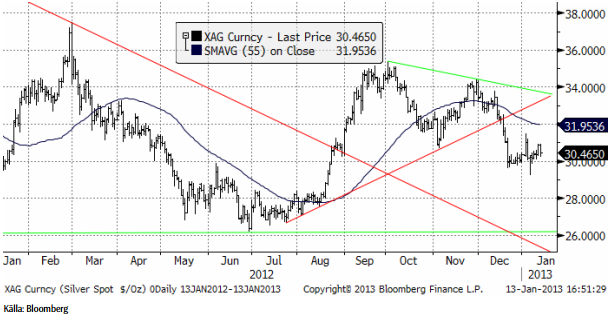
Nedan ser vi kursdiagrammet för silver i dollar per troy ounce. Situationen är snarlik den för guld. Vi tror att de senaste veckornas rekyl uppåt är just det, en rekyl. Trenden nedåt pekar mot 28 dollar per troy uns.
Platina
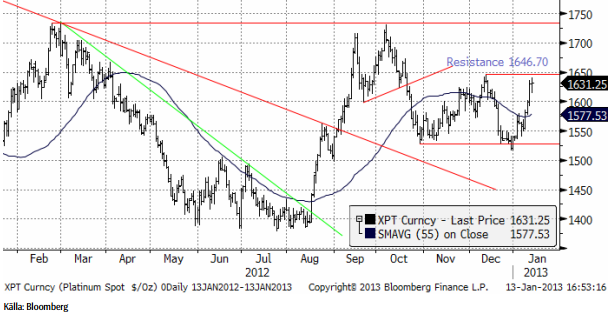
Platina, vår favorit bland de tre ädelmetallerna, har gått upp rejält i veckan som gick. Marknaden testar nu en kortsiktig motståndsnivå på 1646.70. Bryts den, är det fritt upp till 1730 dollar.
Nedan ser vi priset på platina i termer av guld, eller ”växelkursen” mellan XPT och XAU, valutakoderna för de två ädelmetallerna. Vi ser att platina har passerat en viss motståndsnivå i relationen. Platina har nu mindre än 2% kvar till att handlas på par till guld. Platina har historiskt varit dyrare än guld. Det har varit det ”normala” och situationen kan vara på väg att ”normaliseras” igen.
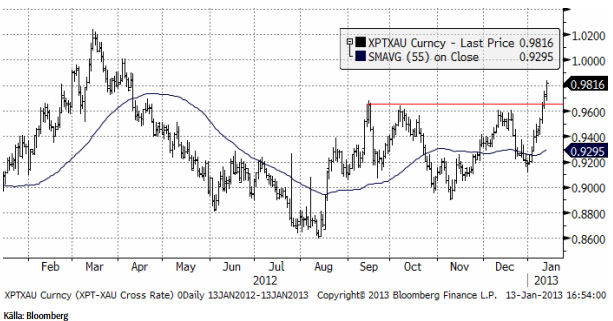
Vi tror alltså på att priset på platina ska gå upp och på att platina ska ge bättre avkastning än guld och silver. Vi rekommenderar köp av PLATINA S eller BULL PLATIN X2/X4 S för den som vill ha högre utväxling.
Basmetaller
Efter årets starka inledning med uppgångar på 3-4 % under den första handelsdagen har optimismen avtagit. Priserna har successivt fallit tillbaka, men är ändå upp på året efter 1,5 veckas handel mellan 1 och 3 %. Undantaget är zink som föll tillbaka relativt kraftigt under den senare delen av den gångna veckan. Zink är nu ned 3 % under årets inledning. Till detta finns en möjlig förklaring (som delas av andra aktörer): omviktning av två av de största råvaruindexen under perioden 8-15 januari. Uppgifterna varierar något men klart står att de behövt sälja mycket aluminium och zink, det ryktas om 13,000 LME-poster vardera under perioden. Inte så mycket likviditetsmässing för aluminium, men desto svårare för zink att ta emot.
Kinesisk statistik kommer in fortsatt starkt. I veckan var det handelsbalansen som inger förtroende med ökad export och import. Det senare avspeglas i fortsatt bra efterfrågan på metaller, framför allt koppar och järnmalm. Samtidigt ökade inflationen lite mer än väntat (2,5 %) vilket påverkade marknaden lite negativt under fredagen. Oro för amerikanska budgetförhandlingar kommer prägla marknaden de närmsta veckorna, men viktigast är ändå signalerna från Kina. Det blir nog lite avvaktande inför det kinesiska nyåret (med början 10 feb) och utvecklingen i början av Ormens år. Vi kvarstår med vår bedömning om fortsatta stimulanser vilket ger stöd till markanden och reducerar risken på nedsidan. Positiva överraskningar från övriga världen kommer kunna ge styrka till de basmetaller som enligt vår mening har störst potential på uppsidan ur ett fundamentalt perspektiv (nickel och zink).
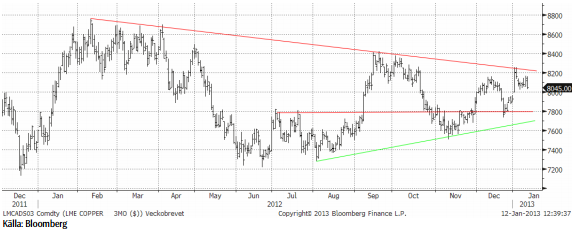
Koppar
Kinas handelssiffror uppfattades som positiva, framför allt då exporten ökade (bra efterfrågan i omvärlden). Kopparimporten var dock något av en besvikelse. Den föll från 365 tton i november till 341 tton i december. Toppmånaderna brukar ligga kring 450 tton. Det är fortsatt höga siffror och trenden är ökande, kanske inte i den takt som kan förväntas den här tiden på året.
Den tekniska bilden är relativt neutral för tillfället. Om LME-noteringen (3 månaders) kommer ned mot $7800 är det ett köp. Alternativet är att avvakta ett brott på uppsidan, vilket skulle vara definitivt över $8400.
Aluminium
En positiv kvartalsrapport från en väldens största aluminiumproducenter, amerikanska Alcoa, påverkade alla finansiella marknaden under veckans inledning. Resultatet kom in som väntat, men det var framför allt framtidsutsikterna som blev tongivande. Bolaget tror på en stark efterfrågan som väntas växa klart över trend på 7 %, och föga förvånade, främst drivet från Kina. Vi har nämnt tidigare att aluminium tar marknadsandelar från andra material och har därmed väldigt ljusa utsikter.
”Problemet” är utbudet som är överhängande. Alcoa tror på ett fortsatt överskott som tar tid att beta av. Den starka efterfrågan begränsar nedsidan, samtidigt som utbudet har motsvarande effekt på uppsidan. Terminsmarknaden har lugnat ned sig efter turbulensen i december då skillnaden mellan spotpriser och terminspriser var negativ (backwardation).
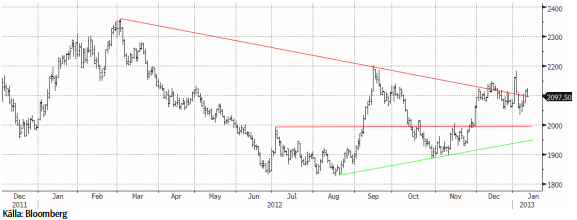
Tekniskt sett ligger priset och balanserar på trendlinjen, men tenderar att vilja bryta uppåt. Vi är fortsatt lite avvaktande men utesluter inte nya test upp mot motståndsnivån $2200.
Zink
Som vi nämnde i ingressen led zinken av veckans omviktning av råvaruindexen. Stora volymer skulle säljas (enligt rykten ca 13 000 LME-kontrakt, vilket är ganska mycket för zink). Detta är av tillfällig karaktär och således bör trycket av den orsaken minska i veckan.
Som vi skrivit tidigare är de största användningsområdena för zink bygg- och transportindustrin. Två områden som nu gynnas av en mer positivt syn på tillväxten i Kina och USA. Zink ligger väl placerad i det scenariot. De kommande årens begränsningar av utbudet talar också för en starkare zinkmarknad. Hotet är, som vi också nämnt tidigare, kortsiktigt överskott p.g.a. ökad gruvproduktion i Kina. Enligt bedömare avtar tillväxten nu av det kinesiska utbudet. Zinkpriset är fortfarande lågt ur ett produktionskostnadsperspektiv och lönsamheten är svag i smältverksledet. Överskottet har också byggt stora lager som måste betas av. Ett troligt scenario är samma utveckling som för aluminium, d.v.s. att lagret knyts upp i finansieringsupplägg (se tidigare beskrivningar kring aluminiummarknaden) som kommer att undanhålla material från konsumenter, vilket framför allt gynnar de fysiska premierna, men också sannolikt zinkpriset. Omsvängningen av stämningsläget gör att vi nu bedömer att marknaden kommer diskontera starkare fundamental balans, vilket ofta innebär att investerare köper i ”förtid”.
Veckan före jul rekommenderade vi att ta vinst kring motståndet vid 2150. Priset bröt ur kanalen och tillfälligtvis upp till ca2190 under årets första handelsdag. Vinsthemtagningarna har varit kraftiga och i kombination med omviktningen av råvaruindex (se ovan) blev pressen stor. Ur ett tekniskt perspektiv bör man stå vid sidlinjen för tillfället. Vi tror emellertid på en större potential på 2-3 månaders sikt på nivåer upp mot $2400.
Vi rekommenderar köp av ZINK S eller BULL ZINK X2 / X4 S för den som vill ta mer risk. Man bör gå ur positionen om priset faller genom 1930 dollar per ton, som är stödet i den konsolideringsfas som varit rådande sedan prisfallet slutade i slutet av maj. Kortsiktigt bör man ta hem vinst vid motståndsnivån $2150. På lite längre sikt är potentialen större. Nästa motståndsnivå kommer in vid $2200, men målet är $2400 på 2- 3 månaders sikt.
Nickel
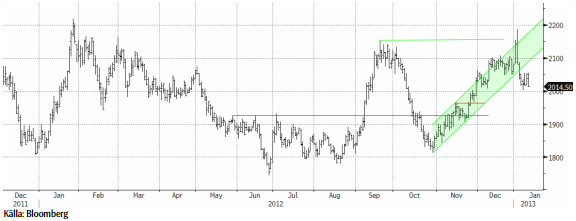
Rapporter från den rostfria stålindustrin tyder på en försenad lagerbyggnadscykel. Industrifolk säger fortfarande att det släpar efter något, men det finns ett uppdämt köpbehov ute i industrin. Det är nog till stor del det vi ser nu, även om den inte är så kraftig. Priset ligger väldigt ”fast” i intervallet mellan $17000 och $18000. Positiva signaler från Kina och produktionen av rostfritt stål kan i kombination med det uppdämda köpbehovet i industrin snabbt leda till en starkare marknad.
Två saker håller tillbaka: överkapaciteten i Europa inom den rostfria stålindustrin i kombination med förväntningar om ökat utbud. Det senare är dock som vanligt en joker i leken. En stor del av ökningarna kommer från ny teknik som tidigare år överraskat negativt. Nickelmarknaden är känslig. Positiva signaler från Kina och ett tightare utbud än väntat kan ge en kraftig uppgång. Men det är som sagt lite osäkert.
En tänkbar strategi är att handla metallen i intervallet $17000-$18000. Potentialen är dock stor på uppsidan och om faktorerna ovan slår in kan priset lätt ta sig upp till $22000 senare under året.
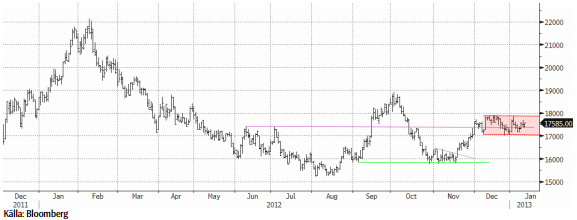
Vi rekommenderar köp av NICKEL S eller BULL NICKEL X2 / X4 S för den som vill ta mer risk. Man bör gå ur positionen om priset faller genom 15,800 dollar per ton, som är stödet i den konsolideringsfas som varit rådande sedan prisfallet slutade i slutet av oktober. Kortsiktigt bör man ta hem vinst vid moståndsnivån $18000. På lite längre sikt är potentialen större. Nästa motståndsnivå kommer in strax under $19000.
Kaffe
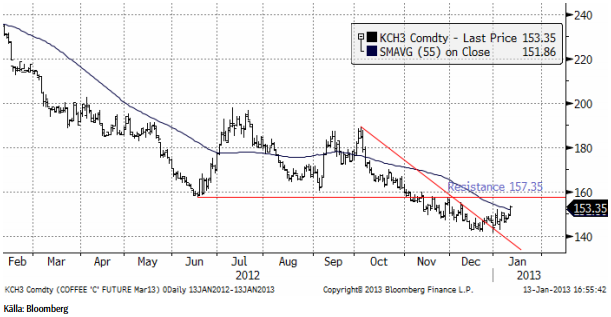
Kaffepriset (mars 2013) tycks ha etablerat en botten, åtminstone för den här nedgångscykeln. Priset bröt 55-dagars glidande medelvärde i fredags, under gott momentum. En ovanligt stor skörd i Brasilien har fått priset på kaffe att falla med 35% det senaste året. Kaffe är en ”vartannat-års-gröda”. Enligt Conab kan årets skörd överträffa förra årens rekord. Enligt Conab kommer skörden att uppgå till 50.83 miljoner säckar. År 2012 skördades 43.5 miljoner säckar och året innan 48 miljoner. En säck väger 60 kg. Skörden sker i april. Av skörden väntas 37.5 miljoner säckar vara av arabica-sorten och 12.7 miljoner säckar vara av robusta-sorten.
I en sammanställning i den senaste månadsrapporten från International Coffee Organisation kan vi se att global skörd i är väntas bli 144 miljoner säckar, vilket är en ökning med 7% från förra årets 134 miljoner. Året innan producerades 133 miljoner säckar.
Från Vietnam rapporterades däremot i fredags att skörden kan bli 40% lägre än förra året. Vietnam har blivit världens största robusta-producent. Brasilien är störst på arabica och totalt sett störst. Kvaliteten har också förbättrats och gott om Colombias.
ICO avslutar sin månadsrapport, publicerad i förra veckan, med att säga
“costs of production continue to increase, reducing good agricultural practices in a number of exporting countries. Vietnam is unlikely to repeat its record crop of 2011/12 this year and Colombia is also yet to recover to its previous production levels. Consumption remains reasonably resilient to macroeconomic concerns, and there is strong potential for growth in exporting countries and emerging markets. With certified stocks and inventories at relatively low historical levels, there seems to be limited potential for further downwards price corrections.”
Det tror vi också och tycker att man ska vara köpt KAFFE S. Eventuellt kan man ta hem vinster vi motståndet på 157.35, men skulle den nivån brytas, finns ännu bättre motiv att köpa ännu mer KAFFE S där.
Socker
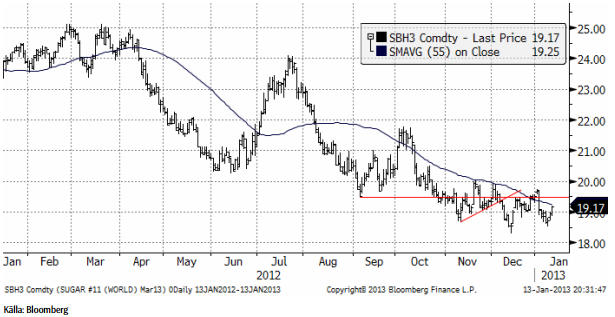
Sockerpriset (mars 2013) vände upp förra veckan efter att rekylen nedåt blev förvånande liten när priset vände på 18.52 som lägst. Det ser ut som om marknaden håller på att konsolidera sig, liksom för kaffemarknaden ovan. I två månader har priserna inte varit i fallande trend längre, utan rört sig sidledes. Det är vanligt att detta föregår en trendvändning. Vi förbereder oss därför på att gå över från neutral rekommendation till köprekommendation. Den som vill gå lång socker köper certifikatet SOCKER S.
För analyser på övriga jordbruksprodukter se dagens veckobrev, SEB Jordruksprodukter.
[box]SEB Veckobrev Veckans råvarukommentar är producerat av SEB Merchant Banking och publiceras i samarbete och med tillstånd på Råvarumarknaden.se[/box]
Disclaimer
The information in this document has been compiled by SEB Merchant Banking, a division within Skandinaviska Enskilda Banken AB (publ) (“SEB”).
Opinions contained in this report represent the bank’s present opinion only and are subject to change without notice. All information contained in this report has been compiled in good faith from sources believed to be reliable. However, no representation or warranty, expressed or implied, is made with respect to the completeness or accuracy of its contents and the information is not to be relied upon as authoritative. Anyone considering taking actions based upon the content of this document is urged to base his or her investment decisions upon such investigations as he or she deems necessary. This document is being provided as information only, and no specific actions are being solicited as a result of it; to the extent permitted by law, no liability whatsoever is accepted for any direct or consequential loss arising from use of this document or its contents.
About SEB
SEB is a public company incorporated in Stockholm, Sweden, with limited liability. It is a participant at major Nordic and other European Regulated Markets and Multilateral Trading Facilities (as well as some non-European equivalent markets) for trading in financial instruments, such as markets operated by NASDAQ OMX, NYSE Euronext, London Stock Exchange, Deutsche Börse, Swiss Exchanges, Turquoise and Chi-X. SEB is authorized and regulated by Finansinspektionen in Sweden; it is authorized and subject to limited regulation by the Financial Services Authority for the conduct of designated investment business in the UK, and is subject to the provisions of relevant regulators in all other jurisdictions where SEB conducts operations. SEB Merchant Banking. All rights reserved.

Down on Friday. Up on Monday. The Brent June crude oil contract traded down 5.1% last week to a close of $90.38/b. It reached a high of $103.87/b last Monday and a low of $86.09/b on Friday as Iran announced that the Strait of Hormuz was fully open for transit. That quickly changed over the weekend as the US upheld its blockade of Iranian oil exports while Iran naturally responded by closing the SoH again. The US blew a hole in the engine room of the Iranian ship TOUSKA and took custody of the ship on Sunday. Brent crude is up 5.6% this morning to $95.4/b.

The cease-fire is expiring tomorrow. The US has said it will send a delegation for a second round of negotiations in Islamabad in Pakistan. But Iran has for now rejected a second round of talks as it views US demands as unrealistic and excessive while the US is also blocking the Strait of Hormuz.
While Brent is up 5% this morning, the financial market is still very optimistic that progress will be made. That talks will continue and that the SoH will fully open by the start of May which is consistent with a rest-of-year average Brent crude oil price of around $90/b with the market now trading that balance at around $88/b.
Financial optimism vs. physical deterioration. We have a divergence where the financial market is trading negotiations, improvements and resolution while at the same time the physical market is deteriorating day by day. Physical oil flows remain constrained by disrupted flows, longer voyage times and elevated freight and insurance costs.
Financial markets are betting that a US/Iranian resolution will save us in time from violent shortages down the road. But every day that the SoH remains closed is bringing us closer to a potentially very painful point of shortages and much higher prices.
The US blockade is also a weapon of leverage against its European and Asian allies. When Iran closed the SoH it held the world economy as a hostage against the US. The US blockade of the SoH is of course blocking Iranian oil exports. But it is also an action of disruption directed towards Europe and Asia. The US has called for the rest of the world to engaged in the war with Iran: ”If you want oil from the Persian Gulf, then go and get it”. A risk is that the US plays brinkmanship with the global oil market directed towards its European and Asian allies and maybe even towards China to force them to engage and take part. Maybe unthinkable. But unthinkable has become the norm with Trump in the White House.
Wild moves yesterday. Brent crude traded to a high of $114.43/b and a low of $96.0/b and closed at $99.94/b yesterday.
US – Iran negotiations ongoing or not? What a day. Donald Trump announced that good talks were ongoing between Iran and the US and that the 48 hour deadline before bombing Iranian power plants and energy infrastructure was postponed by five days subject to success of ongoing meetings. Iranian media meanwhile stated that no meetings were ongoing at all.
Today we are scratching our heads trying to figure out what yesterday was all about.
Friends and family playing the market? Was it just Trump and his friends and family who were playing with oil and equity markets with $580m and $1.46bn in bets being placed by someone in oil and equity markets just 15 minutes before Trump’s announcement?
Was Trump pulling a TACO as he reached his political and economic pain point: Brent at $112/b, US Gas at $4/gal, SPX below 200dma and US 10yr above 4.4%?
Different Iranian factions with Trump talking with one of them? Are there real negotiations going on but with the US talking to one faction in Iran while another, the hardliners, are not involved and are denying any such negotiations going on?
Extending the ultimatum to attack and invade Kharg island next weekend? Or, is the five day delay of the deadline a tactical decision to allow US amphibious assault ships and marines to arrive in the Gulf in the upcoming weekend while US and Israeli continues to degrade Iranian military targets till then. And then next weekend a move by the US/Israel to attack and conquer for example the Kharg island?
We do not really know which it is or maybe a combination of these.
We did get some kind of TACO ydy. But markets have been waiting for some kind of TACO to happen and yesterday we got some kind of TACO. And Brent crude is now trading at $101.5/b as a result rather than at $112-114/b as it did no the high yesterday.
But what really matters in our view is the political situation on the ground in Iran. Will hardliners continue to hold power or will a more pragmatic faction gain power?
If the hardliners remain in power then oil pain should extend all the way to US midterm elections. The hardliners were apparently still in charge as of last week. Iran immediately retaliated and damaged LNG infrastructure in Qatar after Israel hit Iranian South Pars. The SoH was still closed and all messages coming out of Iran indicated defiance. Hardliners continues in power has a huge consequence for oil prices going forward. The regime has played its ’oil-weapon’ (closing or chocking the Strait of Hormuz). It is using it to achieve political goals. Deterrence: it needs to be so politically and economically expensive to attack Iran that it won’t happen again in the future. Or at least that the US/Israel thinks 10-times over before they attack again. The highest Brent crude oil closing price since the start of the war is $112.19/b last Friday. In comparison the 20-year inflation adjusted Brent price is $103/b. So Brent crude last Friday at $112.19/b isn’t a shockingly high price. And it is still far below the nominal high of $148/b from 2008 which is $220/b if inflation adjusted. So once in a lifetime Iran activates its most powerful weapon. The oil weapon. It needs to show the power of this weapon and it needs to reap political gains. Getting Brent to $112/b and intraday high of $119.5/b (9 March) isn’t a display of the power of that weapon. And it is not a deterrence against future attacks.
So if the hardliners remain in power in Iran, then the SoH will likely remain chocked all the way to US midterm elections and Brent crude will at a minimum go above the historical nominal high of $148/b from 2008.
Thus the outlook for the oil price for the rest of the year doesn’t depend all that much of whether Trump pulls a TACO or not. Stops bombing or not. It depends more on who is in charge in Iran. If it is the hardliners, then deterrence against future attacks via chocking of the SoH and high oil prices is the likely line of action. It is impacting the world but the Iranian ’oil-weapon’ is directed towards the US president and the the US midterm elections.
If a pragmatic faction gets to power in Iran, then a very prosperous future is possible. However, if power is shifting towards a more pragmatic faction in Iran then a completely different direction could evolve. Such a faction could possibly be open for cooperation with the US and the GCC and possibly put its issues versus Israel aside. Then the prosperity we have seen evolving in Dubai could be a possible future also for Iran.
So far it looks like the hardliners are fully in charge. As far as we can see, the hardliners are still fully in control in Iran. That points towards continued chocking of the SoH and oil prices ticking higher as global inventories (the oil market buffers) are drawn lower. And not just for a few more weeks, but possibly all the way to the US midterm elections.
A brief sigh of relief yesterday as oil infra at Kharg wasn’t damaged. But higher today. Brent crude dabbled around a bit yesterday in relief that oil infrastructure at Iran’s Kharg island wasn’t damaged. It traded briefly below the 100-line and in a range of $99.54 – 106.5/b. Its close was near the low at $100.21/b.
No easy victorious way out for Trump. So no end in sight yet. Brent is up 3.2% today to $103.4/b with no signs that the war will end anytime soon. Trump has no easy way to declare victory and mission accomplished as long as Iran is in full control of the Strait of Hormuz while also holding some 440 kg of uranium enriched to 60% and not far from weapons grade at 90%. As long as these two factors are unresolved it is difficult for Trump to pull out of the Middle East. Naturally he gets increasingly frustrated over the situation as the oil price and US retail gas prices keeps ticking higher while the US is tied into the mess in the Middle East. Trying to drag NATO members into his mess but not much luck there.
When commodity prices spike they spike 2x, 3x, 4x or 5x. Supply and demand for commodities are notoriously inflexible. When either of them shifts sharply, the the price can easily go to zero (April 2022) or multiply 2x, 3x, or even 5x of normal. Examples in case cobalt in 2025 where Kongo restricted supply and the price doubled. Global LNG in 2022 where the price went 5x normal for the full year average. Demand for tungsten in ammunition is up strongly along with full war in the middle east. And its price? Up 537%.
Why hasn’t the Brent crude oil price gone 2x, 3x, 4x or 5x versus its normal of $68/b given close to full stop in the flow of oil of the Strait of Hormuz? We are after all talking about close to 20% of global supply being disrupted. The reason is the buffers. It is fairly easy to store oil. Commercial operators only hold stocks for logistical variations. It is a lot of oil in commercial stocks, but that is predominantly because the whole oil system is so huge. In addition we have Strategic Petroleum Reserves (SPRs) of close to 2500 mb of crude and 1000 mb of oil products. The IEA last week decided to release 400 mb from global SPR. Equal to 20 days of full closure of the Strait of Hormuz. Thus oil in commercial stocks on land, commercial oil in transit at sea and release of oil from SPRs is currently buffering the situation.
But we are running the buffers down day by day. As a result we see gradually increasing stress here and there in the global oil market. Asia is feeling the pinch the most. It has very low self sufficiency of oil and most of the exports from the Gulf normally head to Asia. Availability of propane and butane many places in India (LPG) has dried up very quickly. Local prices have tripled as a result. Local availability of crude, bunker oil, fuel oil, jet fuel, naphtha and other oil products is quickly running down to critical levels many places in Asia with prices shooting up. Oman crude oil is marked at $153/b. Jet fuel in Singapore is marked at $191/b.
Oil at sea originating from Strait of Hormuz from before 28 Feb is rapidly emptied. Oil at sea is a large pool of commercial oil. An inventory of oil in constant move. If we assume that the average journey from the Persian Gulf to its destinations has a volume weighted average of 13.5 days then the amount of oil at sea originating from the Persian Gulf when the the US/Israel attacked on 28 Feb was 13.5 days * 20 mb/d = 269 mb. Since the strait closed, this oil has increasingly been delivered at its destinations. Those closest to the Strait, like Pakistan, felt the emptying of this supply chain the fastest. Propane prices shooting to 3x normal there already last week and restaurants serving cold food this week is a result of that. Some 50-60% of Asia’s imports of Naphtha normally originates from the Persian Gulf. So naphtha is a natural pain point for Asia. The Gulf also a large and important exporter of Jet fuel. That shut in has lifted jet prices above $200/b.
To simplify our calculations we assume that no oil has left the Strait since that date and that there is no increase in Saudi exports from Yanbu. Then the draining of this inventory at sea originated from the Persian Gulf will essentially look like this:
The supply chain of oil at sea originating from the Strait of Hormuz is soon empty. Except for oil allowed through the Strait of Hormuz by Iran and increased exports from Yanbu in the Red Sea. Not included here.

Oil at sea is falling fast as oil is delivered without any new refill in the Persian Gulf. Waivers for Russian crude is also shifting Russian crude to consumers. Brent crude will likely start to feel the pinch much more forcefully when oil at sea is drawn down another 200 mb to around 1000 mb. That is not much more than 10 days from here.

Oil and oil products are starting to become very pricy many places. Brent crude has still been shielded from spiking like the others.


Market Still Betting on Timely Resolution, But Each Day Raises Shortage Risk

Christian Kopfer om läget för oljan

Marknaden måste börja betrakta de höga kopparpriserna som det nya normala

Det fysiska spotpriset på brentolja har slagit nytt rekord

40 minuter med Javier Blas om hur världen verkligen påverkas av energikrisen
40 minuter med Javier Blas om hur världen verkligen påverkas av energikrisen

Elpriserna fördubblas, stor osäkerhet inför sommaren

MP Materials, USA:s svar på Kinas dominans över sällsynta jordartsmetaller
Det fysiska spotpriset på brentolja har slagit nytt rekord

Studsvik har idag ansökt om att få bygga 1200-1600 MW kärnkraft i Valdemarsvik
-
 Nyheter3 veckor sedan
40 minuter med Javier Blas om hur världen verkligen påverkas av energikrisen
-
 Nyheter4 veckor sedan
Elpriserna fördubblas, stor osäkerhet inför sommaren
-
 Nyheter4 veckor sedan
MP Materials, USA:s svar på Kinas dominans över sällsynta jordartsmetaller
-
 Nyheter2 veckor sedan
Det fysiska spotpriset på brentolja har slagit nytt rekord
-
 Nyheter4 veckor sedan
Studsvik har idag ansökt om att få bygga 1200-1600 MW kärnkraft i Valdemarsvik
-
 Nyheter2 veckor sedan
Marknaden måste börja betrakta de höga kopparpriserna som det nya normala
-
Analys4 veckor sedan
TACO (or Whatever It Was) Sends Oil Lower — Iran Keeps Choking Hormuz
-

 Nyheter4 veckor sedan
Matproduktion är beroende av gödsel, Gulfkriget skapar brist