

Analys
SEB – Råvarukommentarer, 12 maj 2014

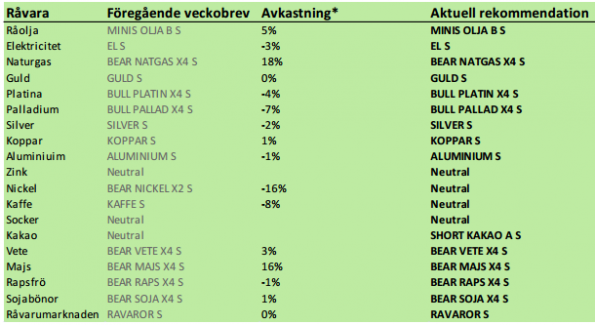
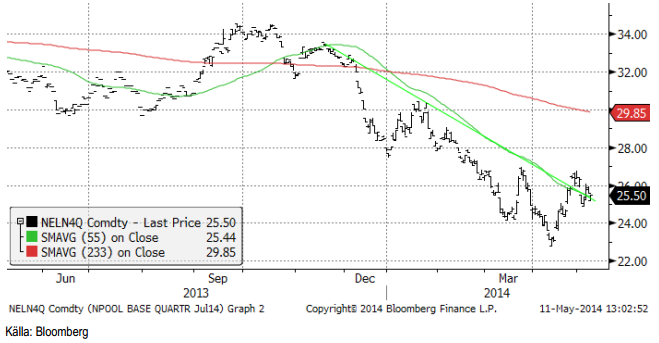
Rekommendationer
Kort sammanfattning
ECB-chefen Mario Draghis kommentar i torsdags till varför euron är så stark just nu, att det beror på att kapitalflykten från Ryssland kan ha varit 220 miljarder och inte de 70 miljarder dollar som Rysslands centralbank rapporterat, är högintressant för ett par marknader. I Rysslands valutareserv ingår t ex guld, som det gör för alla länder, vare sig man har något eller inte. Rysslands centralbanks innehav av platina och palladium är däremot statshemligheter. Vi erfar ett Rysslands centralbank sålt en hel del och även om de kan ha lite kvar, så behåller de detta av strategiska anledningar. Vi tror att säljtrycket på palladium i stort sett är borta och att priset därmed kan gå in i en kraftig hausse. Mer om det inne i brevet.
Det kom tre viktiga rapporter inom lantbrukssektorn i veckan som gick. I torsdags publicerade först CONAB sin rapport för maj, där informationen om sojabönorna tilldrog sig mest intresse. Senare samma dag publicerade FAO/AMIS sin rapport för månaden och på fredagskvällen kom USDA med sin maj-rapport, som för första gången presenterade estimat för året 2014/15. FAO/AMIS rapport var överlag negativ för priserna på spannmål och oljeväxter och det var USDA:s rapport också, precis som vi väntat oss.
Kinas importstatistik presenterades tidigare i veckan och den visade starka siffror för importen för en rad råvaror, inte bara för sojabönor. Media gjorde en stor sak av att allt från importen av råolja till sojabönor var stark. Om man dock sätter denna enskilda månad i perspektiv av de senaste åren, snarare bekräftas bilden av en takt i råvaruimporten som mattas.
Geopolitisk oro, som t ex Rysslands krig med Ukraina, gör att människor blir extra sparsamma och det gäller även för konsumtionen av dyrare mat (kött, etc). Konsumtionen av framförallt foderspannmål kan därför påverkas negativt med högre lager och lägre pris på lite sikt som konsekvens, allt annat lika. Av ECB chefen Mario Draghis kommentar till den starka euro-växelkursen, att kapitalflykten från Ryssland varit 220 miljarder dollar den senaste tiden, och inte 70 mdr dollar, som Rysslands centralbank rapporterat, tyder på att Ryssland drabbats av finansiell härdsmälta.
Det är knappast något som gynnar konsumtionen av dyrare mat inom landet. Detta ska man ta i beaktande när man ser på FAO/AMIS och USDA:s estimat av konsumtion av spannmål under 2014/15 och utgående lager. Utgående lager kan bli högre pga lägre konsumtion i folkrika länder, t ex Ryssland. Det innebär att priset på ett års sikt kan bli ännu lägre än de låga nivåer som USDA förutspår på basis av sina utbuds- och efterfrågebalanser.
Råolja – Brent
Amerikanska raffinaderier börjar komma igång igen efter att ha ställt om till sommarproduktion (mer bensin, mindre eldningsolja). Det innebär att vi passerat den säsongsmässigt svagaste tiden för oljemarknaden. Bråket i Libyen med väsentligt mindre produktion än vad som hade varit möjligt, gjorde att priset på olja höll sig högt i april. Vad vi erfar är att Libyen nu bara producerar ca 250,000 fat per dag. Rebellerna har just nu övertaget i konflikten inom landet och hotar att ta tillbaka två av oljehamnarna.
Råoljelagren i USA minskade något, främst beroende på lägre import.
Vi rekommenderar en kort position i olja, t ex med MINIS OLJA B S eller MINIS OLJA A S
Elektricitet
Förra veckan gick vi över till köprekommendation med tillägget att försöka vänta på en rekyl att köpa på. Kanske var det några som hann med att göra det i den rekyl som faktiskt inföll i veckan.
Vi behåller köprekommendationen. Stöd finns på 24 euro och motstånd på 27.
Naturgas
Priset på naturgas befinner sig i en fallande trend. Stöd finns på 4.40 och på lägre nivå 4.20. Vi fortsätter med säljrekommendation.
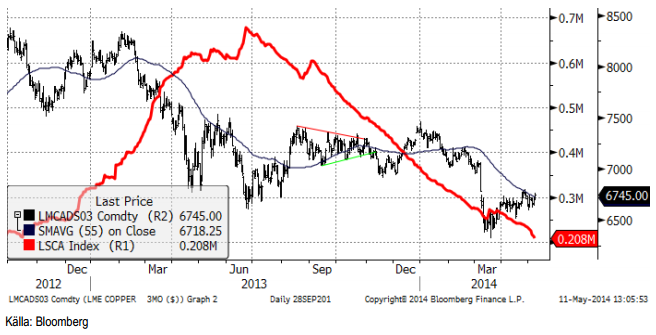
Koppar
Det Indonesiska exportförbudstemat har av uppenbara skäl varit fixerat vid nickel. Kopparmalmsexporten har varit undantagen, men exportskatterna har ännu inte avgjorts slutgiltigt. Detta har dragit ut på tiden sedan början av året. Kopparmarknaden saknar därför
material från Indonesien.
Den fysiska premien CIF Shanghai har fortsatt uppåt till 130 dollar per ton från 100 dollar för två veckor sedan och 75 dollar i mars. Detta är ett tecken på att efterfrågan ökar snabbare än det går att forsla in material.
Tekniskt är 6750 dollar en viktig motståndsnivå, som ser ut att bli svår för kopparmarknaden att handla över, rent tekniskt, men å andra sidan ser lagren ut att minska stadigt. Teknisk analys säger, var försiktig, men fundamenta säger köp. Vem vinner? Vi fortsätter med köprekommendation i alla fall.
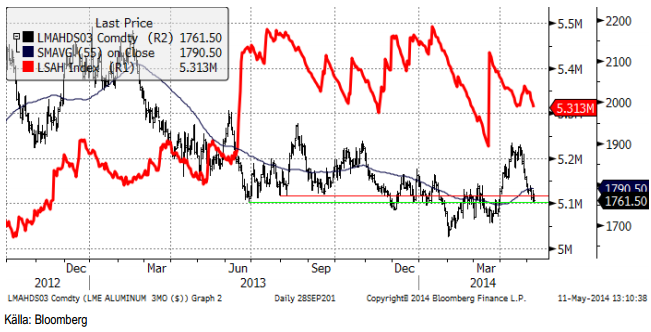
Aluminium
De senaste veckorna har varit något av en besvikelse för dem som trodde att vi hade sett någon slags trendvändning i den här marknaden. Stödet vid 1850 dollar gav vika och marknaden handlade så lågt som 1755 i fredags. Kurvrörelserna de senaste veckorna med press på de längre terminskontraktens contango, antyder att marginella producenter tar tillfället i akt att prissäkra framtida produktion. Vi har sett intresse från konsumenter på vägen ner, men uppenbarligen inte tillräckligt för att hindra marknaden från att falla. Investerarkollektivet lämnar uppenbarligen sina långa positioner och går i någon utsträckning kort igen. Som vi har skrivit i tidigare veckobrev, kommer det att ta tid för marknaden att beta av de senaste årens överproduktion. Men inte desto mindre känns det som om något viktigt har hänt då marknaden tagit ett kliv uppåt. Man ska dock ställa in sig på att priset kan röra sig sidledes ett tag. 1750 dollar-nivån kommer att vara viktig den kommande veckan. Vi tror den håller och rekommenderar köp här.
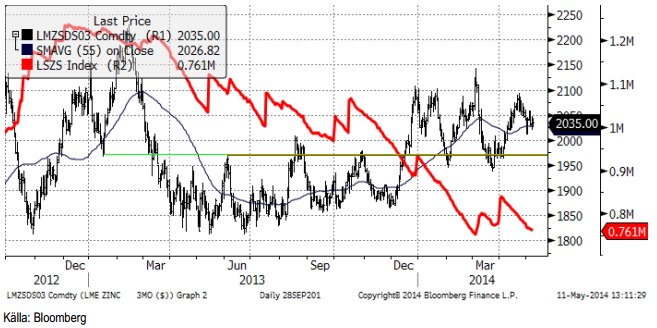
Zink
Metall har stadigt tagit ut från LME:s lagerhus sedan början av april. Frågan nu är om detta går till konsumtion eller inte. Misstanken som föddes tidigt, att metallen flyttades till billigare lager för att ingå i finansieringsaffärer är mindre trolig nu, när contangot är mindre. Det är bara i aluminium som contangot fortfarande är bra nog för den sortens affärer. Uttagen av zink från lagren handlar därför troligtvis om riktig efterfrågan och det är ett gott tecken för zinkmarknaden. Prisrörelserna på LME tycks vara en återspegling av lagerförändringen. Just nu verkar dock priset vara fast inom intervallet 1950 – 2150 dollar.
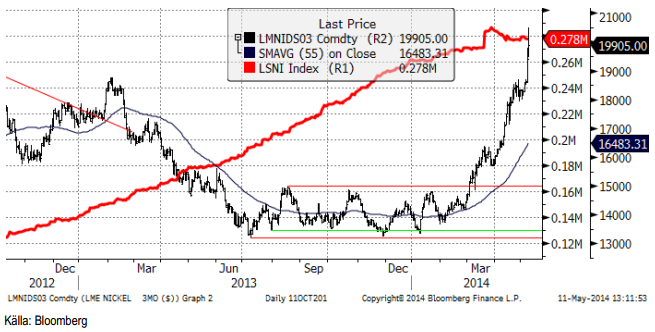
Nickel
Nickelpriset har stigit med imponerande 10% sedan förra veckan. Det är den sjätte veckan i följd som priset stiger. De senaste 14 veckorna är det bara en vecka när priset gått ner. Hittills i år har priset gått upp med 45%. Det är fortfarande samma faktorer som ligger bakom prisuppgången, dvs Indonesien och Ryssland. Den här veckan tillkom emellertid ytterligare en faktor: Vales gruva i Nya Kaledonien har produktionsproblem. Gruvan är liten, och problemen ”borde” inte ha fått den effekt på priset som den fick.
Veckans prisuppgång skedde nästan helt och hållet mellan onsdagen och fredagen. Det är intressant att uppgångarna sker i asiatisk handel. När vi kommer in på morgonen är priset redan högre. Sedan är priset oförändrat, eller faller tillbaka lite. Det kommer rapporter om att kinas produktion av NPI sjunker. Fördelen för NPI-baserad produktion av rostfritt stål var beroende av billig malm från Indonesien. Visserligen har kinesiska verk byggt upp stora lager som de tar av nu, men snart tar den traditionella framställningsmetoden över, med den ekonomi på nickel som det innebär. De flesta analytiker menar att golvet för nickelpriset då blir ca 18,000 dollar per ton. Tillverkningen av rostfritt stål använder ca 60% av nickelutbudet i världen och vi ser tecken på en återhämtning där också. Enligt CRU är industrin tillbaka på en årlig tillväxttakt på 5%. Även haussen i nickelpriset kan ge efterfrågan på rostfritt stål en boost. Köpare av rostfritt stål börjar boka in framtida köp.
Nickelmarknaden har botten bakom sig.
Guld
Guldpriset föll tillbaka efter att Ryska uttalanden varit mindre aggressiva i veckan som gick. Priset rör sig inom ett smalt intervall och stödet vid 1880 är fortfarande intakt. Vi fortsätter att vara försiktigt positiva till guld.
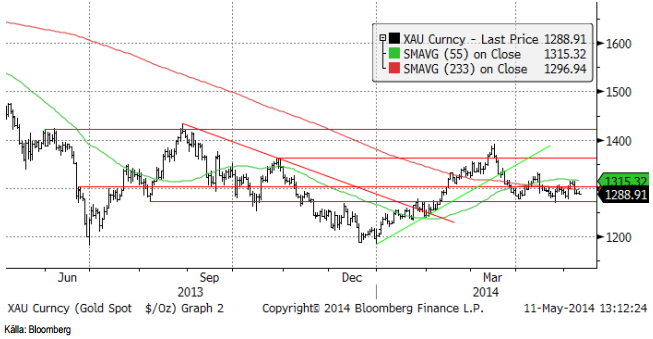
Vi rekommenderar köp av GULD S.
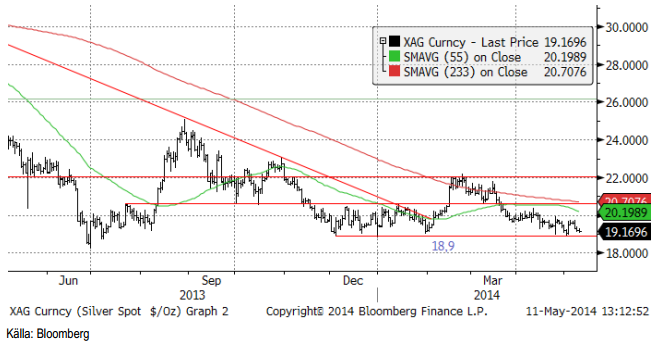
Silver
Silverpriset föll tillbaka i veckan, tillsammans med guld, efter att uttalanden från Ryssland var mindre krigiska än tidigare. När priset nu närmar sig stödet på 18.90 finns därför goda tillfällen att köpa silver.
Nedan ser vi ett diagram över priset på guld uttryckt i silver. Det går alltså över 67 finuns silver på varje fin-uns av guld (förra veckan 66 uns silver). Som vi ser är det en hög nivå, dvs silver är billigt i förhållande till guld.
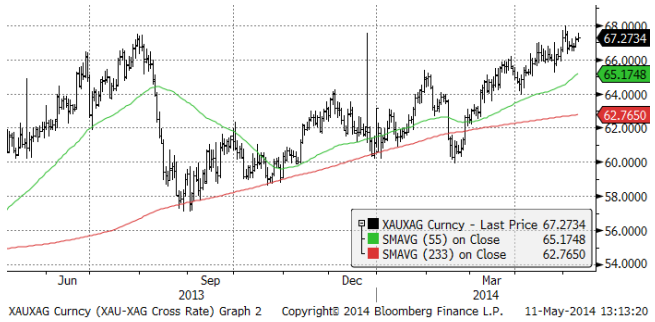
Vi anser att silver är mer köpvärt än guld och skulle vilja köpa på de här nivåerna. Vi rekommenderar köp av SILVER S.
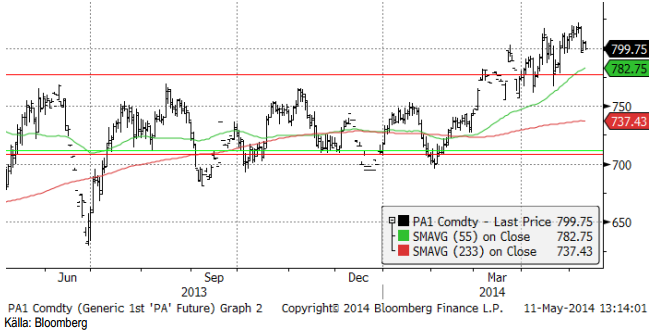
Platina & Palladium
Mario Draghi, chefen för ECB, sade i torsdags att kapitalutflödet från Ryssland kanske varit 220 miljarder dollar, så mycket att det höjt växelkursen på euron. Rysslands centralbank har sagt att utflödet varit 70 miljarder dollar. Detta är dock baserat på den offentliga delen av valutareserven och där ingår guld, men inte palladium, platina och diamanter. Det sägs rakt ut att innehavet av palladium är en statshemlighet i Ryssland. Om Rysslands centralbank sålt palladium, platina och diamanter kan utflödet alltså vara större än det officiella. GFMS menar att Rysslands centralbank hade uppskattningsvis 0.3 miljoner uns palladium innan krisen. Detta förslår inte alls för skillnaden mellan 70 och 220 miljarder dollar. Men de har även vad vi erfar haft platina och diamanter, såväl inom centralbanken som i den strategiska reserven. Vi erfar att metall har flyttats till Schweiz varifrån det sålts vidare. Vi är inte säkra på att allt har lämnat Schweiz. Metall kan finnas i låsta lager, kanske av den sorts lagerhotell som finns på Klotenflygplatsens ”frihamnslager”. Det kan vara så att någon spelare sitter med detta som en lång position och är redo att sälja om priset kommer upp. Vi tror inte att Ryssland har metall kvar som man vill sälja. Det (lilla) man har kvar behövs som en strategisk reserv.
Säljtrycket kan alltså i stort sett vara borta och med det intresse som finns, så skulle priset på palladium och till viss del kanske även platina kunna gå väsentligt mycket högre
Skulle västvärlden gå till nivå 3 i sanktioner mot Ryssland, tror vi att man kommer att låta olje- och gasindustrin vara. Man vill inte ha ett högt pris på gas. Vi tror att man kommer att ge sig på gruvindustrin. Det är då Norilsk Nickel som är det uppenbara målet. Norilsk producerar nickel, platina och palladium. Det finns även en järnmalmsproduktion som kan bli lidande av sanktioner, men huvudsakligen är det palladium och platina som drabbas.
Det allmänna valet i Sydafrika den 7 maj gav ANC drygt 60% av rösterna, vilket innebär att de fortsätter att styra landet som de gjort de senaste 20 åren. Inflationen ligger på en hög nivå, 12% om man extrapolerar de senaste förändringarna i konsumentpriserna. Det är över centralbankens övre gräns på 6% för inflationen och det kan innebära kommande räntehöjningar. Å andra sidan är BNP-tillväxten låg på 1.9% förra året. SEB:s Emerging Markets-ekonom väntar sig att den stiger marginellt till 2.2% i år, men detta kan grusas om det blir räntehöjningar.
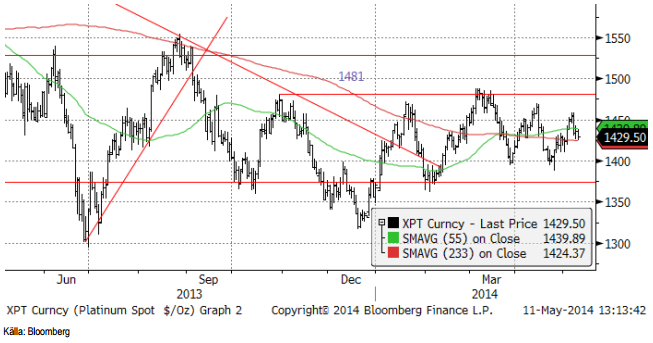
Prisdiagrammet på palladium ser vi nedan.
Vi rekommenderar köp av PLATINA S och PALLADIUM S, eller BULL PLATINA X4 S eller BULL PALLAD X4 S.
För den som vill ta ännu mer risk, finns nu även BULL PALLAD X5 S.
Kaffe
Förra veckan hade vi köp, men skrev också att man skulle ta stoppen om priset gick under 200 cent. Det gjorde priset i torsdags, så vi hoppas att alla är ute ur sina långa positioner nu. Vi har neutral, efter stoppen. Och med tanke på att det förmodligen finns tekniskt stöd vid 180 cent, är det inte läge för att gå kort just nu utan behåller neutral.
En anledning till prisfallet var att sannolikheten för ett El Niño minska kraftigt i den senaste prognosen från Australiens Meteorologiska Byrå. Det innebär att risken för skador på skörden av robusta i Indonesien och Vietnam också minskat på motsvarande sätt.
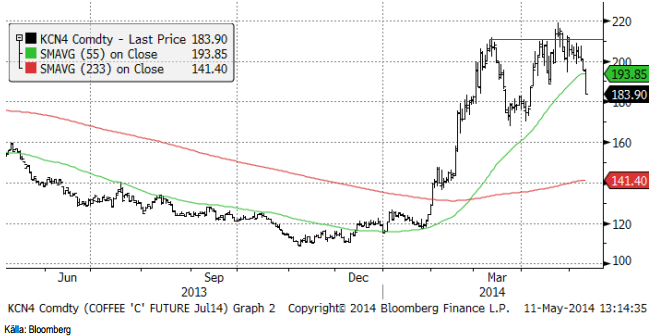
Neutral rekommendation på kaffe.
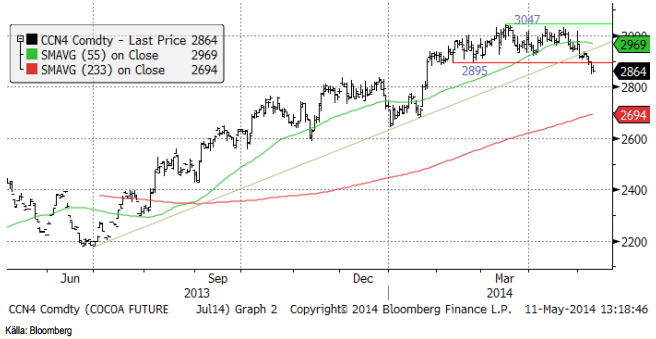
Kakao
Priset på kakao ligger nu i fallande trend och vi väljer att gå kort. Det är en fint rundad toppformation. Tekniskt stöd finns på 2800 dollar. Vi rekommenderar köp av SHORT KAKAO A S, som har en hävstång strax under -1.
För övriga råvaror från jordbruket se dagens andra analysbrev från SEB.
[box]SEB Veckobrev Veckans råvarukommentar är producerat av SEB Merchant Banking och publiceras i samarbete och med tillstånd på Råvarumarknaden.se[/box]
Disclaimer
The information in this document has been compiled by SEB Merchant Banking, a division within Skandinaviska Enskilda Banken AB (publ) (“SEB”).
Opinions contained in this report represent the bank’s present opinion only and are subject to change without notice. All information contained in this report has been compiled in good faith from sources believed to be reliable. However, no representation or warranty, expressed or implied, is made with respect to the completeness or accuracy of its contents and the information is not to be relied upon as authoritative. Anyone considering taking actions based upon the content of this document is urged to base his or her investment decisions upon such investigations as he or she deems necessary. This document is being provided as information only, and no specific actions are being solicited as a result of it; to the extent permitted by law, no liability whatsoever is accepted for any direct or consequential loss arising from use of this document or its contents.
About SEB
SEB is a public company incorporated in Stockholm, Sweden, with limited liability. It is a participant at major Nordic and other European Regulated Markets and Multilateral Trading Facilities (as well as some non-European equivalent markets) for trading in financial instruments, such as markets operated by NASDAQ OMX, NYSE Euronext, London Stock Exchange, Deutsche Börse, Swiss Exchanges, Turquoise and Chi-X. SEB is authorized and regulated by Finansinspektionen in Sweden; it is authorized and subject to limited regulation by the Financial Services Authority for the conduct of designated investment business in the UK, and is subject to the provisions of relevant regulators in all other jurisdictions where SEB conducts operations. SEB Merchant Banking. All rights reserved.

Down on Friday. Up on Monday. The Brent June crude oil contract traded down 5.1% last week to a close of $90.38/b. It reached a high of $103.87/b last Monday and a low of $86.09/b on Friday as Iran announced that the Strait of Hormuz was fully open for transit. That quickly changed over the weekend as the US upheld its blockade of Iranian oil exports while Iran naturally responded by closing the SoH again. The US blew a hole in the engine room of the Iranian ship TOUSKA and took custody of the ship on Sunday. Brent crude is up 5.6% this morning to $95.4/b.

The cease-fire is expiring tomorrow. The US has said it will send a delegation for a second round of negotiations in Islamabad in Pakistan. But Iran has for now rejected a second round of talks as it views US demands as unrealistic and excessive while the US is also blocking the Strait of Hormuz.
While Brent is up 5% this morning, the financial market is still very optimistic that progress will be made. That talks will continue and that the SoH will fully open by the start of May which is consistent with a rest-of-year average Brent crude oil price of around $90/b with the market now trading that balance at around $88/b.
Financial optimism vs. physical deterioration. We have a divergence where the financial market is trading negotiations, improvements and resolution while at the same time the physical market is deteriorating day by day. Physical oil flows remain constrained by disrupted flows, longer voyage times and elevated freight and insurance costs.
Financial markets are betting that a US/Iranian resolution will save us in time from violent shortages down the road. But every day that the SoH remains closed is bringing us closer to a potentially very painful point of shortages and much higher prices.
The US blockade is also a weapon of leverage against its European and Asian allies. When Iran closed the SoH it held the world economy as a hostage against the US. The US blockade of the SoH is of course blocking Iranian oil exports. But it is also an action of disruption directed towards Europe and Asia. The US has called for the rest of the world to engaged in the war with Iran: ”If you want oil from the Persian Gulf, then go and get it”. A risk is that the US plays brinkmanship with the global oil market directed towards its European and Asian allies and maybe even towards China to force them to engage and take part. Maybe unthinkable. But unthinkable has become the norm with Trump in the White House.
Wild moves yesterday. Brent crude traded to a high of $114.43/b and a low of $96.0/b and closed at $99.94/b yesterday.
US – Iran negotiations ongoing or not? What a day. Donald Trump announced that good talks were ongoing between Iran and the US and that the 48 hour deadline before bombing Iranian power plants and energy infrastructure was postponed by five days subject to success of ongoing meetings. Iranian media meanwhile stated that no meetings were ongoing at all.
Today we are scratching our heads trying to figure out what yesterday was all about.
Friends and family playing the market? Was it just Trump and his friends and family who were playing with oil and equity markets with $580m and $1.46bn in bets being placed by someone in oil and equity markets just 15 minutes before Trump’s announcement?
Was Trump pulling a TACO as he reached his political and economic pain point: Brent at $112/b, US Gas at $4/gal, SPX below 200dma and US 10yr above 4.4%?
Different Iranian factions with Trump talking with one of them? Are there real negotiations going on but with the US talking to one faction in Iran while another, the hardliners, are not involved and are denying any such negotiations going on?
Extending the ultimatum to attack and invade Kharg island next weekend? Or, is the five day delay of the deadline a tactical decision to allow US amphibious assault ships and marines to arrive in the Gulf in the upcoming weekend while US and Israeli continues to degrade Iranian military targets till then. And then next weekend a move by the US/Israel to attack and conquer for example the Kharg island?
We do not really know which it is or maybe a combination of these.
We did get some kind of TACO ydy. But markets have been waiting for some kind of TACO to happen and yesterday we got some kind of TACO. And Brent crude is now trading at $101.5/b as a result rather than at $112-114/b as it did no the high yesterday.
But what really matters in our view is the political situation on the ground in Iran. Will hardliners continue to hold power or will a more pragmatic faction gain power?
If the hardliners remain in power then oil pain should extend all the way to US midterm elections. The hardliners were apparently still in charge as of last week. Iran immediately retaliated and damaged LNG infrastructure in Qatar after Israel hit Iranian South Pars. The SoH was still closed and all messages coming out of Iran indicated defiance. Hardliners continues in power has a huge consequence for oil prices going forward. The regime has played its ’oil-weapon’ (closing or chocking the Strait of Hormuz). It is using it to achieve political goals. Deterrence: it needs to be so politically and economically expensive to attack Iran that it won’t happen again in the future. Or at least that the US/Israel thinks 10-times over before they attack again. The highest Brent crude oil closing price since the start of the war is $112.19/b last Friday. In comparison the 20-year inflation adjusted Brent price is $103/b. So Brent crude last Friday at $112.19/b isn’t a shockingly high price. And it is still far below the nominal high of $148/b from 2008 which is $220/b if inflation adjusted. So once in a lifetime Iran activates its most powerful weapon. The oil weapon. It needs to show the power of this weapon and it needs to reap political gains. Getting Brent to $112/b and intraday high of $119.5/b (9 March) isn’t a display of the power of that weapon. And it is not a deterrence against future attacks.
So if the hardliners remain in power in Iran, then the SoH will likely remain chocked all the way to US midterm elections and Brent crude will at a minimum go above the historical nominal high of $148/b from 2008.
Thus the outlook for the oil price for the rest of the year doesn’t depend all that much of whether Trump pulls a TACO or not. Stops bombing or not. It depends more on who is in charge in Iran. If it is the hardliners, then deterrence against future attacks via chocking of the SoH and high oil prices is the likely line of action. It is impacting the world but the Iranian ’oil-weapon’ is directed towards the US president and the the US midterm elections.
If a pragmatic faction gets to power in Iran, then a very prosperous future is possible. However, if power is shifting towards a more pragmatic faction in Iran then a completely different direction could evolve. Such a faction could possibly be open for cooperation with the US and the GCC and possibly put its issues versus Israel aside. Then the prosperity we have seen evolving in Dubai could be a possible future also for Iran.
So far it looks like the hardliners are fully in charge. As far as we can see, the hardliners are still fully in control in Iran. That points towards continued chocking of the SoH and oil prices ticking higher as global inventories (the oil market buffers) are drawn lower. And not just for a few more weeks, but possibly all the way to the US midterm elections.
A brief sigh of relief yesterday as oil infra at Kharg wasn’t damaged. But higher today. Brent crude dabbled around a bit yesterday in relief that oil infrastructure at Iran’s Kharg island wasn’t damaged. It traded briefly below the 100-line and in a range of $99.54 – 106.5/b. Its close was near the low at $100.21/b.
No easy victorious way out for Trump. So no end in sight yet. Brent is up 3.2% today to $103.4/b with no signs that the war will end anytime soon. Trump has no easy way to declare victory and mission accomplished as long as Iran is in full control of the Strait of Hormuz while also holding some 440 kg of uranium enriched to 60% and not far from weapons grade at 90%. As long as these two factors are unresolved it is difficult for Trump to pull out of the Middle East. Naturally he gets increasingly frustrated over the situation as the oil price and US retail gas prices keeps ticking higher while the US is tied into the mess in the Middle East. Trying to drag NATO members into his mess but not much luck there.
When commodity prices spike they spike 2x, 3x, 4x or 5x. Supply and demand for commodities are notoriously inflexible. When either of them shifts sharply, the the price can easily go to zero (April 2022) or multiply 2x, 3x, or even 5x of normal. Examples in case cobalt in 2025 where Kongo restricted supply and the price doubled. Global LNG in 2022 where the price went 5x normal for the full year average. Demand for tungsten in ammunition is up strongly along with full war in the middle east. And its price? Up 537%.
Why hasn’t the Brent crude oil price gone 2x, 3x, 4x or 5x versus its normal of $68/b given close to full stop in the flow of oil of the Strait of Hormuz? We are after all talking about close to 20% of global supply being disrupted. The reason is the buffers. It is fairly easy to store oil. Commercial operators only hold stocks for logistical variations. It is a lot of oil in commercial stocks, but that is predominantly because the whole oil system is so huge. In addition we have Strategic Petroleum Reserves (SPRs) of close to 2500 mb of crude and 1000 mb of oil products. The IEA last week decided to release 400 mb from global SPR. Equal to 20 days of full closure of the Strait of Hormuz. Thus oil in commercial stocks on land, commercial oil in transit at sea and release of oil from SPRs is currently buffering the situation.
But we are running the buffers down day by day. As a result we see gradually increasing stress here and there in the global oil market. Asia is feeling the pinch the most. It has very low self sufficiency of oil and most of the exports from the Gulf normally head to Asia. Availability of propane and butane many places in India (LPG) has dried up very quickly. Local prices have tripled as a result. Local availability of crude, bunker oil, fuel oil, jet fuel, naphtha and other oil products is quickly running down to critical levels many places in Asia with prices shooting up. Oman crude oil is marked at $153/b. Jet fuel in Singapore is marked at $191/b.
Oil at sea originating from Strait of Hormuz from before 28 Feb is rapidly emptied. Oil at sea is a large pool of commercial oil. An inventory of oil in constant move. If we assume that the average journey from the Persian Gulf to its destinations has a volume weighted average of 13.5 days then the amount of oil at sea originating from the Persian Gulf when the the US/Israel attacked on 28 Feb was 13.5 days * 20 mb/d = 269 mb. Since the strait closed, this oil has increasingly been delivered at its destinations. Those closest to the Strait, like Pakistan, felt the emptying of this supply chain the fastest. Propane prices shooting to 3x normal there already last week and restaurants serving cold food this week is a result of that. Some 50-60% of Asia’s imports of Naphtha normally originates from the Persian Gulf. So naphtha is a natural pain point for Asia. The Gulf also a large and important exporter of Jet fuel. That shut in has lifted jet prices above $200/b.
To simplify our calculations we assume that no oil has left the Strait since that date and that there is no increase in Saudi exports from Yanbu. Then the draining of this inventory at sea originated from the Persian Gulf will essentially look like this:
The supply chain of oil at sea originating from the Strait of Hormuz is soon empty. Except for oil allowed through the Strait of Hormuz by Iran and increased exports from Yanbu in the Red Sea. Not included here.

Oil at sea is falling fast as oil is delivered without any new refill in the Persian Gulf. Waivers for Russian crude is also shifting Russian crude to consumers. Brent crude will likely start to feel the pinch much more forcefully when oil at sea is drawn down another 200 mb to around 1000 mb. That is not much more than 10 days from here.

Oil and oil products are starting to become very pricy many places. Brent crude has still been shielded from spiking like the others.


Market Still Betting on Timely Resolution, But Each Day Raises Shortage Risk

Christian Kopfer om läget för oljan

Marknaden måste börja betrakta de höga kopparpriserna som det nya normala

Det fysiska spotpriset på brentolja har slagit nytt rekord

40 minuter med Javier Blas om hur världen verkligen påverkas av energikrisen
40 minuter med Javier Blas om hur världen verkligen påverkas av energikrisen

Elpriserna fördubblas, stor osäkerhet inför sommaren

MP Materials, USA:s svar på Kinas dominans över sällsynta jordartsmetaller
Det fysiska spotpriset på brentolja har slagit nytt rekord

Studsvik har idag ansökt om att få bygga 1200-1600 MW kärnkraft i Valdemarsvik
-
 Nyheter3 veckor sedan
40 minuter med Javier Blas om hur världen verkligen påverkas av energikrisen
-
 Nyheter4 veckor sedan
Elpriserna fördubblas, stor osäkerhet inför sommaren
-
 Nyheter4 veckor sedan
MP Materials, USA:s svar på Kinas dominans över sällsynta jordartsmetaller
-
 Nyheter3 veckor sedan
Det fysiska spotpriset på brentolja har slagit nytt rekord
-
 Nyheter4 veckor sedan
Studsvik har idag ansökt om att få bygga 1200-1600 MW kärnkraft i Valdemarsvik
-
 Nyheter2 veckor sedan
Marknaden måste börja betrakta de höga kopparpriserna som det nya normala
-
Analys4 veckor sedan
TACO (or Whatever It Was) Sends Oil Lower — Iran Keeps Choking Hormuz
-

 Nyheter4 veckor sedan
Matproduktion är beroende av gödsel, Gulfkriget skapar brist