

Analys
SEB Råvarubrev 10 april 2018

 Ökande geopolitiska risker.
MARKNADEN I KORTHET
Turkiets aktiviteter i Syrien, hotet om ett handelskrig, USA’s hot om repressalier mot Assad-regimen (och dess allierade) samt de nya amerikanska sanktionerna mot ryska intressen har helt klart ökat de geopolitiska riskerna. De två mest påverkade råvarorna (aluminium och olja) har följaktligen också stigit i pris. Rubeln och den ryska börsen har fallit ordentligt. Gällande ekonomisk statistik så har inköpschefsstatistiken varit överraskande svag och framför allt så i Europa. Sammantaget så är framtidsutsikterna för närvarande väldigt osäkra och därför bör också riskaptiten vara lägre.

Anders Söderberg, Redaktör
Råvaror: Veckans raket är aluminium som efter amerikanska sanktioner mot flera ryska bolag, däribland Rusal (~13 % av världsproduktionen och den största tillverkaren utanför Kina), en av världens största tillverkare, stigit kraftig. Konsumenterna befarar en bristsituation varför det igår var rena rusningen för att täcka näraliggande inköp. De ökade spänningarna i Syrien lyfter också riskpremien i oljan. Har den amerikanska oljeexporten slagit i taket? Hursomhelst så har vissa områden nu nått kapacitetstaket vad gäller pipelines, resulterandes i att olja från vissa områden nu handlas med stor rabatt. Positivt för oljepriset är också den fortsatta nedgången i produktion i Venezuela, även Kina rapporterade att produktionen fallit. Övriga metaller har mer eller mindre fortsatt att konsolidera. Gällande koppar så har ett viktigt löneavtal tecknats mellan Codelco och gruvarbetarna. Lägre strejkrisk bör vara lätt negativt för koppar då marknaden varit orolig för en besvärlig avtalsmarknad i Chile.
Valuta: Dollarindex fortsätter att hoppa fram och tillbaka inom ett relativt snävt intervall och har i princip inte förändrats sedan slutet av januari. SEK har fortsatt att försvagas och NOKSEK tog följaktligen ytterligare ett steg uppåt. Efter dagens lägre än förväntade norska inflationsstatistik så kan det nog vara dags för en paus i uppgången.
Börser: Efter korrektionen högre har marknaden åter börjat visa svaghet. Vi tror fortfarande att det finns mer nedsidesrisk. De flesta börser, utom de amerikanska, handlas nu med ett antal negativa tekniska signaler. Vi är fortsatt mest oroliga för Europa.
Räntor: Obligationsräntorna har under de senaste månadernas oro i många fall handlats ned en bit. Vi ser dock denna nedgång som korrektiv och förväntar oss att räntorna åter börjar stiga så fort världen lugnar ned sig något.
OBSERVATIONER I SAMMANDRAG
- Olja – övervägande positiva faktorer.
- Guld – nytt besök i nedre delen av intervallet?
- USD/SEK – kort paus innan förnyad styrka.
- OMX30 – svag studs indikerar mer svaghet.
En placering i certifikat och warranter är förknippat med risker. Du kan förlora hela ditt investerade kapital. Läs mer om riskerna i SEB:s offentliggjorda Grundprospekt för certifikat- och warrantprogram på seb.se/cert eller seb.se/mini
OLJA BRENT
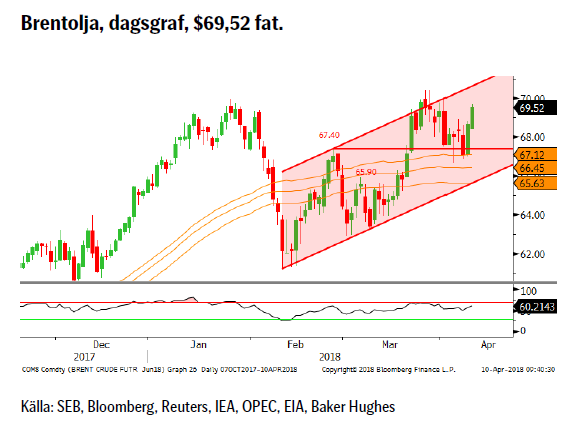 Det ser onekligen ut som om korrektionen ned från marstoppen kan vara avklarad. Den fundamentala bilden är fortsatt positiv med starkt ökande efterfrågan, kraschande produktion i Venezuela, störningar i Libyen, ökad risk för nya amerikanska sanktioner mot Iran (kärnöverenskommelsen upp för revision i USA i maj). Lägg dessutom till att skifferoljeproduktionen i vissa områden nu är större än kapaciteten i pipelinesystemet vilket gör att amerikansk export riskerar att stagnera.
Konklusion: De positiva faktorerna överväger.
OBSERVATIONER
+ Fortsatt fallande lager.
+ Nya störningar i Libysk produktion.
+ Flaskhalsar i amerikanska pipelines.
+ Hökaktigare amerikansk utrikesminister = ökad risk för nya amerikanska sanktioner mot Iran.
+ Ökad politisk spänning Iran/Saudiarabien.
+ Positiva ryska signaler om fortsatt OPEC samarbete.
+ Förlängningen av produktionsbegränsningarna.
+ Geopolitikens återkomst i form av en riskpremie i oljepriset.
+ Långa spekulativa nettopositioner ökar trots all time high.
+ Ökad global efterfrågan och uppreviderad global tillväxt.
+ Produktionen i Venezuela faller och faller och faller.
+ Tekniskt stöd i 55dagars bandet.
– Ökning av antalet borriggar förra veckan.
– Nigerianska aktörer har skruvat upp aktiviteten.
– EIA reviderar åter upp US produktion (10,8–10,9m fpd).
– De stora spekulativa positionerna är fortsatt en nedåtrisk.
– Fortsatt ökning av DUC’s.
– Tekniska negativt om 65.90 skulle passeras.
Tillgängliga certifikat:
BULL OLJA X1, X2, X4, X5, & X10 S
BEAR OLJA X1, X2, X4, X5 & X10 S
GULD
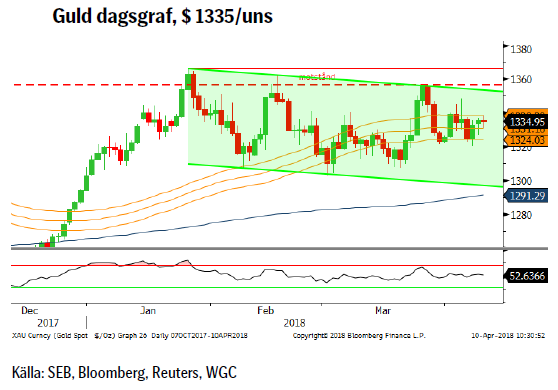 Guldet fortsätter att vara tämligen riktningslöst och sedan uppgången till toppen i januari har vi handlat fram och tillbaka i ett rätt väldefinierat intervall, en konsolidering av den tidigare uppgången. Ska vi följa de tidigare svängningarna så bör vi åter besöka den nedre delen av intervallet dvs. en nedgång om cirka 3 %.
Konklusion: Nytt besök i den lägre delen av intervallet?
OBSERVATIONER
+ Ökad geopolitisk risk (Mellanöstern & USA’s nya sanktioner mot Ryssland).
+ Risken för en ny nedgångsfas på börserna kvarstår.
+ Stigande kostnadsgolv.
+ ETF marknaden fortsätter att vara nettoköpare.
– Indisk import ned kvartal 1 jämfört med 2017.
– Den långa spekulativa nettopositionen faller.
– Antalet korta spekulativa kontrakt ökar och långa faller.
– Guld är dyrt i guld/silver förhållandet.
– Tekniskt negativt att vi gång efter annan stöts bort från motståndsområdet.
Tillgängliga certifikat:
BULL GULD X1, X2, X4, X5 & X10 S
BEAR GULD X1, X2, X4, X5 & X10 S
USD/SEK
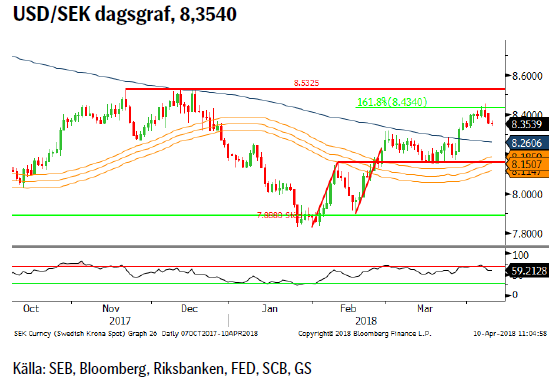 I princip är det kronförsvagningen som stått för lejonparten av uppgången i USDSEK. Då både EURSEK (kanaltaket) och USDSEK (161,8 % punkten av den första uppgången) nått temporära mål kan nog en mindre korrektion/konsolidering vara på sin plats. Därefter bör de underliggande drivkrafterna fortsätta att trycka upp USDSEK mot nästa motstånd.
Konklusion: Mindre konsolidering innan fortsatt uppgång.
OBSERVATIONER
+ ”Brist” på dollar i kort räntemarknad kan leda till även press uppåt för dollarkursen.
+ Repatrieringen (till USA) av de amerikanska företagens utomlands placerade valutor.
+ Valet i Sverige börjar ses som en kronrisk.
+ Fortsatt oro över svensk bostadsmarknad.
+ Små exportberoende länder mår inte bra av tullar o tariffer.
+ En något mjukare Riksbank.
+ Inflationen är så sakteliga i stigande i USA varför marknaden nu börjar prisa in fyra snarare än tre höjningar under 2018.
+ Fram tills Riksbanken gör sin första höjning kommer räntedifferensen USA – Sverige att öka.
+ Feds minskning av balansräkningen.
+ Tekniskt sett positivt med brottet över 233d mv och att 55d bandet svängt till positiv lutning.
– Den spekulativa nettolånga €/$ positionen fortsatt oroande stor men har börjat minska något.
– Atlanta FED indikatorn för amerikansk BNP har fallit snabbt fallit tillbaka.
– Överoptimism över det amerikanska skattepaketet.
– Oro över den växande amerikanska statsskulden.
– Ökat budgetunderskott och därigenom ökad upplåning i USA.
– Fallande dollar trend.
– Teknisk indikation om mindre rekyl.
Tillgängliga certifikat:
BULL USD/SEK X1 & X4 S
BEAR USD/SEK X1 & X4 S
OMXS30
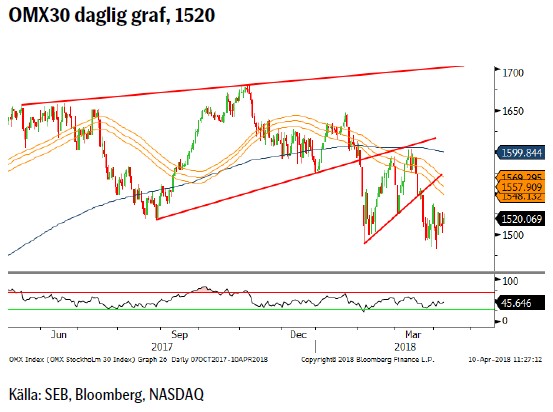 Med 1524 stödet, som vi pekade på för några veckor sedan, ur vägen så bör nu vägen vara fri för ytterligare nedgång. För att minska på nedåtriskerna måste vi se en återetablering ovanför 55dagars bandet.
Konklusion: Svag studs öppnar för mer nedgång.
OBSERVATIONER
+ Stark svenska arbetsmarknadsstatistik.
+ Viss återhämtning av bostadsmarknaden (SEB Boprisindikator tillbaka på plus dvs. antalet som förväntar sig stigande priser är fler än de som tror på fortsatt fallande).
+ Mjuk Riksbank väntar med första höjningen och fortsatt låg inflation stödjer den bilden.
+ Det långsiktiga vågmönstret är fortsatt positivt.
– Börsklimatet generellt fortsatt svajigt.
– Amerikansk protektionism ett växande hot.
– Fortsatt risk för svensk bomarknad (och fallande nybyggnation slår mot tillväxten).
– PMI vände åter ned.
– Vi har brutit under både 55d mv bandet och 233d mv och båda har en negativ lutning.
– En negativ månadsvändningssignal i november.
– Vi har nu ett, 55/233d, dödskors på plats (precis som 2000, 2006 (falskt alarm), 2007, 2011, 2015 och 2018).
– Vidgningen mellan 55 bandet och 233d mv (som även svängt till negativ lutning) visar på gott moment i nedgång.
– Etablerat mönster av lägre toppar och bottnar.
Tillgängliga certifikat:
BULL OMX X5, X10 & X15 S
BEAR OMX X1, X5, X10 & X15 S
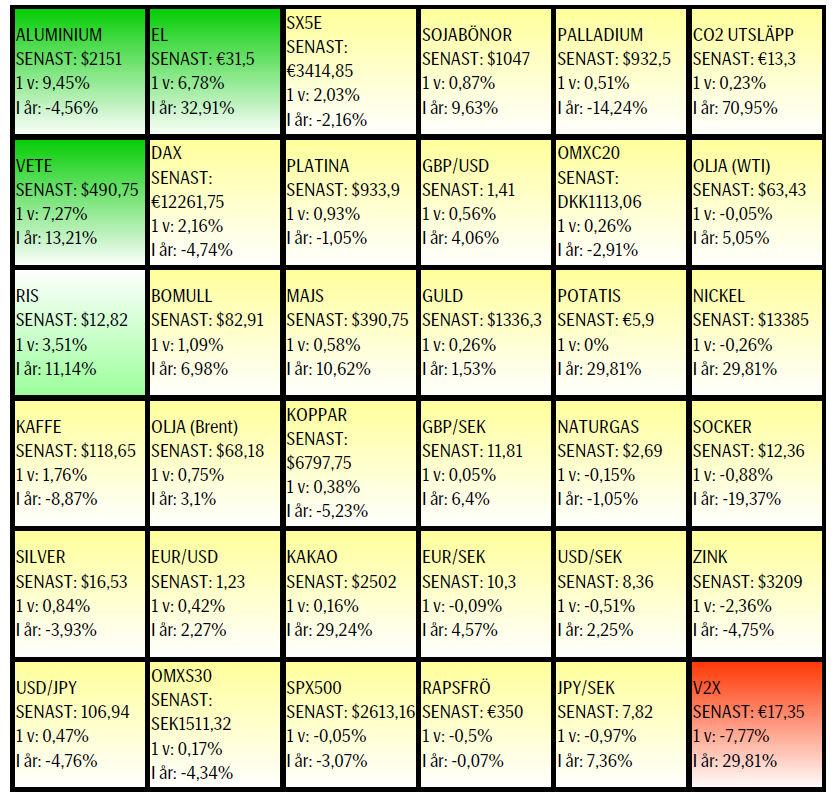
UTVECKLING SENASTE VECKAN SAMT SEDAN ÅRETS BÖRJAN
[box]SEB Veckobrev Veckans råvarukommentar är producerat av SEB:s Commodities Sales desk och publiceras i samarbete och med tillstånd på Råvarumarknaden.se[/box]
KÄLLOR
Bloomberg, Reuters, SEB
VILLKOR
För varje enskilt certifikat/mini future finns Slutliga Villkor som anger de fullständiga villkoren. Slutliga Villkor finns tillgängligt på kurssidan för respektive certifikat/mini future på www.seb.se, Börs & finans, fliken Strukturerade placeringar.
RISKER
En sammanfattning av de risker som är förknippade med Börshandlade certifikat generellt finns i Produktbroschyren för respektive certifikat eller mini future som är tillgängligt på seb.se/cert respektive seb.se/mini. För en fullständig bild av riskerna behöver du ta del av SEB:s offentliggjorda Grundprospekt för Certifikat- och Warrantprogram som är publicerat på www.seb.se/cert respektive seb.se/mini.
DISCLAIMER
Detta marknadsföringsmaterial, framtaget av SEB:s Commodities Sales desk, har upprättats enbart i informationssyfte.
Även om innehållet är baserat på källor som SEB bedömt som tillförlitliga ansvarar SEB inte för fel eller brister i informationen. Den utgör inte oberoende, objektiv investeringsanalys och skyddas därför inte av de bestämmelser som SEB har infört för att förebygga potentiella intressekonflikter. Yttranden från SEB:s Commodities Sales desk kan vara oförenliga med tidigare publicerat material från SEB, då den senare hänvisas uppmanas du att läsa den fullständiga rapporten innan någon åtgärd vidtas.
Dokumentationen utgör inte någon investeringsrådgivning och tillhandahålls till dig utan hänsyn till dina investeringsmål. Du uppmanas att självständigt bedöma och komplettera uppgifterna i denna dokumentation och att basera dina investeringsbeslut på material som bedöms erforderligt. Alla framåtblickande uttalanden, åsikter och förväntningar är föremål för risker, osäkerheter och andra faktorer och kan orsaka att det faktiska resultatet avviker väsentligt från det förväntade. Historisk avkastning är ingen garanti för framtida resultat. Detta dokument utgör inte ett erbjudande att teckna några värdepapper eller andra finansiella instrument. SEB svarar inte för förlust eller skada – direkt eller indirekt, eller av vad slag det vara må – som kan uppkomma till följd av användandet av detta material eller dess innehåll.
Observera att det kan förekomma att SEB, dess ledamöter, dess anställda eller dess moder- och/eller dotterbolag vid olika tillfällen innehar, har innehaft eller kommer att inneha aktier, positioner, rådgivningsuppdrag i samband med corporate finance-transaktioner, investment- eller merchantbanking-uppdrag och/eller lån i de bolag/finansiella instrument som nämns i materialet.
Materialet är avsett för mottagaren, all spridning, distribuering mångfaldigande eller annan användning av detta meddelande får inte ske utan SEB:s medgivande. Materialet riktar sig inte till personer vars medverkan kräver ytterligare prospekt, registrerings- eller andra åtgärder än vad som följer av svensk rätt. Det åligger var och en att iaktta sådana restriktioner. Materialet får inte distribueras i eller till land där distribution kräver ovan nämnda åtgärder eller strider mot reglering i sådant land. Materialet riktar sig således inte till fysiska eller juridiska personer hemmahörande i USA eller i något annat land där publicering eller tillhandahållande av materialet är förbjudet eller strider mot tillämpliga bestämmelser i landet.
Oaktat detta får SEB tillåta omfördelning av materialet till utvald tredje part i enlighet med gällande avtal. Materialet får inte spridas till fysiska eller juridiska personer som är medborgare eller har hemvist i ett land där sådan spridning är otillåten enligt tillämplig lag eller annan bestämmelse.
Skandinaviska Enskilda Banken AB (publ) är ett publikt aktiebolag och står under tillsyn av Finansinspektionen samt de lokala finansiella tillsynsmyndigheter i varje jurisdiktionen där SEB har filial eller dotterbolag.
Parts of the Brent crude curve dipping into the high $50ies/b. Brent crude fell 2.3% over the week to Friday. It closed the week at $61.29/b, a slight gain on the day, but also traded to a low of $60.14/b that same day and just barely avoided trading into the $50ies/b. This morning it is risk-on in equities which seems to help industrial metals a little higher. But no such luck for oil. It is down 0.8% at $60.8/b. This week looks set for Brent crude to dip its feet in the $50ies/b. The Brent 3mth contract actually traded into the high $50ies/b on Friday.

The front-end backwardation has been on a weakening foot and is now about to fully disappear. The lowest point of the crude oil curve has also moved steadily lower and lower and its discount to the 5yr contract is now $6.8/b. A solid contango. The Brent 3mth contract did actually dip into the $50ies/b intraday on Friday when it traded to a low point of $59.93/b.
More weakness to come as lots of oil at sea comes to ports. Mid-East OPEC countries have boosted exports along with lower post summer consumption and higher production. The result is highly visibly in oil at sea which increased by 17 mb to 1,311 mb over the week to Sunday. Up 185 mb since mid-August. On its way to discharge at a port somewhere over the coming month or two.
Don’t forget that the oil market path ahead is all down to OPEC+. Remember that what is playing out in the oil market now is all by design by OPEC+. The group has decided that the unwind of the voluntary cuts is what it wants to do. In a combination of meeting demand from consumers as well as taking back market share. But we need to remember that how this plays out going forward is all at the mercy of what OPEC+ decides to do. It will halt the unwinding at some point. It will revert to cuts instead of unwind at some point.
A few months with Brent at $55/b and 40-50 US shale oil rigs kicked out may be what is needed. We think OPEC+ needs to see the exit of another 40-50 drilling rigs in the US shale oil patches to set US shale oil production on a path to of a 1 mb/d year on year decline Dec-25 to Dec-26. We are not there yet. But a 2-3 months period with Brent crude averaging $55/b would probably do it.
Oil on water increased 17 mb over the week to Sunday while oil in transit increased by 23 mb. So less oil was standing still. More was moving.

Crude oil floating storage (stationary more than 7 days). Down 11 mb over week to Sunday

The lowest point of the Brent crude oil curve versus the 5yr contract. Weakest so far this year.

Crude oil 1mth to 3mth time-spreads. Dubai held out strongly through summer, but then that center of strength fell apart in late September and has been leading weakness in crude curves lower since then.

Rebounding along with most markets. But concerns over solidity of Gaza peace may also contribute. Brent crude fell 0.8% yesterday to $61.91/b and its lowest close since May this year. This morning it is bouncing up 0.9% to $62.5/b along with a softer USD amid positive sentiment with both equities and industrial metals moving higher. Concerns that the peace in Gaza may be less solid than what one might hope for also yields some support to Brent. Bets on tech stocks are rebounding, defying fears of trade war. Money moving back into markets. Gold continues upwards its strong trend and a softer dollar helps it higher today as well.
US crude & products probably rose 5.6 mb last week (API) versus a normal seasonal decline of 2.4 mb. The US API last night partial and thus indicative data for US oil inventories. Their data indicates that US crude stocks rose 7.4 mb last week, gasoline stocks rose 3.0 mb while Distillate stocks fell 4.8 mb. Altogether an increase in commercial crude and product stocks of 5.6 mb. Commercial US crude and product stocks normally decline by 2.4 mb this time of year. So seasonally adjusted the US inventories rose 8 mb last week according to the indicative numbers by the API. That is a lot. Also, the counter seasonal trend of rising stocks versus normally declining stocks this time of year looks on a solid pace of continuation. If the API is correct then total US crude and product stocks would stand 41 mb higher than one year ago and 6 mb higher than the 2015-19 average. And if we combine this with our knowledge of a sharp increase in production and exports by OPEC(+) and a large increase in oil at sea, then the current trend in US oil inventories looks set to continue. So higher stocks and lower crude oil prices until OPEC(+) switch to cuts. Actual US oil inventory data today at 18:00 CET.
US commercial crude and product stocks rising to 1293 mb in week 41 if last nights indicative numbers from API are correct.

Crude oil soon coming to a port near you. OPEC has lifted production sharply higher this autumn. At the same time demand for oil in the Middle-East has fallen as we have moved out of summer heat and crude oil burn for power for air-conditioning. The Middle-East oil producers have thus been able to lift exports higher on both accounts. Crude oil and condensates on water has shot up by 177 mb since mid-August. This oil is now on its way to ports around the world. And when they arrive, it will likely help to lift stocks onshore higher. That is probably when we will lose the last bit of front-end backwardation the the crude oil curves. That will help to drive the front-month Brent crude oil price down to the $60/b line and revisit the high $50ies/b. Then the eyes will be all back on OPEC+ when they meet in early November and then again in early December.
Crude oil and condensates at sea have moved straight up by 177 mb since mid-August as OPEC(+) has produced more, consumed less and exported more.

When it starts to move lower it moves rather quickly. Gaza, China, IEA. Brent crude is down 2.1% today to $62/b after having traded as high as $66.58/b last Thursday and above $70/b in late September. The sell-off follows the truce/peace in Gaze, a flareup in US-China trade and yet another bearish oil outlook from the IEA.
A lasting peace in Gaze could drive crude oil at sea to onshore stocks. A lasting peace in Gaza would probably calm down the Houthis and thus allow more normal shipments of crude oil to sail through the Suez Canal, the Red Sea and out through the Bab-el-Mandeb Strait. Crude oil at sea has risen from 48 mb in April to now 91 mb versus a pre-Covid normal of about 50-60 mb. The rise to 91 mb is probably the result of crude sailing around Africa to be shot to pieces by the Houthis. If sailings were to normalize through the Suez Canal, then it could free up some 40 mb in transit at sea moving onshore into stocks.
The US-China trade conflict is of course bearish for demand if it continues.
Bearish IEA yet again. Getting closer to 2026. Credibility rises. We expect OPEC to cut end of 2025. The bearish monthly report from the IEA is what it is, but the closer we get to 2026, the more likely the IEA is of being ball-park right in its outlook. In its monthly report today the IEA estimates that the need for crude oil from OPEC in 2026 will be 25.4 mb/d versus production by the group in September of 29.1 mb/d. The group thus needs to do some serious cutting at the end of 2025 if it wants to keep the market balanced and avoid inventories from skyrocketing. Given that IEA is correct that is. We do however expect OPEC to implement cuts to avoid a large increase in inventories in Q1-26. The group will probably revert to cuts either at its early December meeting when they discuss production for January or in early January when they discuss production for February. The oil price will likely head yet lower until the group reverts to cuts.
Dubai: The Mid-East anchor dragging crude oil lower. Surplus emerging in Mid-East pricing. Crude oil prices held surprisingly strong all through the summer. A sign and a key source of that strength came from the strength in the front-end backwardation of the Dubai crude oil curve. It held out strong from mid-June and all until late September with an average 1-3mth time-spread premium of $1.8/b from mid-June to end of September. The 1-3mth time-spreads for Brent and WTI however were in steady deterioration from late June while their flat prices probably were held up by the strength coming from the Persian Gulf. Then in late September the strength in the Dubai curve suddenly collapsed. Since the start of October it has been weaker than both the Brent and the WTI curves. The Dubai 1-3mth time-spread now only stands at $0.25/b. The Middle East is now exporting more as it is producing more and also consuming less following elevated summer crude burn for power (Aircon) etc.
The only bear-element missing is a sudden and solid rise in OECD stocks. The only thing that is missing for the bear-case everyone have been waiting for is a solid, visible rise in OECD stocks in general and US oil stocks specifically. So watch out for US API indications tomorrow and official US oil inventories on Thursday.
No sign of any kind of fire-sale of oil from Saudi Arabia yet. To what we can see, Saudi Arabia is not at all struggling to sell its oil. It only lowered its Official Selling Prices (OSPs) to Asia marginally for November. A surplus market + Saudi determination to sell its oil to the market would normally lead to a sharp lowering of Saudi OSPs to Asia. Not yet at least and not for November.
The 5yr contract close to fixed at $68/b. Of importance with respect to how far down oil can/will go. When the oil market moves into a surplus then the spot price starts to trade in a large discount to the 5yr contract. Typically $10-15/b below the 5yr contract on average in bear-years (2009, 2015, 2016, 2020). But the 5yr contract is usually pulled lower as well thus making this approach a moving target. But the 5yr contract price has now been rock solidly been pegged to $68/b since 2022. And in the 2022 bull-year (Brent spot average $99/b), the 5yr contract only went to $72/b on average. If we assume that the same goes for the downside and that 2026 is a bear-year then the 5yr goes to $64/b while the spot is trading at a $10-15/b discount to that. That would imply an average spot price next year of $49-54/b. But that is if OPEC doesn’t revert to cuts and instead keeps production flowing. We think OPEC(+) will trim/cut production as needed into 2026 to prevent a huge build-up in global oil stocks and a crash in prices. But for now we are still heading lower. Into the $50ies/b.


Australien och USA investerar 8,5 miljarder USD för försörjningskedja av kritiska mineraler
Brent crude set to dip its feet into the high $50ies/b this week

Vad guldets uppgång egentligen betyder för världen

Spotpriset på guld över 4300 USD och silver över 54 USD
Crude oil soon coming to a port near you

OPEC+ missar produktionsmål, stöder oljepriserna

Ett samtal om guld, olja, fjärrvärme och förnybar energi

Goldman Sachs höjer prognosen för guld, tror priset når 4900 USD
Guld nära 4000 USD och silver 50 USD, därför kan de fortsätta stiga

Blykalla och amerikanska Oklo inleder ett samarbete
-
 Nyheter3 veckor sedan
OPEC+ missar produktionsmål, stöder oljepriserna
-
 Nyheter4 veckor sedan
Ett samtal om guld, olja, fjärrvärme och förnybar energi
-
 Nyheter2 veckor sedan
Goldman Sachs höjer prognosen för guld, tror priset når 4900 USD
-
 Nyheter3 veckor sedan
Guld nära 4000 USD och silver 50 USD, därför kan de fortsätta stiga
-
 Nyheter3 veckor sedan
Blykalla och amerikanska Oklo inleder ett samarbete
-
Analys4 veckor sedan
Are Ukraine’s attacks on Russian energy infrastructure working?
-

 Nyheter4 veckor sedan
Guldpriset uppe på nya höjder, nu 3750 USD
-
Nyheter3 veckor sedan
Ett samtal om guld, olja, koppar och stål