

Analys
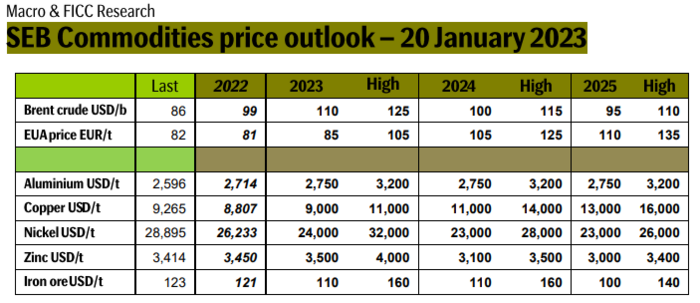
SEB Metals Weekly: China Covid exit is bullish for metals

China Covid exit is bullish for metals
Softer inflation, slight macro-optimism, and China taking a rapid exit from Covid restrictions. Markets have become more optimistic. Inflation indices have eased and that has created some hopes that central banks won’t lift interest to a level that will kill the economy in 2023. Natural gas prices in Europe have fallen sharply. This has suddenly reduced energy-inflationary pressure and removed the direst downside economic risks for the region. But general market optimism is far from super-strong yet. The S&P 500 index has only gained 1.9% since our previous forecast on 1 Nov 2021, and oil prices are down nearly 10% in a reflection of concerns for global growth. China has however removed all Covid-restrictions almost overnight. It is now set to move out of its three years of Covid-19 isolation and lockdowns at record speed. Industrial metals are up 20% and the Hong Kong equity index is up 40% as a result (since 1 Nov-22). China’s sudden and rapid Covid-19 exit is plain and simply bullish for the Chinese economy to the point that mobility indices are already rebounding quickly. SEB’s general view is that inflation impulses will fade quickly. No need then for central banks across the world to kill the global economy with further extreme rate hikes. These developments have removed much of the downside price risks for metals in 2023 and we have to a large degree shifted our 2024 forecast to 2023.
Lower transparency, more geopolitics, more borders, and higher prices and exponential spikes. The first decade of this century was about emerging markets, the BRICs, the commodity price boom, the commodity investment boom, and free markets with free flow of commodities and labor with China and Russia hand in hand with western countries walking towards the future. High capex spending in the first decade led to plentiful supply and low prices for commodities from 2011 to 2020. A world of plenty, friends everywhere, free flow of everything, and no need to worry. The coming decade will likely be very different. Supply growth will struggle due to mediocre capex spending over the past 10 years. Prices will on average be significantly higher. There will be frequent exponential price spikes whenever demand hits supply barriers. Price transparency will be significantly reduced due to borders, taxes, sanctions, geopolitical alignments, and carbon intensities. Prices will be much less homogenous. Aluminium will no longer be just one price and one quality. Who made it, where was it made, where will it be consumed and what the carbon content will create a range of prices. Same for most other metals.
Copper: Struggling supply and China revival propel copper prices higher. Unrest in Peru is creating significant supply risks for copper as the country accounts for 10% of the global supply. Chile accounts for 27% of global production. Production there is disappointing with Codelco, the Chilean state-owned copper mining company, struggling to hit production targets. The Cobre Panama mine in Panama is at risk of being closed over a tax dispute between Quantum and the government. Cobre Panama is one of the biggest new mines globally over the past 10 years. The rapid exit from Covid restrictions in China is bullish for the Chinese economy and thus for copper demand and it has helped to propel prices higher along with the mentioned supply issues. The Chinese property market will continue to struggle, and it normally accounts for 20% of global copper demand while China accounted for 55% of global copper demand in 2021. While China is no longer prioritizing the housing market it is full speed ahead for solar, wind, EVs, and electrification in general. So, weakening Chinese copper demand from housing will likely be replaced by the new prioritized growth sectors. Global supply growth is likely going to be muted in the decade to come while demand growth will be somewhere between a normal 3% pa. to a strong 4% pa. to a very strong 5% pa. Copper prices will be high, and demand will hit the supply barrier repeatedly with exponential spikes as the world is working hard to accelerate the energy transition. Copper prices could easily spike to USD 15-16,000/ton nearest years.
Nickel: Tight high-quality nickel market but a surplus for a low-quality nickel. Nickel production is growing aggressively in Indonesia. The country is projected to account for 60-70% of global supply in 2030. This will become a huge and extremely concentrated geopolitical risk for the world’s consumers of nickel. Indonesia has an abundance of low-grade C2 nickel. The challenge is to convert low-quality C2 nickel to high-quality C1. We are set for a surplus of C2 nickel but the market for C1 nickel will depend strongly on the conversion capacity for C2 to C1. Low price transparency will also help to send prices flying between USD 20,000/ton and USD 30,000/ton. Strong growth in nickel production in Indonesia should initially call for prices down to USD 20,000/ton. But Indonesia is a price setter. It will account for 50% of global supply in 2023. It doesn’t make sense for Indonesia to kill the nickel price. If the nickel price drops, then Indonesia could quickly regulate supply. There should be a premium to nickel due to this. As a result, we expect the nickel price to average USD 24,000/ton in 2023. C2 to C1 conversion capacity may be strained and there should also be a monopoly premium due to the size of Indonesia. Converting C2 to C1 is however extremely carbon intensive and that could be an increasing issue in the years to come.
Zinc: Super-tight global market. European LME inventories are ZERO and zinc smelters there are still closed. European zinc smelters account for 16% of global zinc smelter capacity. Most of this was closed over the past year due to extremely high energy prices. European LME zinc stockpiles are now down to a stunning zero! The global zinc market is extremely tight. Reopening of European zinc smelting seems unlikely in H1-23 with a continued super-tight market as a result both in Europe and globally.
Aluminium: Price likely to be in the range of USD 2400 – 3200/ton and line with coal prices in China. Aluminium prices have historically been tightly tied to the price of coal. But coal prices have been all over the place since the start of 2021 with huge price differences between Amsterdam, Australia, and domestic Chinese coal prices which are now largely state-controlled. China banning imports of Australian coal, the Chinese energy crisis in 2021, and Russia’s invasion of Ukraine in 2022 are ingredients here. This sent aluminium prices flying high and low. Coal prices in China today imply a price of aluminium between USD 2400/ton and 3150/ton with the LME 3mth aluminium price nicely in between at USD 2590/ton. The global coal market should now become more orderly as China now again is accepting Australian coal. Energy costs have fallen sharply in Europe and some producers in the Netherlands have talked about possible restarts of production. China is likely to reduce its exports of primary aluminium. Energy security of supply is high on the agenda in China, and it makes no sense to emit lots of CO2 in China and indirectly export energy in the form of primary aluminium. Growth in non-China aluminium demand in the years to come will have to be covered by non-China producers which have the potential to force prices higher and away from coal as the price driver. While LME has one price for the 3mth aluminium price we’ll likely get larger and larger price differences across the world in the form of possibly extreme price premiums for example in the EU and the US.
Market is starting to take US/Iran headlines with a pinch of salt. Brent crude rose $2.8/b yesterday to an official close of $112.1/b. But after that it traded as low as $108.05/b before ending late night at around $109.7/b. Through the day it traded in a range of $106.87 – 112.72/b amid a flurry of news or rumors from Iran and the US. ”US temporary sanctions during negotiations” (falls alarm). ”We will bomb Iran” (not anyhow),… etc. While the market is still fluctuating to this kind of news flow, it is starting to take such headlines with a pinch of salt.

We’ll see. Maybe, maybe not. The Brent M1 contract is trading at $110.2/b this morning which very close to the average ticks through yesterday of $110.4/b.
Trump with bearish, verbal intervention whenever Brent trades above $110/b it seems. What seems to be a pattern is that Trump states something like ”very good negotiations going on with Iran”, ”New leaders in Iran are great,..”, ”Great progress in negotiations,…”, ”Deal in sight,..” etc whenever the Brent M1 contract trades above $110/b. An effort to cool the market. These hot air verbal interventions from Trump used to have a heavy bearish impact on prices, but they now seems to have less and less effect unless they are backed by reality.
As far as we can see there has been no real progress in the negotiations between the US and Iran with both sides still standing by their previous demands.
Iran is getting stronger while the cease fire lasts making a return to war for Trump yet harder. Iran is naturally in constant preparation for a return to war given Trump’s steady threats of bombing Iran again. Iran is naturally doing what ever is possible to prepare for a return to war. And every day the cease fire lasts it is better prepared. This naturally makes it more and more difficult and dangerous for the US to return to warring activity versus Iran as the consequences for energy infrastructure in the Persian Gulf will be more and more severe the longer the cease fire lasts. Israel seems to see it this way as well. That the war is not won and that current frozen state of a cease fire gives Iran opportunity to rebuild military and politically.
Global inventories are drawing down day by day. How much? In the meantime the Strait of Hormuz stays closed. There is varying measures and estimates of how much global inventories are drawing down. Our rough estimate, back of the envelope, is that global inventories are drawing down by at least some 10 mb/d or about 300 mb/d in a balance between loss of supply versus demand destruction. Other estimates we see are a monthly draw of 250-270 mb/d. The IEA only ’measured’ a draw in global observable stocks of 117 mb in April with oil on water rising 53 mb while on shore stocks fell 170 mb. But global stocks are hard to measure with large invisible, unmeasured stocks. As such a back of the envelope approach may be better.
Oil products is what the world is consuming. Oil product prices likely to rise while product stocks fall. Strategic Petroleum Reserves (SPR) are predominantly crude oil. Discharging oil from OECD SPR stocks, a sharp reduction in Chinese crude imports and a reduction in global refinery throughput of 6-7 mb/d has helped to keep crude oil markets satisfactorily supplied. But global inventories are drawing down none the less. And oil products is really what the world is consuming. So if global refinery throughput stays subdued, then demand will eventually have to match the supply of oil products. The likely path forward this summer is a steady draw down in jet fuel, diesel and gasoline. Higher prices for these. Then, if possible, higher refinery throughput and higher usage of crude in response to very profitable refinery margins. And lastly sharper draw in crude stocks and higher prices for these. But some 6 mb/d of oil products used to be exported through the Strait of Hormuz. And it may not be so easy to ramp up refinery activity across the world to compensate. Especially as Ukraine continues to damage Russian refineries as well as Russian crude production and export facilities.
Watch oil product stocks and prices as well as Brent calendar 2027. What to watch for this summer is thus oil product inventories falling and oil product premiums to crude rising. Another measure to watch is the Brent crude 2027 contract as it rises steadily day by day as the Strait of Hormuz stays closed and global oil inventories decline. The latter is close to the highest level since the start of the war and keeps rising.
The Brent M1 contract and the Brent 2027 prices and current price of jet fuel in Europe (ARA). All in USD/b

Our back of the envelope calculation of the global shortage created by the closure of the Strait of Hormuz. Note that 3.5 mb/d of discharge from SPR is also a draw. Note also that ’Forced demand loss’ of 2.5 mb/d is probably temporary and will fall back towards zero as logistics are sorted out leaving ’Price demand loss’ to do the job of balancing the market. Thus a shortfall of at least 9 mb/d created by the closure. More if SPR discharge is included and more if Forced demand loss recedes.

Brent is climbing higher. Front-month is at USD 106.3/bl this morning, close to a weekly high and a USD 9/bl jump from Mondays open. This is the move we flagged as a risk earlier in the week: the market shifting from ”a deal is around the corner” to ”this is going to take longer than we thought”.

Analyst Commodities, SEB
During April, rest-of-year Brent remained remarkably stable around USD 90/bl. A stability which rested on one single assumption: the SoH reopens around 1 May. That assumption is now slowly falling apart.
As we highlighted yesterday: every week of delay beyond 1 May adds (theoretically) ish USD 5/bl to the rest-of-year average, as global inventories draw 100 million barrels per week. i.e., a mid-May reopening implies rest-of-year Brent closer to USD 100/bl, and anything pushing into June or July takes us meaningfully higher.
What’s changed in the last 48 hours:
#1: The US military has formally warned that clearing suspected sea mines from SoH could take up to six months. That is a completely different timescale from what the financial market is pricing. Even a political deal tomorrow does not immediately reopen the strait.
#2: Trump has shifted his tone from urgency to ”strategic patience”. In yesterday’s press conference: ”Don’t rush me… I want a great deal.” The market is reading this as a president no longer feeling pressured by timelines, with the naval blockade running in the background.
#3: So far, the military activity is escalating, not de-escalating. Axios reports Iran is laying more mines in SoH. The US 3rd carrier strike group (USS George H.W. Bush) is arriving with two countermine vessels. Trump yesterday ordered the US Navy to destroy any Iranian boats caught laying mines. While CNN reports that the Pentagon is actively drawing up plans to strike Iranian SoH capabilities and individual Iranian military leaders if the ceasefire collapses. i.e., NOT a attitude consistent with an imminent deal!
Spot crude and product prices eased off the early-April highs on a combination of system rerouting and deal optimism. Both now weakening. Goldman estimates April Gulf output is reduced by 14.5 mbl/d, or 57% of pre-war supply, a number that keeps getting worse the longer this drags on.
Demand-side adaptation is ongoing: S. Korea has cut its Middle East crude dependence from 69% to 56% by pulling more from the Americas and Africa, and Japan is kicking off a second round of SPR releases from 1 May. But SPRs are finite.
Ref. to the negotiations, we should not bet on speed. The current Iranian leadership is dominated by genuine hardliners willing to absorb economic pain and run the clock to extract concessions. That is not a setup for a rapid resolution. US/Israeli media briefings keep framing the delay as ”internal Iranian divisions”, the reality is more complicated and points toward weeks and months, not days.
Our point is that the complexity is large, and higher prices have only just started (given a scenario where the negotiations drag out in time). The market spent April leaning on the USD 90/bl rest-of-year assumption; that case is diminishing by the hour. If ”early May reopening” is replaced by ”June, July or later” over the next week or two, both crude and products have meaningful room to reprice higher from here. There is a high risk being short energy and betting on any immediate political resolution(!).
Down on Friday. Up on Monday. The Brent June crude oil contract traded down 5.1% last week to a close of $90.38/b. It reached a high of $103.87/b last Monday and a low of $86.09/b on Friday as Iran announced that the Strait of Hormuz was fully open for transit. That quickly changed over the weekend as the US upheld its blockade of Iranian oil exports while Iran naturally responded by closing the SoH again. The US blew a hole in the engine room of the Iranian ship TOUSKA and took custody of the ship on Sunday. Brent crude is up 5.6% this morning to $95.4/b.
The cease-fire is expiring tomorrow. The US has said it will send a delegation for a second round of negotiations in Islamabad in Pakistan. But Iran has for now rejected a second round of talks as it views US demands as unrealistic and excessive while the US is also blocking the Strait of Hormuz.
While Brent is up 5% this morning, the financial market is still very optimistic that progress will be made. That talks will continue and that the SoH will fully open by the start of May which is consistent with a rest-of-year average Brent crude oil price of around $90/b with the market now trading that balance at around $88/b.
Financial optimism vs. physical deterioration. We have a divergence where the financial market is trading negotiations, improvements and resolution while at the same time the physical market is deteriorating day by day. Physical oil flows remain constrained by disrupted flows, longer voyage times and elevated freight and insurance costs.
Financial markets are betting that a US/Iranian resolution will save us in time from violent shortages down the road. But every day that the SoH remains closed is bringing us closer to a potentially very painful point of shortages and much higher prices.
The US blockade is also a weapon of leverage against its European and Asian allies. When Iran closed the SoH it held the world economy as a hostage against the US. The US blockade of the SoH is of course blocking Iranian oil exports. But it is also an action of disruption directed towards Europe and Asia. The US has called for the rest of the world to engaged in the war with Iran: ”If you want oil from the Persian Gulf, then go and get it”. A risk is that the US plays brinkmanship with the global oil market directed towards its European and Asian allies and maybe even towards China to force them to engage and take part. Maybe unthinkable. But unthinkable has become the norm with Trump in the White House.


Sommarväder skapar prisrally på elbörsen
Oil product price pain is set to rise as the Strait of Hormuz stays closed into summer

Solkraften pressar elpriserna dagtid

Michel Gubel ger sin syn på oljemarknaden