

Analys
SEB Metals Weekly: China Covid exit is bullish for metals

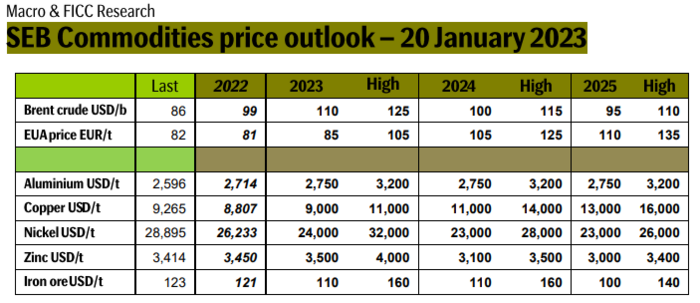
China Covid exit is bullish for metals
Softer inflation, slight macro-optimism, and China taking a rapid exit from Covid restrictions. Markets have become more optimistic. Inflation indices have eased and that has created some hopes that central banks won’t lift interest to a level that will kill the economy in 2023. Natural gas prices in Europe have fallen sharply. This has suddenly reduced energy-inflationary pressure and removed the direst downside economic risks for the region. But general market optimism is far from super-strong yet. The S&P 500 index has only gained 1.9% since our previous forecast on 1 Nov 2021, and oil prices are down nearly 10% in a reflection of concerns for global growth. China has however removed all Covid-restrictions almost overnight. It is now set to move out of its three years of Covid-19 isolation and lockdowns at record speed. Industrial metals are up 20% and the Hong Kong equity index is up 40% as a result (since 1 Nov-22). China’s sudden and rapid Covid-19 exit is plain and simply bullish for the Chinese economy to the point that mobility indices are already rebounding quickly. SEB’s general view is that inflation impulses will fade quickly. No need then for central banks across the world to kill the global economy with further extreme rate hikes. These developments have removed much of the downside price risks for metals in 2023 and we have to a large degree shifted our 2024 forecast to 2023.
Lower transparency, more geopolitics, more borders, and higher prices and exponential spikes. The first decade of this century was about emerging markets, the BRICs, the commodity price boom, the commodity investment boom, and free markets with free flow of commodities and labor with China and Russia hand in hand with western countries walking towards the future. High capex spending in the first decade led to plentiful supply and low prices for commodities from 2011 to 2020. A world of plenty, friends everywhere, free flow of everything, and no need to worry. The coming decade will likely be very different. Supply growth will struggle due to mediocre capex spending over the past 10 years. Prices will on average be significantly higher. There will be frequent exponential price spikes whenever demand hits supply barriers. Price transparency will be significantly reduced due to borders, taxes, sanctions, geopolitical alignments, and carbon intensities. Prices will be much less homogenous. Aluminium will no longer be just one price and one quality. Who made it, where was it made, where will it be consumed and what the carbon content will create a range of prices. Same for most other metals.
Copper: Struggling supply and China revival propel copper prices higher. Unrest in Peru is creating significant supply risks for copper as the country accounts for 10% of the global supply. Chile accounts for 27% of global production. Production there is disappointing with Codelco, the Chilean state-owned copper mining company, struggling to hit production targets. The Cobre Panama mine in Panama is at risk of being closed over a tax dispute between Quantum and the government. Cobre Panama is one of the biggest new mines globally over the past 10 years. The rapid exit from Covid restrictions in China is bullish for the Chinese economy and thus for copper demand and it has helped to propel prices higher along with the mentioned supply issues. The Chinese property market will continue to struggle, and it normally accounts for 20% of global copper demand while China accounted for 55% of global copper demand in 2021. While China is no longer prioritizing the housing market it is full speed ahead for solar, wind, EVs, and electrification in general. So, weakening Chinese copper demand from housing will likely be replaced by the new prioritized growth sectors. Global supply growth is likely going to be muted in the decade to come while demand growth will be somewhere between a normal 3% pa. to a strong 4% pa. to a very strong 5% pa. Copper prices will be high, and demand will hit the supply barrier repeatedly with exponential spikes as the world is working hard to accelerate the energy transition. Copper prices could easily spike to USD 15-16,000/ton nearest years.
Nickel: Tight high-quality nickel market but a surplus for a low-quality nickel. Nickel production is growing aggressively in Indonesia. The country is projected to account for 60-70% of global supply in 2030. This will become a huge and extremely concentrated geopolitical risk for the world’s consumers of nickel. Indonesia has an abundance of low-grade C2 nickel. The challenge is to convert low-quality C2 nickel to high-quality C1. We are set for a surplus of C2 nickel but the market for C1 nickel will depend strongly on the conversion capacity for C2 to C1. Low price transparency will also help to send prices flying between USD 20,000/ton and USD 30,000/ton. Strong growth in nickel production in Indonesia should initially call for prices down to USD 20,000/ton. But Indonesia is a price setter. It will account for 50% of global supply in 2023. It doesn’t make sense for Indonesia to kill the nickel price. If the nickel price drops, then Indonesia could quickly regulate supply. There should be a premium to nickel due to this. As a result, we expect the nickel price to average USD 24,000/ton in 2023. C2 to C1 conversion capacity may be strained and there should also be a monopoly premium due to the size of Indonesia. Converting C2 to C1 is however extremely carbon intensive and that could be an increasing issue in the years to come.
Zinc: Super-tight global market. European LME inventories are ZERO and zinc smelters there are still closed. European zinc smelters account for 16% of global zinc smelter capacity. Most of this was closed over the past year due to extremely high energy prices. European LME zinc stockpiles are now down to a stunning zero! The global zinc market is extremely tight. Reopening of European zinc smelting seems unlikely in H1-23 with a continued super-tight market as a result both in Europe and globally.
Aluminium: Price likely to be in the range of USD 2400 – 3200/ton and line with coal prices in China. Aluminium prices have historically been tightly tied to the price of coal. But coal prices have been all over the place since the start of 2021 with huge price differences between Amsterdam, Australia, and domestic Chinese coal prices which are now largely state-controlled. China banning imports of Australian coal, the Chinese energy crisis in 2021, and Russia’s invasion of Ukraine in 2022 are ingredients here. This sent aluminium prices flying high and low. Coal prices in China today imply a price of aluminium between USD 2400/ton and 3150/ton with the LME 3mth aluminium price nicely in between at USD 2590/ton. The global coal market should now become more orderly as China now again is accepting Australian coal. Energy costs have fallen sharply in Europe and some producers in the Netherlands have talked about possible restarts of production. China is likely to reduce its exports of primary aluminium. Energy security of supply is high on the agenda in China, and it makes no sense to emit lots of CO2 in China and indirectly export energy in the form of primary aluminium. Growth in non-China aluminium demand in the years to come will have to be covered by non-China producers which have the potential to force prices higher and away from coal as the price driver. While LME has one price for the 3mth aluminium price we’ll likely get larger and larger price differences across the world in the form of possibly extreme price premiums for example in the EU and the US.
Rebounding along with most markets. But concerns over solidity of Gaza peace may also contribute. Brent crude fell 0.8% yesterday to $61.91/b and its lowest close since May this year. This morning it is bouncing up 0.9% to $62.5/b along with a softer USD amid positive sentiment with both equities and industrial metals moving higher. Concerns that the peace in Gaza may be less solid than what one might hope for also yields some support to Brent. Bets on tech stocks are rebounding, defying fears of trade war. Money moving back into markets. Gold continues upwards its strong trend and a softer dollar helps it higher today as well.

US crude & products probably rose 5.6 mb last week (API) versus a normal seasonal decline of 2.4 mb. The US API last night partial and thus indicative data for US oil inventories. Their data indicates that US crude stocks rose 7.4 mb last week, gasoline stocks rose 3.0 mb while Distillate stocks fell 4.8 mb. Altogether an increase in commercial crude and product stocks of 5.6 mb. Commercial US crude and product stocks normally decline by 2.4 mb this time of year. So seasonally adjusted the US inventories rose 8 mb last week according to the indicative numbers by the API. That is a lot. Also, the counter seasonal trend of rising stocks versus normally declining stocks this time of year looks on a solid pace of continuation. If the API is correct then total US crude and product stocks would stand 41 mb higher than one year ago and 6 mb higher than the 2015-19 average. And if we combine this with our knowledge of a sharp increase in production and exports by OPEC(+) and a large increase in oil at sea, then the current trend in US oil inventories looks set to continue. So higher stocks and lower crude oil prices until OPEC(+) switch to cuts. Actual US oil inventory data today at 18:00 CET.
US commercial crude and product stocks rising to 1293 mb in week 41 if last nights indicative numbers from API are correct.

Crude oil soon coming to a port near you. OPEC has lifted production sharply higher this autumn. At the same time demand for oil in the Middle-East has fallen as we have moved out of summer heat and crude oil burn for power for air-conditioning. The Middle-East oil producers have thus been able to lift exports higher on both accounts. Crude oil and condensates on water has shot up by 177 mb since mid-August. This oil is now on its way to ports around the world. And when they arrive, it will likely help to lift stocks onshore higher. That is probably when we will lose the last bit of front-end backwardation the the crude oil curves. That will help to drive the front-month Brent crude oil price down to the $60/b line and revisit the high $50ies/b. Then the eyes will be all back on OPEC+ when they meet in early November and then again in early December.
Crude oil and condensates at sea have moved straight up by 177 mb since mid-August as OPEC(+) has produced more, consumed less and exported more.

When it starts to move lower it moves rather quickly. Gaza, China, IEA. Brent crude is down 2.1% today to $62/b after having traded as high as $66.58/b last Thursday and above $70/b in late September. The sell-off follows the truce/peace in Gaze, a flareup in US-China trade and yet another bearish oil outlook from the IEA.
A lasting peace in Gaze could drive crude oil at sea to onshore stocks. A lasting peace in Gaza would probably calm down the Houthis and thus allow more normal shipments of crude oil to sail through the Suez Canal, the Red Sea and out through the Bab-el-Mandeb Strait. Crude oil at sea has risen from 48 mb in April to now 91 mb versus a pre-Covid normal of about 50-60 mb. The rise to 91 mb is probably the result of crude sailing around Africa to be shot to pieces by the Houthis. If sailings were to normalize through the Suez Canal, then it could free up some 40 mb in transit at sea moving onshore into stocks.
The US-China trade conflict is of course bearish for demand if it continues.
Bearish IEA yet again. Getting closer to 2026. Credibility rises. We expect OPEC to cut end of 2025. The bearish monthly report from the IEA is what it is, but the closer we get to 2026, the more likely the IEA is of being ball-park right in its outlook. In its monthly report today the IEA estimates that the need for crude oil from OPEC in 2026 will be 25.4 mb/d versus production by the group in September of 29.1 mb/d. The group thus needs to do some serious cutting at the end of 2025 if it wants to keep the market balanced and avoid inventories from skyrocketing. Given that IEA is correct that is. We do however expect OPEC to implement cuts to avoid a large increase in inventories in Q1-26. The group will probably revert to cuts either at its early December meeting when they discuss production for January or in early January when they discuss production for February. The oil price will likely head yet lower until the group reverts to cuts.
Dubai: The Mid-East anchor dragging crude oil lower. Surplus emerging in Mid-East pricing. Crude oil prices held surprisingly strong all through the summer. A sign and a key source of that strength came from the strength in the front-end backwardation of the Dubai crude oil curve. It held out strong from mid-June and all until late September with an average 1-3mth time-spread premium of $1.8/b from mid-June to end of September. The 1-3mth time-spreads for Brent and WTI however were in steady deterioration from late June while their flat prices probably were held up by the strength coming from the Persian Gulf. Then in late September the strength in the Dubai curve suddenly collapsed. Since the start of October it has been weaker than both the Brent and the WTI curves. The Dubai 1-3mth time-spread now only stands at $0.25/b. The Middle East is now exporting more as it is producing more and also consuming less following elevated summer crude burn for power (Aircon) etc.
The only bear-element missing is a sudden and solid rise in OECD stocks. The only thing that is missing for the bear-case everyone have been waiting for is a solid, visible rise in OECD stocks in general and US oil stocks specifically. So watch out for US API indications tomorrow and official US oil inventories on Thursday.
No sign of any kind of fire-sale of oil from Saudi Arabia yet. To what we can see, Saudi Arabia is not at all struggling to sell its oil. It only lowered its Official Selling Prices (OSPs) to Asia marginally for November. A surplus market + Saudi determination to sell its oil to the market would normally lead to a sharp lowering of Saudi OSPs to Asia. Not yet at least and not for November.
The 5yr contract close to fixed at $68/b. Of importance with respect to how far down oil can/will go. When the oil market moves into a surplus then the spot price starts to trade in a large discount to the 5yr contract. Typically $10-15/b below the 5yr contract on average in bear-years (2009, 2015, 2016, 2020). But the 5yr contract is usually pulled lower as well thus making this approach a moving target. But the 5yr contract price has now been rock solidly been pegged to $68/b since 2022. And in the 2022 bull-year (Brent spot average $99/b), the 5yr contract only went to $72/b on average. If we assume that the same goes for the downside and that 2026 is a bear-year then the 5yr goes to $64/b while the spot is trading at a $10-15/b discount to that. That would imply an average spot price next year of $49-54/b. But that is if OPEC doesn’t revert to cuts and instead keeps production flowing. We think OPEC(+) will trim/cut production as needed into 2026 to prevent a huge build-up in global oil stocks and a crash in prices. But for now we are still heading lower. Into the $50ies/b.
Some rebound but not much. Brent crude rebounded 1.5% yesterday to $65.47/b. This morning it is inching 0.2% up to $65.6/b. The lowest close last week was on Thursday at $64.11/b.
The curve structure is almost as week as it was before the weekend. The rebound we now have gotten post the message from OPEC+ over the weekend is to a large degree a rebound along the curve rather than much strengthening at the front-end of the curve. That part of the curve structure is almost as weak as it was last Thursday.
We are still on a weakening path. The message from OPEC+ over the weekend was we are still on a weakening path with rising supply from the group. It is just not as rapidly weakening as was feared ahead of the weekend when a quota hike of 500 kb/d/mth for November was discussed.
The Brent curve is on its way to full contango with Brent dipping into the $50ies/b. Thus the ongoing weakening we have had in the crude curve since the start of the year, and especially since early June, will continue until the Brent crude oil forward curve is in full contango along with visibly rising US and OECD oil inventories. The front-month Brent contract will then flip down towards the $60/b-line and below into the $50ies/b.
At what point will OPEC+ turn to cuts? The big question then becomes: When will OPEC+ turn around to make some cuts? At what (price) point will they choose to stabilize the market? Because for sure they will. Higher oil inventories, some more shedding of drilling rigs in US shale and Brent into the 50ies somewhere is probably where the group will step in.
There is nothing we have seen from the group so far which indicates that they will close their eyes, let the world drown in oil and the oil price crash to $40/b or below.
The message from OPEC+ is also about balance and stability. The world won’t drown in oil in 2026. The message from the group as far as we manage to interpret it is twofold: 1) Taking back market share which requires a lower price for non-OPEC+ to back off a bit, and 2) Oil market stability and balance. It is not just about 1. Thus fretting about how we are all going to drown in oil in 2026 is totally off the mark by just focusing on point 1.
When to buy cal 2026? Before Christmas when Brent hits $55/b and before OPEC+ holds its last meeting of the year which is likely to be in early December.
Brent crude oil prices have rebounded a bit along the forward curve. Not much strengthening in the structure of the curve. The front-end backwardation is not much stronger today than on its weakest level so far this year which was on Thursday last week.

The front-end backwardation fell to its weakest level so far this year on Thursday last week. A slight pickup yesterday and today, but still very close to the weakest year to date. More oil from OPEC+ in the coming months and softer demand and rising inventories. We are heading for yet softer levels.


Vad guldets uppgång egentligen betyder för världen

Spotpriset på guld över 4300 USD och silver över 54 USD
Crude oil soon coming to a port near you

Guld och silver stiger hela tiden mot nya höjder
The Mid-East anchor dragging crude oil lower

OPEC+ missar produktionsmål, stöder oljepriserna

Ett samtal om guld, olja, fjärrvärme och förnybar energi

Goldman Sachs höjer prognosen för guld, tror priset når 4900 USD

Blykalla och amerikanska Oklo inleder ett samarbete
Guld nära 4000 USD och silver 50 USD, därför kan de fortsätta stiga
-
 Nyheter3 veckor sedan
OPEC+ missar produktionsmål, stöder oljepriserna
-
 Nyheter4 veckor sedan
Ett samtal om guld, olja, fjärrvärme och förnybar energi
-
 Nyheter2 veckor sedan
Goldman Sachs höjer prognosen för guld, tror priset når 4900 USD
-
 Nyheter3 veckor sedan
Blykalla och amerikanska Oklo inleder ett samarbete
-
 Nyheter2 veckor sedan
Guld nära 4000 USD och silver 50 USD, därför kan de fortsätta stiga
-
Analys4 veckor sedan
Are Ukraine’s attacks on Russian energy infrastructure working?
-

 Nyheter4 veckor sedan
Guldpriset uppe på nya höjder, nu 3750 USD
-
Nyheter3 veckor sedan
Ett samtal om guld, olja, koppar och stål