

Analys
SEB Jordbruksprodukter, 4 november 2013


 Det var en generellt lite svagare vecka för jordbruksprodukter förra veckan. De skiljde inte ut sig från resten av råvarumarknaden, som generellt sett utvecklades svagt. Bland jordbruksprodukterna märktes särskilt stora prisfall för sojamjöl och smör. Dollarn steg och euron föll och det ganska mycket, 3%. Naturligtvis förklarar detta till stor del prisnedgångarna på de amerikanska terminsmarknaderna. Chicagovetet gick ner (i dollar räknat), men Matifvetet steg. Den svenska kronan följde i princip eurons rörelser mot dollarn. Förklaringen till valutakursförändringen var dels starkare inköpschefsindex i USA, som signalerar en snabb konjunkturåterhämtning, och en rapport om närmast deflation i Eurozonen. Förväntningar om att ECB ska sänka styrräntan i Eurozonen tändes omedelbart, vilket fick euron att falla.
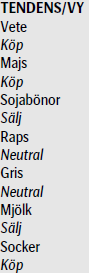
Vi tror att prisuppgången i euro / svenska kronor – termer fortsätter för vete. För raps går vi tillbaka till neutral rekommendation från en (försiktig) köprekommendation för två veckor sedan. I övrigt gör vi inte heller några förändringar av rekommendationerna.
På fredag klockan 18 publicerar USDA sin första WASDE-rapport på två månader. Förra månadens frös inne på grund av budgetbråket i USA.
Odlingsväder
Väderprognoser för USA indikerar gynnsamt väder för sådden och utvecklingen av det amerikanska höstvetet. Det finns en del analytiker som redan nu säger att höstvetet kommer att vara i det bästa tillståndet sedan 2010 när det går in i vintervila.
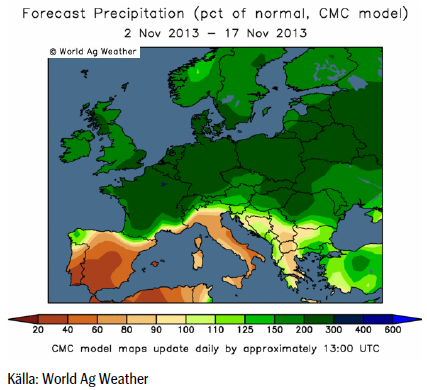
Europa har som bekant varit ovanligt regnigt. Prognosen fram till mitten av månaden visar att detta väntas fortsätta med väsentligt mycket mer regn än normalt över norra Kontinentaleuropa. Södra Europa väntas däremot vara torrare än normalt.
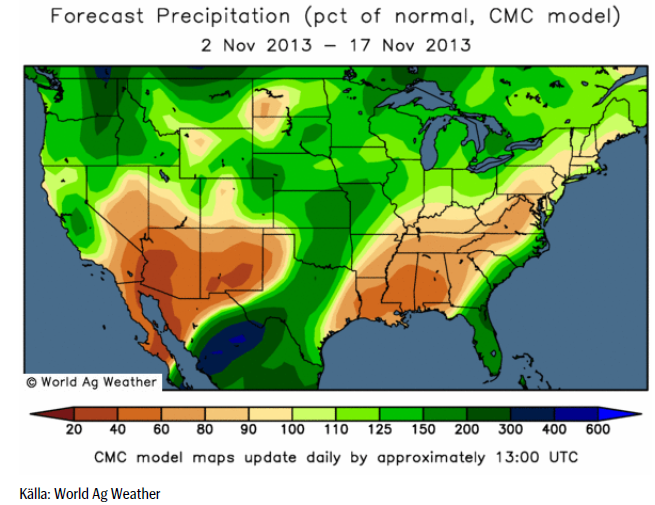
Även i USA väntas det vara mer nederbörd än normalt, utom i områden som normalt är torra, som t ex New Mexico och Arizona.
Vete
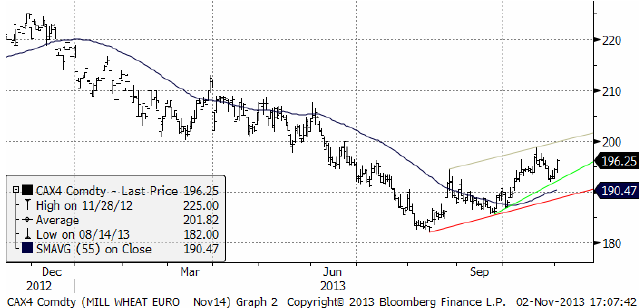
November 2014 fann stöd i veckan och ser ut att vara på väg mot ett nytt test av 200 euro. Prisutvecklingen på Matif stöds av den svagare valutan. ECB väntas sänka sin viktigaste styrränta den kommande veckan. Inflationen i Eurozonen lyser med sin frånvaro och ekonomin är i behov av monetär stimulans.
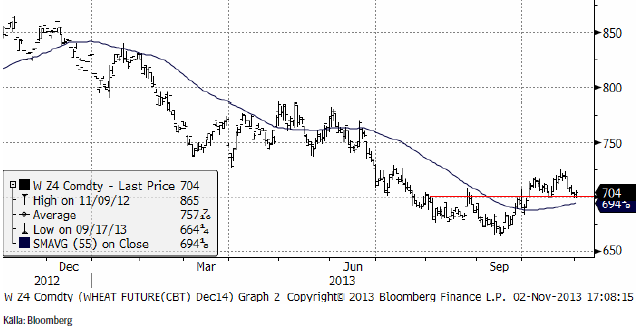
Decemberkontraktet 2014 på CBOT visar inte samma bild, därför att dollarn stärktes på eurons bekostnad. Priset i fredags stängde precis över det tekniska motståndet på 700 cent.
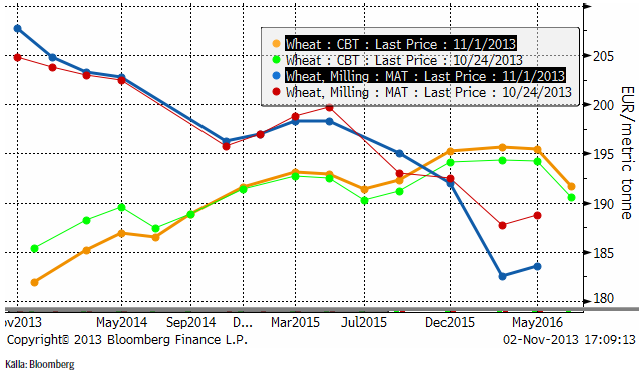
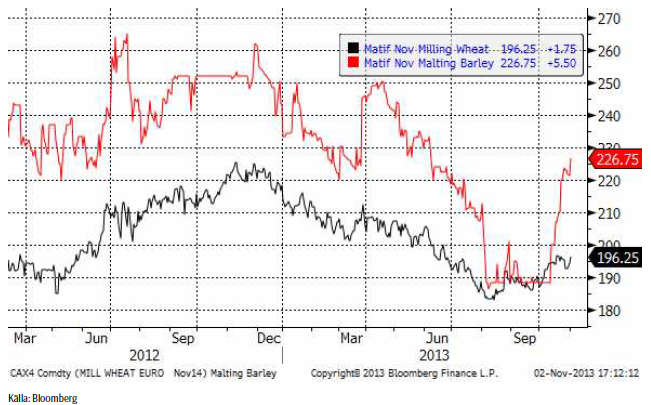
Nedan ser vi terminskurvorna för Chicagovete och Matif. Matif gick ännu mer in i backwardation för årets skörd, vilket visar på vilket akut behov det finns hos EU:s bönder att lära sig mer om terminer och affärsmässighet när det gäller marknadsföring av spannmål.
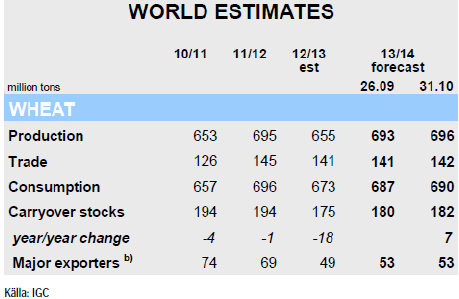
IGC (International Grains Council) kom med sin rapport i förra veckan och har ökat sitt estimat för den globala spannmålsproduktionen 2013/14 med 10 mt till 1940 mt. Tack vare gynnsamma väderförhållanden hos de stora producenterna, framförallt i USA och OSS, så bidrar detta till en förväntad ökning med 8% på årsbasis från 2012 års produktion då torka drabbade stor del av grödorna. Utgående lager justeras upp sedan förra månaden med 7 mt till ett fyra-års-högsta på 367 mt.
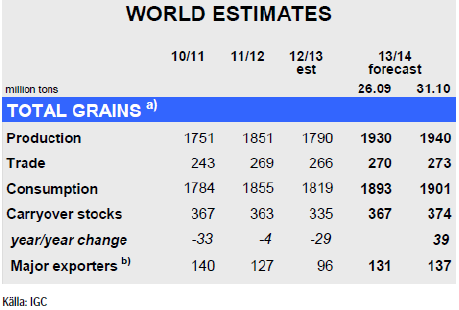
För vete indikeras en global produktion på 696 mt, vilket är en ökning med nästan 4 mt från förra månaden. Revideringen återspeglar framförallt en återhämtning av produktionen i OSS-länderna, vilket skulle ge en ökning med 6% på årsbasis.
Utgående lager förväntas öka med 7 mt på årsbasis till 182 mt som en följd av högre lager hos de stora exportländerna samt Kina.
Måndagens Crop Progress från USDA – den andra efter att USDA återupptagit publiceringen efter ”the U.S. government shutdown” – visar att sådden av amerikanskt höstvete nu börjar närma sig sitt slut då 86% var avklarad per den 27 oktober vilket är i linje med förra årets 87% vid den här tiden liksom det femåriga genomsnittet på 85%.
Uppkomsten av höstvete ligger på 65% – vilket är något högre än förra årets 61% men i linke med det femåriga genomsnittet på 64%.
Intressant är också andelen grödor klassade som ”good/excellent”. Visserligen justeras siffran ner med 4% från veckan innan till 61%, men det är betydligt högre än förra årets 40% vid den här tiden.
Vi fortsätter att tro på högre pris på vete basis Matif och rekommenderar köp.
Optioner på vete
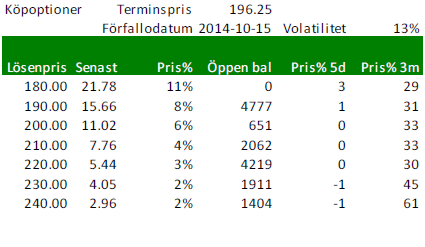
Nedan ser vi priserna på köpoptioner på Matif på November-2014 (Matif vete). Notera att volatiliteten 13% är ganska låg. Volatiliteten brukar vara låg när priserna är låga. Eftersom terminen gått upp lite har köpoptioner ökat lite i värde och säljoptioner fallit i värde.
Nedanstående optioner är köpoptioner, priser per stängning i fredags.
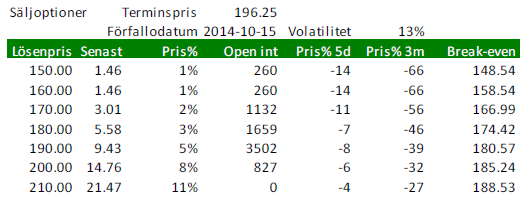
 Nedanstående är priser på säljoptioner.
Maltkorn
Vi har nu gått över till att studera 2014 års terminskontrakt för vete och maltkorn. Prisutvecklingen på dessa kontrakt ser vi nedan. Notera hur kraftigt terminskontraktet på maltkorn har återhämtat sig i oktober! Priset har gått upp från 190 euro per ton till 226.75 euro. Som vi sagt tidigare ser det ut att kunna bli lönsamt att odla maltkorn nästa år. Den som tycker att det är ett vågspel kan alltid prissäkra till 226.75 euro.
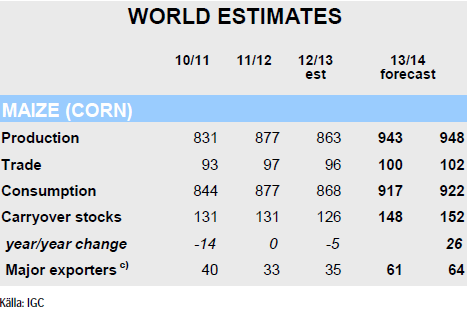
Majs
Majspriset – och nu tittar vi på nästa års skörd, december 2014-kontraktet har återtagit sin fallande trend. Förväntningarna inför WASDE-rapporten som kommer i veckan är att avkastningen per acre ska vara högre än tidigare beräknat.
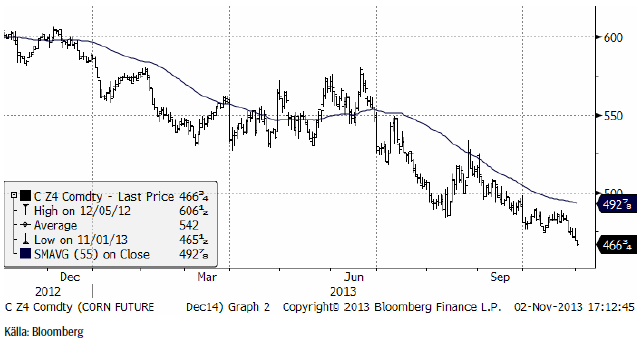
IGC rapporterade i veckan som gick. Den globala produktionen av majs beräknas uppgå till rekordhöga 948 mt, vilket är en ökning med 5 mt sedan IGC’s förra rapport vilket framförallt drivs av en återhämtning i USA. Detta göra också att utgående lager justeras upp med 4 mt jämfört med september och lagren hos de största exportörerna (Argentina, Brasilien, Ukraina och USA) estimeras till ett 26-års högsta.
Måndagens Crop Progress från USDA visade ett rejält uppsving i skörden av majs från 39% per den 20 oktober till 59% en vecka senare. Marknadens förväntningar låg runt 50-55%. Tar man en närmare titt på ”Istaterna” så är skörden avklarad till 74% respektive 59% i Illinois och Indiana. Iowa ligger nu på 55%, vilket är strax under genomsnittet på 60% men visar på att lantbrukarna varit aktiva då detta trots allt är en ökning med 20% från veckan innan. Den största veckovisa ökningen står dock lantbrukare i Minnesota för, från 19% till 48%.
Tillståndet för den amerikanska majsen har också förbättrats i de flesta stater under veckan och andelen grödor klassade som ”good/excellent” justeras upp med 2% till 62%. Tillståndet för grödorna i Illinois lämnades oförändrat och andelen ”good/excellent” ligger på 68%. Tillståndet för grödorna i Indiana förbättrades marginellt med 1% till 74% medan Iowa ’s grödor klassade som ”godd/excellent” justerades upp med 4% till 49%.
Vi väljer att hålla fast vid köprekommendationen.
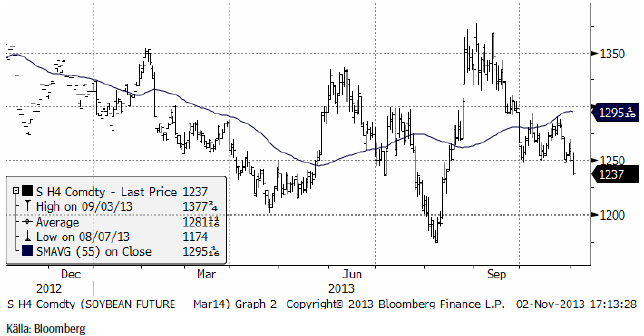
Sojabönor
Marskontraktet 2014 föll i fredags under det tekniska stödet på 1250, vilket ger möjlighet till fritt fall ner till 1200.
Vi ser också att November 2014 bröt under sitt tekniska stöd på 1150.
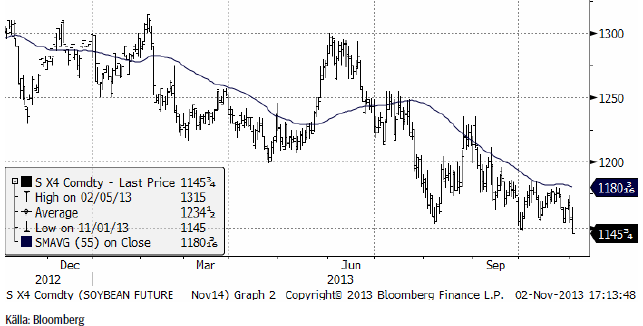
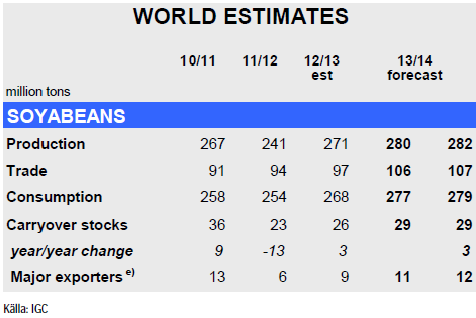
IGC rapporterade i veckan som gick. För sojabönor förväntas den globala produktionen att stiga för andra året i rad till rekordhöga 282 mt för 2013/14, en ökning med 4% på årsbasis, framförallt tack vare estimerade jätteskördar i Sydamerika. Globala utgående lager lämnas oförändrade från förra månaden på 29 mt men beräknas öka med 12% på årsbasis med de stora exportörerna Argentina och Brasilien i täten. Den globala handeln med sojabönor väntas öka med 10% på årsbasis drivet av en fortsatt stark efterfrågan från Kina med en ökad import.
Måndagens Crop Progress från USDA visar att skörden av sojabönor i USA avancerar och nu ligger i linje med det femåriga genomsnittet på 77%, en ökning från 63% veckan innan. Minnesota och South Dakota ligger strax över genomsnittet liksom Iowa och Illinois med 87% respektive 85% av skörden avklarad.
Förra veckans Crop Progress rapport var också den sista som visade tillståndet för sojabönorna där USDA avslutade säsongen med att konstatera att 57% klassades som ”good/excellent”, vilket var något lägre än snittet på 61% vid samma tid.
62% av grödorna i Illinois klassades som ”good/excellent” och för Indiana låg siffran på 68%. För Iowa stannade siffran på blygsamma 42%.
Vi behåller säljrekommendation.
Raps
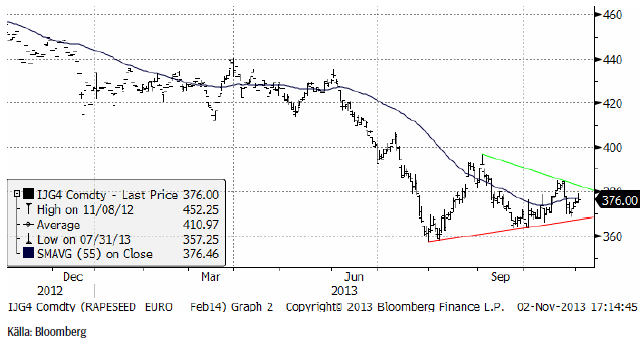
Rapspriset (februari 2014) gick inte under det tekniska stödet på 360 euro i början av oktober och har sedan dess stigit på ett sätt som inte riktigt kan förväntas av en marknad som ska vara i fallande trend. Priset ligger nu strax under 380 euro. Om priset går över 380 euro förändras bilden ytterligare. Det kan vara en trendvändning uppåt på gång. Det återstår att se.
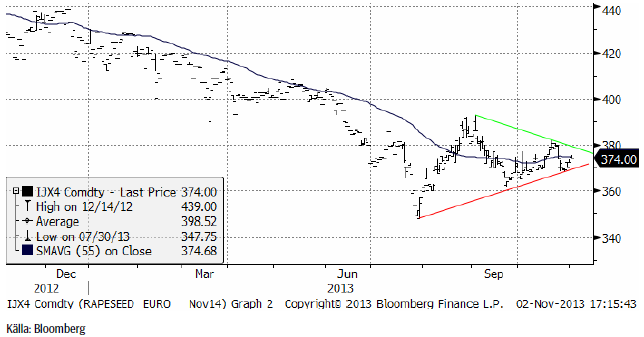
November 2014-kontraktet uppvisar liksom februarikontraktet en formation som inom den tekniska analysen kallas för en triangelformation. Sådana karaktäriseras av lägre toppar och högre bottnar. Utbrott ur ”triangeln” brukar följas av ytterligare rörelse i utbrottets riktning. I skrivande stund finns inget annat att göra än att avvakta och se åt vilket håll utbrottet sker.
För två veckor sedan gick vi över till en försiktig köprekommendation, men som läget är nu tycker vi det är bättre att avvakta med en neutral position.
Potatis
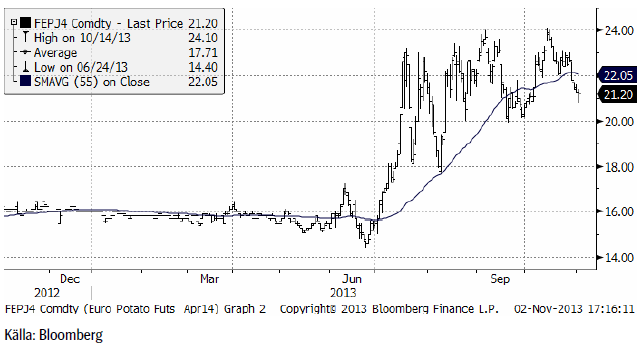
Potatispriset av årets skörd, föll tillbaka från toppnoteringen 24 euro och stängde förra veckan på 21.20 euro per deciton.
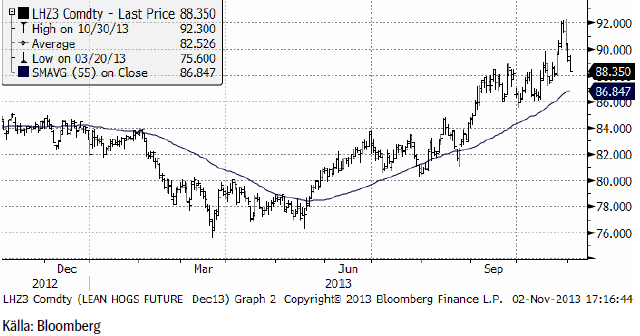
Gris
Lean hogs gick upp till ny toppnotering på 92.3 cent per pund innan priset föll tillbaka och stängde veckan på 88.35.
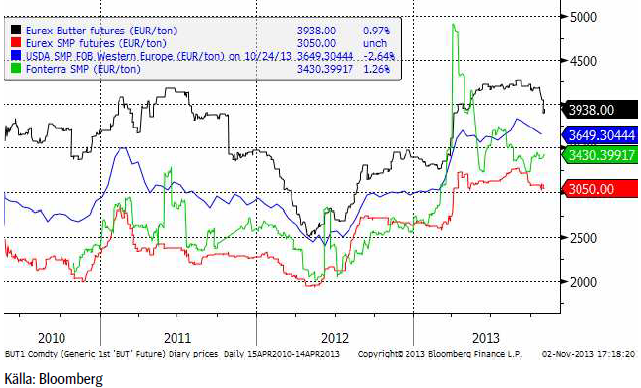
Mjölk
Terminerna på smör och skummjölkspulver vid Eurex-börsen var påtagligt svaga under veckan. Terminerna på smör föll med 3% för det kortaste kontraktet och med 2% för de lite längre. Priset på skummjölkspulver backade även det, men lite mindre.
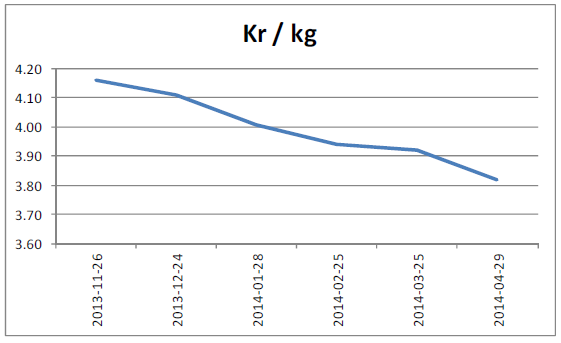
Om vi utgår från terminspriserna på smör och SMP och aktuell växelkurs eursek, får vi följande terminskurva i kronor per kilo svensk mjölkråvara. Notera dock att dessa priser alltid bör ligga över ett pris för råvaran i Sverige (och på andra ställen också) eftersom SMP och smör är produkter och inte råvaror.
Socker
Marskontraktet på råsocker har rekylerat tillbaka till en teknisk stödnivå. Det är en nivå där en vändning uppåt skulle kunna ske. Vi upprepar därför vår köprekommendation på socker.
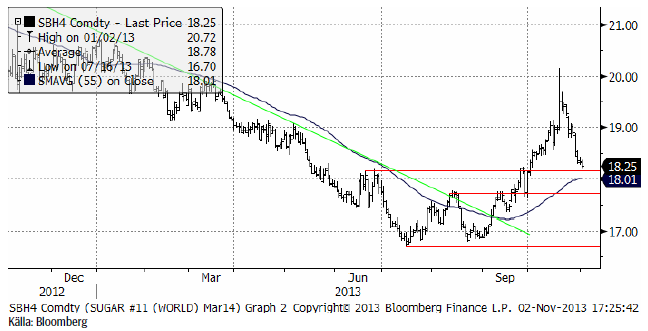
Det råder inget tvivel om att trenden för sockerpriset har vänts från att vara fallande de senaste åren, till att bli stigande.
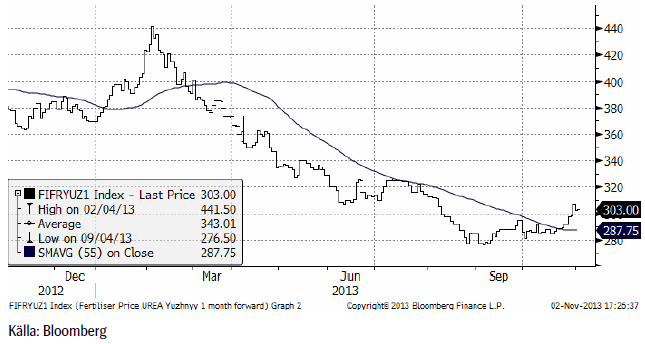
Gödsel
Priset på kväve / urea steg i veckan som gick och ligger nu på 303 dollar per ton. Botten noterades den 4 september på 276.50 dollar per ton. Priset ligger ändå en bra bid under förra årets toppnotering på 441.50.
[box]SEB Veckobrev Jordbruksprodukter är producerat av SEB Commodities Sales desk och publiceras i samarbete och med tillstånd på Råvarumarknaden.se[/box]
Detta marknadsföringsmaterial, framtaget av SEB’s Commodities Sales desk, har upprättats enbart i informationssyfte.
Även om innehållet är baserat på källor som SEB bedömt som tillförlitliga ansvarar SEB inte för fel eller brister i informationen. Den utgör inte oberoende, objektiv investeringsanalys och skyddas därför inte av de bestämmelser som SEB har infört för att förebygga potentiella intressekonflikter. Yttranden från SEB’s Commodities Sales desk kan vara oförenliga med tidigare publicerat material från SEB, då den senare hänvisas uppmanas du att läsa den fullständiga rapporten innan någon åtgärd vidtas.
Dokumentationen utgör inte någon investeringsrådgivning och tillhandahålls till dig utan hänsyn till dina investeringsmål. Du uppmanas att självständigt bedöma och komplettera uppgifterna i denna dokumentation och att basera dina investeringsbeslut på material som bedöms erforderligt. Alla framåtblickande uttalanden, åsikter och förväntningar är föremål för risker, osäkerheter och andra faktorer och kan orsaka att det faktiska resultatet avviker väsentligt från det förväntade. Historisk avkastning är ingen garanti för framtida resultat. Detta dokument utgör inte ett erbjudande att teckna några värdepapper eller andra finansiella instrument. SEB svarar inte för förlust eller skada – direkt eller indirekt, eller av vad slag det vara må – som kan uppkomma till följd av användandet av detta material eller dess innehåll.
Observera att det kan förekomma att SEB, dess ledamöter, dess anställda eller dess moder- och/eller dotterbolag vid olika tillfällen innehar, har innehaft eller kommer att inneha aktier, positioner, rådgivningsuppdrag i samband med corporate finance-transaktioner, investment- eller merchantbankinguppdrag och/eller lån i de bolag/finansiella instrument som nämns i materialet.
Materialet är avsett för mottagaren, all spridning, distribuering mångfaldigande eller annan användning av detta meddelande får inte ske utan SEB:s medgivande. Oaktat detta får SEB tillåta omfördelning av materialet till utvald tredje part i enlighet med gällande avtal. Materialet får inte spridas till fysiska eller juridiska personer som är medborgare eller har hemvist i ett land där sådan spridning är otillåten enligt tillämplig lag eller annan bestämmelse.
Skandinaviska Enskilda Banken AB (publ) är ett [publikt] aktiebolag och står under tillsyn av Finansinspektionen samt de lokala finansiella tillsynsmyndigheter i varje jurisdiktionen där SEB har filial eller dotterbolag.

Wild moves yesterday. Brent crude traded to a high of $114.43/b and a low of $96.0/b and closed at $99.94/b yesterday.

US – Iran negotiations ongoing or not? What a day. Donald Trump announced that good talks were ongoing between Iran and the US and that the 48 hour deadline before bombing Iranian power plants and energy infrastructure was postponed by five days subject to success of ongoing meetings. Iranian media meanwhile stated that no meetings were ongoing at all.
Today we are scratching our heads trying to figure out what yesterday was all about.
Friends and family playing the market? Was it just Trump and his friends and family who were playing with oil and equity markets with $580m and $1.46bn in bets being placed by someone in oil and equity markets just 15 minutes before Trump’s announcement?
Was Trump pulling a TACO as he reached his political and economic pain point: Brent at $112/b, US Gas at $4/gal, SPX below 200dma and US 10yr above 4.4%?
Different Iranian factions with Trump talking with one of them? Are there real negotiations going on but with the US talking to one faction in Iran while another, the hardliners, are not involved and are denying any such negotiations going on?
Extending the ultimatum to attack and invade Kharg island next weekend? Or, is the five day delay of the deadline a tactical decision to allow US amphibious assault ships and marines to arrive in the Gulf in the upcoming weekend while US and Israeli continues to degrade Iranian military targets till then. And then next weekend a move by the US/Israel to attack and conquer for example the Kharg island?
We do not really know which it is or maybe a combination of these.
We did get some kind of TACO ydy. But markets have been waiting for some kind of TACO to happen and yesterday we got some kind of TACO. And Brent crude is now trading at $101.5/b as a result rather than at $112-114/b as it did no the high yesterday.
But what really matters in our view is the political situation on the ground in Iran. Will hardliners continue to hold power or will a more pragmatic faction gain power?
If the hardliners remain in power then oil pain should extend all the way to US midterm elections. The hardliners were apparently still in charge as of last week. Iran immediately retaliated and damaged LNG infrastructure in Qatar after Israel hit Iranian South Pars. The SoH was still closed and all messages coming out of Iran indicated defiance. Hardliners continues in power has a huge consequence for oil prices going forward. The regime has played its ’oil-weapon’ (closing or chocking the Strait of Hormuz). It is using it to achieve political goals. Deterrence: it needs to be so politically and economically expensive to attack Iran that it won’t happen again in the future. Or at least that the US/Israel thinks 10-times over before they attack again. The highest Brent crude oil closing price since the start of the war is $112.19/b last Friday. In comparison the 20-year inflation adjusted Brent price is $103/b. So Brent crude last Friday at $112.19/b isn’t a shockingly high price. And it is still far below the nominal high of $148/b from 2008 which is $220/b if inflation adjusted. So once in a lifetime Iran activates its most powerful weapon. The oil weapon. It needs to show the power of this weapon and it needs to reap political gains. Getting Brent to $112/b and intraday high of $119.5/b (9 March) isn’t a display of the power of that weapon. And it is not a deterrence against future attacks.
So if the hardliners remain in power in Iran, then the SoH will likely remain chocked all the way to US midterm elections and Brent crude will at a minimum go above the historical nominal high of $148/b from 2008.
Thus the outlook for the oil price for the rest of the year doesn’t depend all that much of whether Trump pulls a TACO or not. Stops bombing or not. It depends more on who is in charge in Iran. If it is the hardliners, then deterrence against future attacks via chocking of the SoH and high oil prices is the likely line of action. It is impacting the world but the Iranian ’oil-weapon’ is directed towards the US president and the the US midterm elections.
If a pragmatic faction gets to power in Iran, then a very prosperous future is possible. However, if power is shifting towards a more pragmatic faction in Iran then a completely different direction could evolve. Such a faction could possibly be open for cooperation with the US and the GCC and possibly put its issues versus Israel aside. Then the prosperity we have seen evolving in Dubai could be a possible future also for Iran.
So far it looks like the hardliners are fully in charge. As far as we can see, the hardliners are still fully in control in Iran. That points towards continued chocking of the SoH and oil prices ticking higher as global inventories (the oil market buffers) are drawn lower. And not just for a few more weeks, but possibly all the way to the US midterm elections.
A brief sigh of relief yesterday as oil infra at Kharg wasn’t damaged. But higher today. Brent crude dabbled around a bit yesterday in relief that oil infrastructure at Iran’s Kharg island wasn’t damaged. It traded briefly below the 100-line and in a range of $99.54 – 106.5/b. Its close was near the low at $100.21/b.
No easy victorious way out for Trump. So no end in sight yet. Brent is up 3.2% today to $103.4/b with no signs that the war will end anytime soon. Trump has no easy way to declare victory and mission accomplished as long as Iran is in full control of the Strait of Hormuz while also holding some 440 kg of uranium enriched to 60% and not far from weapons grade at 90%. As long as these two factors are unresolved it is difficult for Trump to pull out of the Middle East. Naturally he gets increasingly frustrated over the situation as the oil price and US retail gas prices keeps ticking higher while the US is tied into the mess in the Middle East. Trying to drag NATO members into his mess but not much luck there.
When commodity prices spike they spike 2x, 3x, 4x or 5x. Supply and demand for commodities are notoriously inflexible. When either of them shifts sharply, the the price can easily go to zero (April 2022) or multiply 2x, 3x, or even 5x of normal. Examples in case cobalt in 2025 where Kongo restricted supply and the price doubled. Global LNG in 2022 where the price went 5x normal for the full year average. Demand for tungsten in ammunition is up strongly along with full war in the middle east. And its price? Up 537%.
Why hasn’t the Brent crude oil price gone 2x, 3x, 4x or 5x versus its normal of $68/b given close to full stop in the flow of oil of the Strait of Hormuz? We are after all talking about close to 20% of global supply being disrupted. The reason is the buffers. It is fairly easy to store oil. Commercial operators only hold stocks for logistical variations. It is a lot of oil in commercial stocks, but that is predominantly because the whole oil system is so huge. In addition we have Strategic Petroleum Reserves (SPRs) of close to 2500 mb of crude and 1000 mb of oil products. The IEA last week decided to release 400 mb from global SPR. Equal to 20 days of full closure of the Strait of Hormuz. Thus oil in commercial stocks on land, commercial oil in transit at sea and release of oil from SPRs is currently buffering the situation.
But we are running the buffers down day by day. As a result we see gradually increasing stress here and there in the global oil market. Asia is feeling the pinch the most. It has very low self sufficiency of oil and most of the exports from the Gulf normally head to Asia. Availability of propane and butane many places in India (LPG) has dried up very quickly. Local prices have tripled as a result. Local availability of crude, bunker oil, fuel oil, jet fuel, naphtha and other oil products is quickly running down to critical levels many places in Asia with prices shooting up. Oman crude oil is marked at $153/b. Jet fuel in Singapore is marked at $191/b.
Oil at sea originating from Strait of Hormuz from before 28 Feb is rapidly emptied. Oil at sea is a large pool of commercial oil. An inventory of oil in constant move. If we assume that the average journey from the Persian Gulf to its destinations has a volume weighted average of 13.5 days then the amount of oil at sea originating from the Persian Gulf when the the US/Israel attacked on 28 Feb was 13.5 days * 20 mb/d = 269 mb. Since the strait closed, this oil has increasingly been delivered at its destinations. Those closest to the Strait, like Pakistan, felt the emptying of this supply chain the fastest. Propane prices shooting to 3x normal there already last week and restaurants serving cold food this week is a result of that. Some 50-60% of Asia’s imports of Naphtha normally originates from the Persian Gulf. So naphtha is a natural pain point for Asia. The Gulf also a large and important exporter of Jet fuel. That shut in has lifted jet prices above $200/b.
To simplify our calculations we assume that no oil has left the Strait since that date and that there is no increase in Saudi exports from Yanbu. Then the draining of this inventory at sea originated from the Persian Gulf will essentially look like this:
The supply chain of oil at sea originating from the Strait of Hormuz is soon empty. Except for oil allowed through the Strait of Hormuz by Iran and increased exports from Yanbu in the Red Sea. Not included here.

Oil at sea is falling fast as oil is delivered without any new refill in the Persian Gulf. Waivers for Russian crude is also shifting Russian crude to consumers. Brent crude will likely start to feel the pinch much more forcefully when oil at sea is drawn down another 200 mb to around 1000 mb. That is not much more than 10 days from here.

Oil and oil products are starting to become very pricy many places. Brent crude has still been shielded from spiking like the others.

Closing at highest since Aug 2022. Brent crude gained 9.2% yesterday. The trading range was limited to $95.2 – 101.85/b with a close at $100.46/b and higher than the Monday close of $98.96/b. Ydy close was the highest close since August 2022. This morning Brent is up 2% to $102.4/b and is trading at the highest intraday level since Monday when it high an intraday high of $119.5/b.
A military hit at Iran’s Kharg island would be a big, big bang for the oil price. The big, big risk for the weekend is that oil infrastructure could be damaged. For example Iran’s Kharg island which is Iran’s major oil export hub. If damaged we would have a longer lasting loss of supply stretching way beyond Trump’s announced ”two more weeks”. It will make the spot price spike higher and it will lift the curve. Brent crude 2027 swap would jump above $80/b immediately. An attack on Kharg island would naturally lead Iran to strike back at other oil infrastructures in the Gulf. Especially those belonging to countries who harbor US military bases. I.e. countries who essentially are supporting the attack by US and Israel towards Iran. Though if not in spirit, then in practical operational terms. An attack on Kharg island would not just lead to a lasting outage of supply from Iran until it would be repaired. It would immediately endanger other oil infrastructure in the region as well and additional lasting loss of supply.
No one in their right mind would dare to sit short oil over the coming weekend. Oil is thus set to close the week at a very strong note today.
Prepare for another 400 mb SPR release next week. This week’s announcement of a 400 mb release from Strategic Oil Reserves totally underwhelmed the market with the oil price going higher rather than lower following the announcement. For one it means that the market expects the war and the closure of the Strait of Hormuz to last longer than Trump’s recent announced ”two more weeks”. 400 mb only amounts to 20 days of lost supply to the world through Hormuz and we are already at day 14. So next week when we are getting close to the 20 day mark, we are likely to see another announcement of another 400 mb release of SPR stocks to the market. Preparing for the next 20 days of war.
Global oil logistics in total disarray. We have previously addressed the issue of the huge logistical web of the global oil market which is now in total disarray. The logistical disruption started to fry the oil market at the end of last week. Helped to spike the oil market on Monday. What we hear from our shipping clients is that the problems with supply of fuels locally in Korea, Singapore, India and Africa are getting worse with physical availability of fuels there drying up. It is getting increasingly difficult to find physical supply of bunker oil with local, physical prices shooting way higher than financial benchmarks. To the point that biofuels have become the cheap option many places. Availability of fuels in the US is still good. Not so surprising as the US is self-sufficient with crude and refineries.
The disruption in global oil logistics doesn’t seem to improve. Rather the opposite. If you cannot get fuel to run your ships, then how can you distribute fuels to where it is needed.
Buy Brent Dec-2026 calls with strike $150/b!! As the days goes by the oil price is ticking higher while Trump is getting one day closer to US midterm elections. Trump was betting that he could put this war to bead well before November. But that will probably not be up to him to decide. It will be up to Iran to decide when to reopen the Strait of Hormuz. It is very hard to imagine that Iran will let Trump easily off the hock after he has killed its Supreme Leader. This will likely go all the way to November. Buy Brent Dec-2026 calls with strike $150/b!!
Brent closed at highest since 2022 ydy. Will end this Friday at a very strong note! Consumers still dreaming of $60/b oil


Christian Kopfer om läget för oljan

Marknaden måste börja betrakta de höga kopparpriserna som det nya normala

Det fysiska spotpriset på brentolja har slagit nytt rekord

40 minuter med Javier Blas om hur världen verkligen påverkas av energikrisen

Efter tillväxten: Guldbrev satsar på expansion i Europa
40 minuter med Javier Blas om hur världen verkligen påverkas av energikrisen

Elpriserna fördubblas, stor osäkerhet inför sommaren

MP Materials, USA:s svar på Kinas dominans över sällsynta jordartsmetaller
Det fysiska spotpriset på brentolja har slagit nytt rekord

Studsvik har idag ansökt om att få bygga 1200-1600 MW kärnkraft i Valdemarsvik
-
 Nyheter2 veckor sedan
40 minuter med Javier Blas om hur världen verkligen påverkas av energikrisen
-
 Nyheter4 veckor sedan
Elpriserna fördubblas, stor osäkerhet inför sommaren
-
 Nyheter4 veckor sedan
MP Materials, USA:s svar på Kinas dominans över sällsynta jordartsmetaller
-
 Nyheter2 veckor sedan
Det fysiska spotpriset på brentolja har slagit nytt rekord
-
 Nyheter4 veckor sedan
Studsvik har idag ansökt om att få bygga 1200-1600 MW kärnkraft i Valdemarsvik
-
 Nyheter2 veckor sedan
Marknaden måste börja betrakta de höga kopparpriserna som det nya normala
-
Analys4 veckor sedan
TACO (or Whatever It Was) Sends Oil Lower — Iran Keeps Choking Hormuz
-

 Nyheter4 veckor sedan
Matproduktion är beroende av gödsel, Gulfkriget skapar brist