

Analys
SEB Jordbruksprodukter, 31 mars 2013

 Lagerstatistiken och den tillhörande odlade arealen i USA var ultrabaissiga. Priserna på majs stängde limit-down. Vete och sojabönor föll kraftigt de också. Pristrenden kommer att gå nedåt härifrån.
Marknadens missbedömning var en av de största någonsin och marknadsrörelsen på Skärtorsdagen en av de största någonsin, i majs bara dämpad av den största tillåtna prisrörelsen.
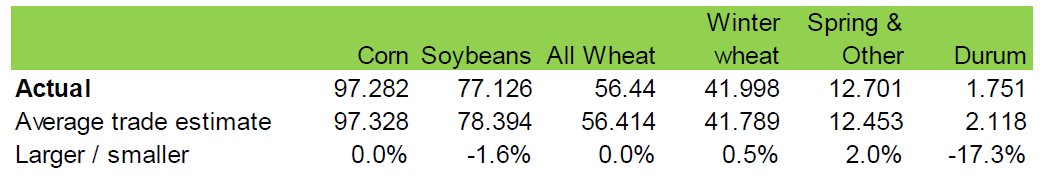
 Sådden av majs väntas ske på 97.3 miljoner acres, något över marknadens förväntningar. Det är den största arealen sedan 1936.
De amerikanska börserna var stängda på Långfredagen, men är öppna på Annandag Påsk. Europa är dock stängt och öppnar först på tisdag. Vi kan förvänta oss betydligt lägre priser på tisdag.
Läsaren kanske kommer ihåg att jag här förra veckan skrev att den rekyl uppåt som vi sett fram till i torsdags, var ett bra tillfälle för lantbrukare att prissäkra. Jag skrev också att risk / reward var på nedsidan, eftersom de senaste rapporterna lett till uppgångar. Nu tänker förmodligen många att ”det är för sent” att prissäkra. I synnerhet som priserna kommer stå ännu lägre på tisdag när Europa öppnar. Att inte prissäkra på tisdag tror jag är ett misstag. Det kommer säkerligen att gå nedåt härifrån. Låt inte ett misstag bli ett misslyckande.
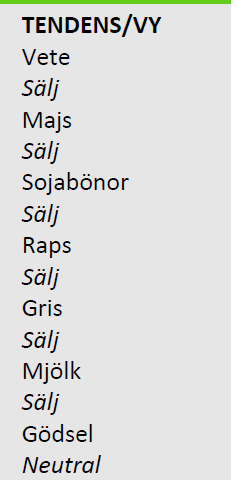
Vi går över till säljrekommendation på alla grödor.
Stocks & Plantings – rapporten i siffror
Lagren av vete, majs och sojabönor var per den 1 mars betydligt högre än vad marknaden förväntat sig, som vi ser i tabellen nedan.
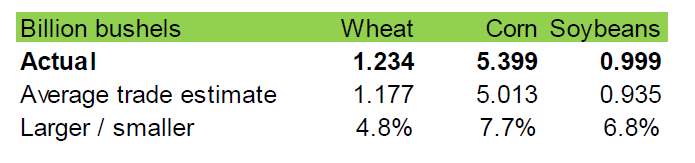
Lagerestimaten år så stora att man undrar om det inte var fel – för låga siffror i decemberrapporten, eller om lagren nu möjligtvis är för stora. Om marknaden tror på siffrorna, och det gör den med all säkerhet, så finns knappast längre någon anledning till oro för att det är kallt och sådden blivit försenad. Vad gäller sojabönor försvann också oron för att sojabönorna ska ta slut i USA innan Brasilien får ut sina.
Sådd areal, som vi ser nedan hade marknadens analytiker bättre koll på, utom för vårvete och durum. Men vi vet redan tidigare att sådden väntas bli mycket stor i år.
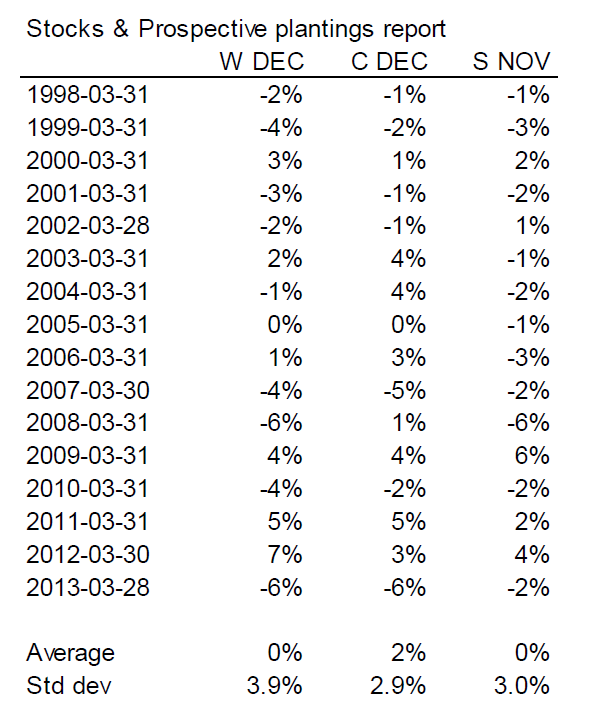
Nedan ser vi prisförändringarna på de senaste årens rapportdagar. Prisreaktionen är uppmätt i respektive års decemberkontrakt för vete och majs och november för sojabönor.
Var hittar man terminspriser på nätet?
Den vanligaste frågan jag får via email från läsare av mitt veckobrev eller marknadskommentaren på ATL.nu är var man kan följa priserna på terminer på nätet. Oftast är det självklaraste svaret att man ska besöka respektive börs hemsida. Börserna publicerar priser som är fördröjda med 15 minuter. Besöker man den tyska börsen Eurex hittar man efter lite letande vad man söker. Men besöker man den franska börsen Matif (som nu är en del av New York Stock Exchange) hittar man det inte. Sidan är också en blandning av franska och engelska.
Ett betydligt bättre sätt är att besöka www.barchart.com.
Jag har än så länge inte sökt något där som jag inte hittat. För enkelhets skull har jag listat svaren på de vanligaste frågorna nedan:
Kvarnvete på Matif
www.barchart.com/commodityfutures/Matif_Milling_Wheat_Futures/MLX11
Raps på Matif
www.barchart.com/commodityfutures/Matif_Rapeseed_Futures/XR
Smör på Eurex
www.barchart.com/commodityfutures/Eurex_Butter_Futures/QYH13
SMP på Eurex
www.barchart.com/commodityfutures/Eurex_Skimmed_Milk_Futures/MRN13
Priserna är fördröjda med 15 minuter. Det duger väldigt väl för att följa med i marknaden och är vad de allra flesta har ändå. Realtidspriser kostar så mycket att bara traders och kundhandlare på bankerna har dem. När det är skarpt läge och man vill handla på telefon kan man få priserna av dem.
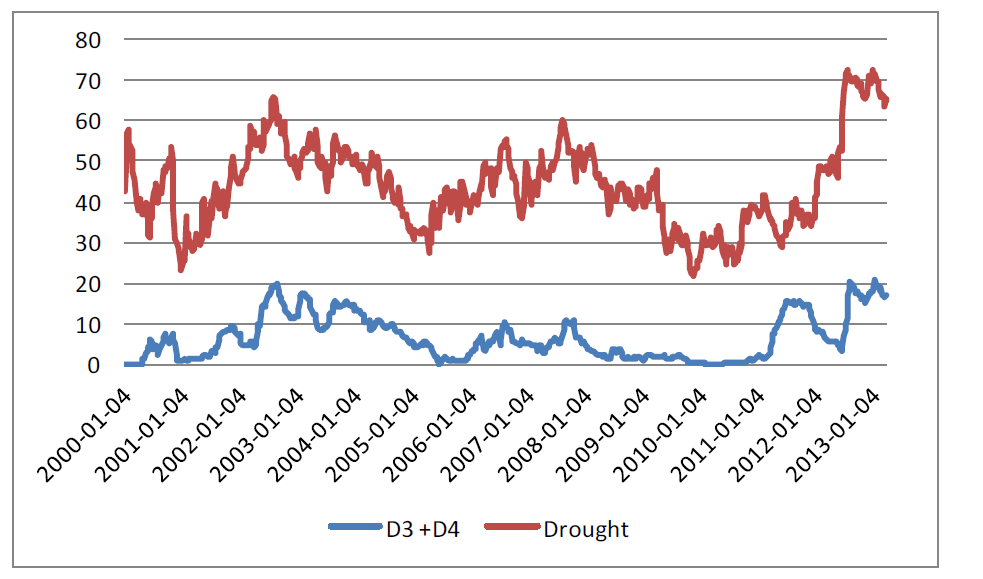
Odlingsväder
Det har inte varit några stora förändringar i klimatet i USA. Det är fortsatt torrt.
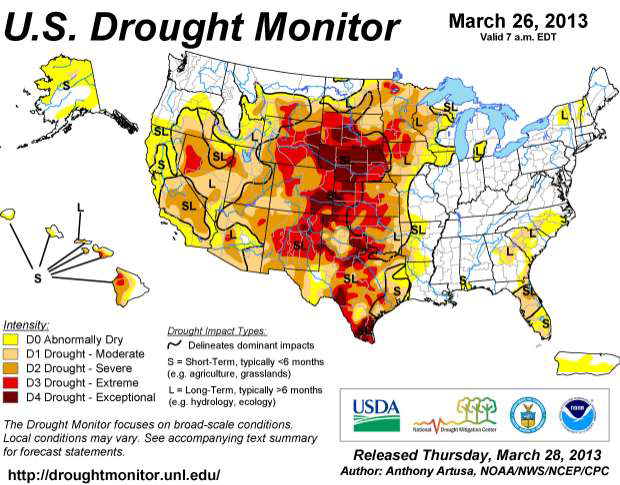
I siffrorna för torkan ser vi att det inte heller där märks av någon skillnad.
Vete
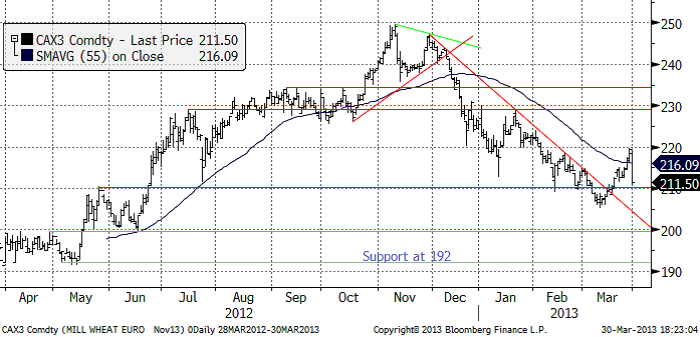
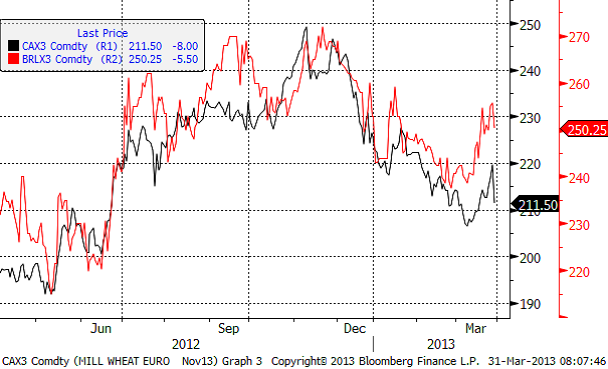
Priset på november (2013) hann falla ner till 211.50 i torsdags innan marknaden föll. Det var lite handel vid femtiden, men sedan hade handlarna på spannmålsfirmorna gått hem och tagit helg de också. Tekniskt ser vi att 210 är en viktig stödnivå. Den lär brytas på tisdag med 200 som nästa stödnivå.
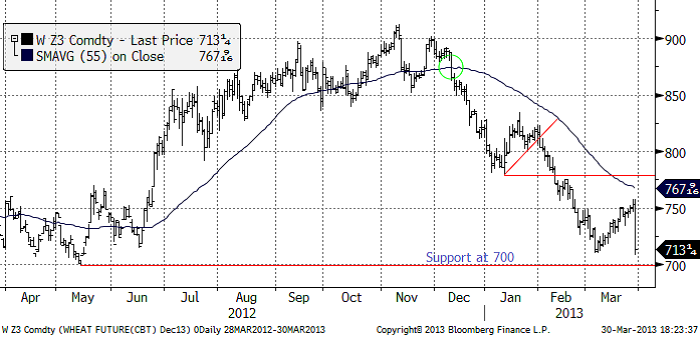
Decemberkontraktet på CBOT föll ner till botten på nedgången från december. Den nivån kommer säkert att testas på måndag och förmodligen brytas. 700 cent är en viktig nivå att hålla koll på. Bryts även den nivån, öppnas för ytterligare prisfall.
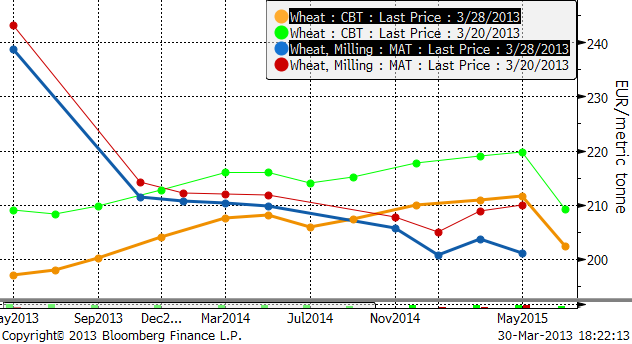
Terminskurvorna (alla i euro / ton) visar att prisfallet varit mycket kraftigare i USA och att lagerstatistiken påverkade alla löptider även för leverans långt bort i tiden. Lagren satt som en propp i marknaden. Matif hann inte alls falla lika mycket i torsdags och har en del ”catch up” att göra på tisdag.
Crop condition för vintervetet i USA börjar publiceras på måndag klockan 22:00. Den senaste uppdateringen är från den 23 november förra året. Då var 33% i good / excellent condition.
Möjligen kan man tänka sig att en ny siffra, som förmodligen inte är sådär fantastiskt bra, kan få vetemarknaden att rekylera uppåt på tisdag. En sådan uppgång kan förmodligen vara ett bra tillfälle att sälja på.
Vi har säljrekommendation på vete.
Maltkorn
Priset på maltkorn med leverans i november har fortsatt att ligga högre än kvarnvetet på Matif. Eftersom maltkorn är en så pass illikvid terminsmarknad reagerade inte priserna på torsdagens rapport. Förmodligen gjordes inget avslut efter 17:00, men jag har inte kollat i detalj. Vi ser att när priset på maltkorn dragit ifrån, som nu, har det alltid återvänt till sin stadiga ”spread” till kvarnvetet. Maltkornet är just nu särskilt säljvärt, mer så än kvarnvetet.
Vi har säljrekommendation på maltkorn.
Majs
Majspriset (december 2013) föll kraftigt, som vi redan nämnt. Lagerrapporten var ultranegativ för majsen. Priset föll förbi botten från nedgången från december, men stängde pga limit-down stopp i handeln över stödet på 530 cent. Den nivån kommer naturligtvis att testas på måndag. På måndag är dessutom största tillåtna prisrörelse utökad eftersom torsdagen stängde limit down.
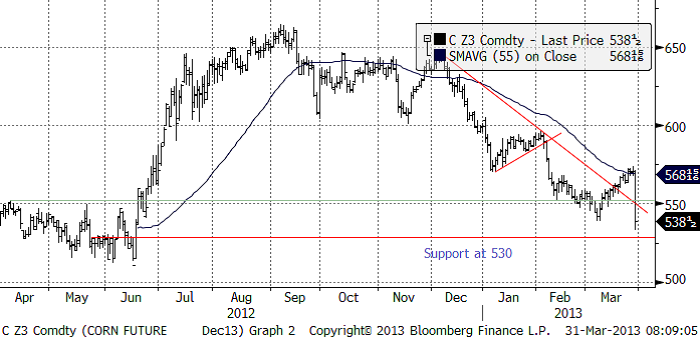
Som nämnt ovan är arealen sådd med majs den största i USA sedan 1936. Sådden är igång i södra USA. Det kommer att bli väldigt gott om majs i år, om det inte blir en ny tork-katastrof. Vi går över till säljrekommendation på majs.
Sojabönor
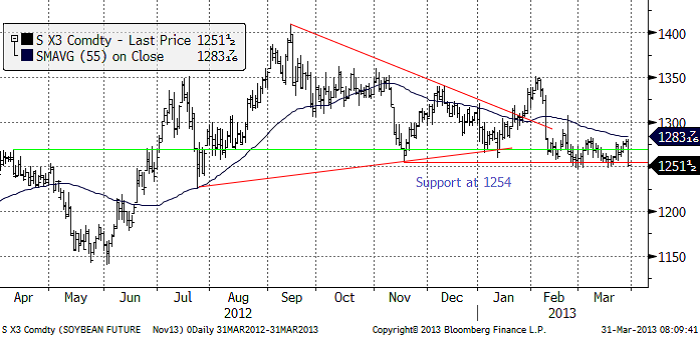
Sojabönorna (november 2013) gick genom stödet på 1254, då lagren visade att USA INTE har någon brist på sojabönor. Möjligen kan detta ifrågasättas, eftersom export inspections har legat tidigt i säsongen – började öka tidigt och började falla tidigt. Det är viktigt för en kort position att priset faller genom stödet på 1250 också och för det behövs bara 2 cent.
Marknaden har i flera veckor ojat sig över att lastningen i hamnarna i Brasilien tar så lång tid. Regnigt väder och arbetslagstiftning är två av orsakerna. En annan är att själva storleken på skörden. Det är flera miljoner ton mer sojabönor som ska exporteras. Om vi tänker på hur våra hamnar i Sverige, Danmark eller Tyskland skulle reagera på några miljoner ton extra att hantera, kanske man får lättare att förstå att det kan bli kö på fartygen.
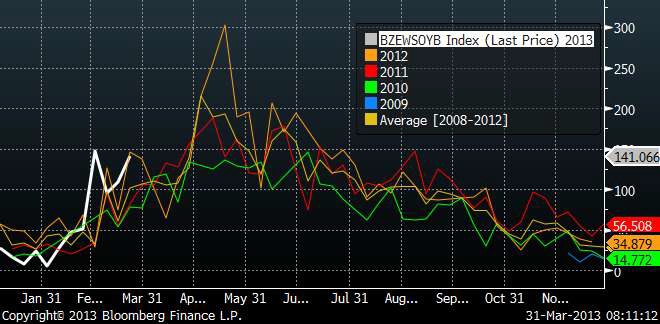
Nedan ser vi Brasiliens export av sojabönor i miljoner dollar FOB. Diagrammet visar de olika kalenderåren. Vi ser att årets export kom igång sent. Säkerligen kommer den vita kurvan att hamna på rekordnivåer senare i år.
Ser vi till skörden av sojabönor i USA, ser vi att det i förhållande till förra året är nästan 20 miljoner ton mer!!!
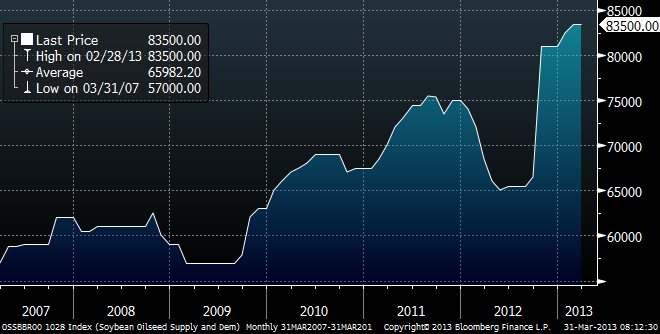
Det är alltså inte konstigt att det är ett problem med sojabönorna i hamnarna i Brasilien. Problemet har varit mycket regn, framförallt, men det stora problemet är skördens och exportens enorma storlek. Det är knappast något som motiverar att priset ska stiga. Snarare tvärtom. Vi går över till säljrekommendation på sojabönor.
Raps
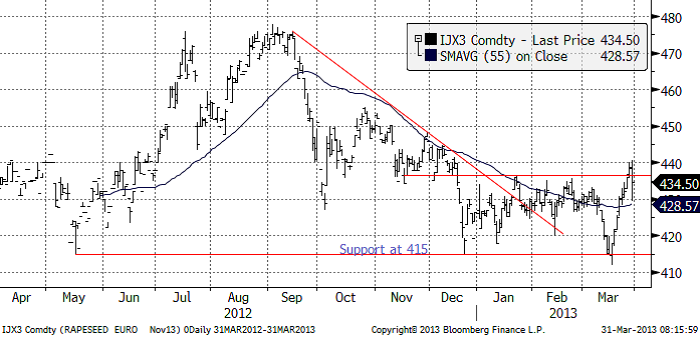
Rapspriset (november 2013) som gick upp och rörde vid 440 euro per ton, följde med sojabönorna ner. Nu kommer priset med största sannolikhet att ge tillbaka vinsterna till marknaden och falla ner mot stödet på 415 euro igen. Vi går nu åter till säljrekommendation på raps.
Gris
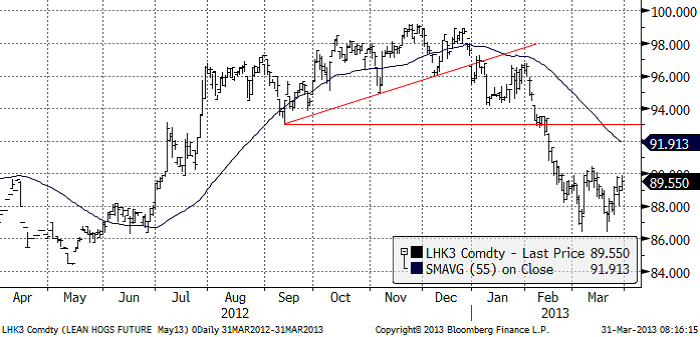
Grispriset (Maj 13) har stabiliserat sig mellan 86 och 90 cent. Det är för tidigt att säga om det här är en konsolidering för en rekyl uppåt, eller en paus inför ytterligare en nedgång.
Mjölk
I kursdiagrammet nedan ser vi fyra kurvor.
BUT1 = priset på det kortaste terminskontraktet på Eurex, på smör.
FSP1 = priset på det kortaste terminskontraktet på Eurex, på SMP.
DPEUWEWM = USDA:s notering på SMP FOB Western Europe.
SMPPMHW2 = Fonterra’s auktionspris på SMP.
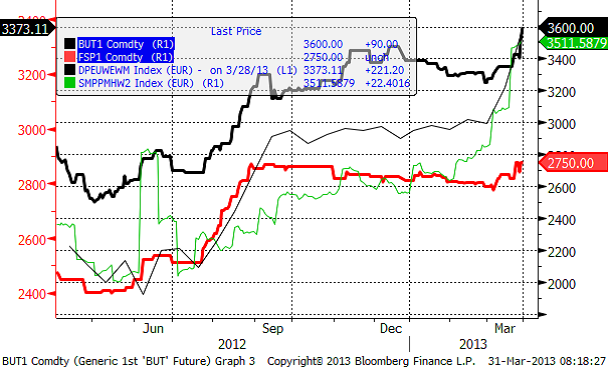
Priset på SMP har rusat och USDA:s notering på europeiska SMP-priser har följt med. Priset på SMP på Eurex har inte följt med, utan ligger på samma nivå som i september och oktober. Terminspriset på smör har däremot handlats upp och ligger nu på all-time-high.
SEB Commodities erbjuder ett litet ”prova-på” kontrakt som består av 0.5 ton Eurex-smör och 0.9 ton Eurex SMP. Ett paket som motsvarar 10 ton flytande mjölkråvara. Just nu är det underliggande värdet på ett sådant kontrakt drygt 33 000 kronor.
Den som vill följa priset på SMP på Eurex gör det via länken:
www.eurexchange.com/exchange-en/products/com/agr/14016/
[box]SEB Veckobrev Jordbruksprodukter är producerat av SEB Merchant Banking och publiceras i samarbete och med tillstånd på Råvarumarknaden.se[/box]
Disclaimer
The information in this document has been compiled by SEB Merchant Banking, a division within Skandinaviska Enskilda Banken AB (publ) (“SEB”).
Opinions contained in this report represent the bank’s present opinion only and are subject to change without notice. All information contained in this report has been compiled in good faith from sources believed to be reliable. However, no representation or warranty, expressed or implied, is made with respect to the completeness or accuracy of its contents and the information is not to be relied upon as authoritative. Anyone considering taking actions based upon the content of this document is urged to base his or her investment decisions upon such investigations as he or she deems necessary. This document is being provided as information only, and no specific actions are being solicited as a result of it; to the extent permitted by law, no liability whatsoever is accepted for any direct or consequential loss arising from use of this document or its contents.
About SEB
SEB is a public company incorporated in Stockholm, Sweden, with limited liability. It is a participant at major Nordic and other European Regulated Markets and Multilateral Trading Facilities (as well as some non-European equivalent markets) for trading in financial instruments, such as markets operated by NASDAQ OMX, NYSE Euronext, London Stock Exchange, Deutsche Börse, Swiss Exchanges, Turquoise and Chi-X. SEB is authorized and regulated by Finansinspektionen in Sweden; it is authorized and subject to limited regulation by the Financial Services Authority for the conduct of designated investment business in the UK, and is subject to the provisions of relevant regulators in all other jurisdictions where SEB conducts operations. SEB Merchant Banking. All rights reserved.

Brent crude has climbed roughly USD 1.5-2 per barrel since Friday, yet falling USD 0.3 per barrel this mornig and currently trading near USD 67.25/bbl after yesterday’s climb. While the rally reflects short-term geopolitical tension, price action has been choppy, and crude remains locked in a broader range – caught between supply-side pressure and spot resilience.

Prices have been supported by renewed Ukrainian drone strikes targeting Russian infrastructure. Over the weekend, falling debris triggered a fire at the 20mtpa Kirishi refinery, following last week’s attack on the key Primorsk terminal.
Argus estimates that these attacks have halted ish 300 kbl/d of Russian refining capacity in August and September. While the market impact is limited for now, the action signals Kyiv’s growing willingness to disrupt oil flows – supporting a soft geopolitical floor under prices.
The political environment is shifting: the EU is reportedly considering sanctions on Indian and Chinese firms facilitating Russian crude flows, while the U.S. has so far held back – despite Bessent warning that any action from Washington depends on broader European participation. Senator Graham has also publicly criticized NATO members like Slovakia and Hungary for continuing Russian oil imports.
It’s worth noting that China and India remain the two largest buyers of Russian barrels since the invasion of Ukraine. While New Delhi has been hit with 50% secondary tariffs, Beijing has been spared so far.
Still, the broader supply/demand balance leans bearish. Futures markets reflect this: Brent’s prompt spread (gauge of near-term tightness) has narrowed to the current USD 0.42/bl, down from USD 0.96/bl two months ago, pointing to weakening backwardation.
This aligns with expectations for a record surplus in 2026, largely driven by the faster-than-anticipated return of OPEC+ barrels to market. OPEC+ is gathering in Vienna this week to begin revising member production capacity estimates – setting the stage for new output baselines from 2027. The group aims to agree on how to define “maximum sustainable capacity,” with a proposal expected by year-end.
While the IEA pegs OPEC+ capacity at 47.9 million barrels per day, actual output in August was only 42.4 million barrels per day. Disagreements over data and quota fairness (especially from Iraq and Nigeria) have already delayed this process. Angola even quit the group last year after being assigned a lower target than expected. It also remains unclear whether Russia and Iraq can regain earlier output levels due to infrastructure constraints.
Also, macro remains another key driver this week. A 25bp Fed rate cut is widely expected tomorrow (Wednesday), and commodities in general could benefit a potential cut.
Summing up: Brent crude continues to drift sideways, finding near-term support from geopolitics and refining strength. But with surplus building and market structure softening, the upside may remain capped.
Brent crude is essentially flat on the week, but after a volatile ride. Prices started Monday near USD 65.5/bl, climbed steadily to a mid-week high of USD 67.8/bl on Wednesday evening, before falling sharply – losing about USD 2/bl during Thursday’s session.
Brent is currently trading around USD 65.8/bl, right back where it began. The volatility reflects the market’s ongoing struggle to balance growing surplus risks against persistent geopolitical uncertainty and resilient refined product margins. Thursday’s slide snapped a three-day rally and came largely in response to a string of bearish signals, most notably from the IEA’s updated short-term outlook.
The IEA now projects record global oversupply in 2026, reinforcing concerns flagged earlier by the U.S. EIA, which already sees inventories building this quarter. The forecast comes just days after OPEC+ confirmed it will continue returning idle barrels to the market in October – albeit at a slower pace of +137,000 bl/d. While modest, the move underscores a steady push to reclaim market share and adds to supply-side pressure into year-end.
Thursday’s price drop also followed geopolitical incidences: Israeli airstrikes reportedly targeted Hamas leadership in Doha, while Russian drones crossed into Polish airspace – events that initially sent crude higher as traders covered short positions.
Yet, sentiment remains broadly cautious. Strong refining margins and low inventories at key pricing hubs like Europe continue to support the downside. Chinese stockpiling of discounted Russian barrels and tightness in refined product markets – especially diesel – are also lending support.
On the demand side, the IEA revised up its 2025 global demand growth forecast by 60,000 bl/d to 740,000 bl/d YoY, while leaving 2026 unchanged at 698,000 bl/d. Interestingly, the agency also signaled that its next long-term report could show global oil demand rising through 2050.
Meanwhile, OPEC offered a contrasting view in its latest Monthly Oil Market Report, maintaining expectations for a supply deficit both this year and next, even as its members raise output. The group kept its demand growth estimates for 2025 and 2026 unchanged at 1.29 million bl/d and 1.38 million bl/d, respectively.
We continue to watch whether the bearish supply outlook will outweigh geopolitical risk, and if Brent can continue to find support above USD 65/bl – a level increasingly seen as a soft floor for OPEC+ policy.
Brent crude makes some gains as Israel’s attack on Hamas in Qatar rattles markets. Brent crude spiked to a high of USD 67.38/b yesterday as Israel made a strike on Hamas in Qatar. But it wasn’t able to hold on to that level and only closed up 0.6% in the end at USD 66.39/b. This morning it is starting on the up with a gain of 0.9% at USD 67/b. Still rattled by Israel’s attack on Hamas in Qatar yesterday. Brent is getting some help on the margin this morning with Asian equities higher and copper gaining half a percent. But the dark cloud of surplus ahead is nonetheless hanging over the market with Brent trading two dollar lower than last Tuesday.

Geopolitical risk premiums in oil rarely lasts long unless actual supply disruption kicks in. While Israel’s attack on Hamas in Qatar is shocking, the geopolitical risk lifting crude oil yesterday and this morning is unlikely to last very long as such geopolitical risk premiums usually do not last long unless real disruption kicks in.
US API data yesterday indicated a US crude and product stock build last week of 3.1 mb. The US API last evening released partial US oil inventory data indicating that US crude stocks rose 1.3 mb and middle distillates rose 1.5 mb while gasoline rose 0.3 mb. In total a bit more than 3 mb increase. US crude and product stocks usually rise around 1 mb per week this time of year. So US commercial crude and product stock rose 2 mb over the past week adjusted for the seasonal norm. Official and complete data are due today at 16:30.
A 2 mb/week seasonally adj. US stock build implies a 1 – 1.4 mb/d global surplus if it is persistent. Assume that if the global oil market is running a surplus then some 20% to 30% of that surplus ends up in US commercial inventories. A 2 mb seasonally adjusted inventory build equals 286 kb/d. Divide by 0.2 to 0.3 and we get an implied global surplus of 950 kb/d to 1430 kb/d. A 2 mb/week seasonally adjusted build in US oil inventories is close to noise unless it is a persistent pattern every week.
US IEA STEO oil report: Robust surplus ahead and Brent averaging USD 51/b in 2026. The US EIA yesterday released its monthly STEO oil report. It projected a large and persistent surplus ahead. It estimates a global surplus of 2.2 m/d from September to December this year. A 2.4 mb/d surplus in Q1-26 and an average surplus for 2026 of 1.6 mb/d resulting in an average Brent crude oil price of USD 51/b next year. And that includes an assumption where OPEC crude oil production only averages 27.8 mb/d in 2026 versus 27.0 mb/d in 2024 and 28.6 mb/d in August.
Brent will feel the bear-pressure once US/OECD stocks starts visible build. In the meanwhile the oil market sits waiting for this projected surplus to materialize in US and OECD inventories. Once they visibly starts to build on a consistent basis, then Brent crude will likely quickly lose altitude. And unless some unforeseen supply disruption kicks in, it is bound to happen.
US IEA STEO September report. In total not much different than it was in January

US IEA STEO September report. US crude oil production contracting in 2026, but NGLs still growing. Close to zero net liquids growth in total.


Tyskland har så höga elpriser att företag inte har råd att använda elektricitet
Brent crude ticks higher on tension, but market structure stays soft

Kinas elproduktion slog nytt rekord i augusti, vilket även kolkraft gjorde

Det stigande guldpriset en utmaning för smyckesköpare

Aktier i guldbolag laggar priset på guld

Meta bygger ett AI-datacenter på 5 GW och 2,25 GW gaskraftverk
Aker BP gör ett av Norges största oljefynd på ett decennium, stärker resurserna i Yggdrasilområdet
Brent sideways on sanctions and peace talks

Ett samtal om koppar, kaffe och spannmål
Sommarens torka kan ge högre elpriser i höst
-
 Nyheter4 veckor sedan
Meta bygger ett AI-datacenter på 5 GW och 2,25 GW gaskraftverk
-
 Nyheter4 veckor sedan
Aker BP gör ett av Norges största oljefynd på ett decennium, stärker resurserna i Yggdrasilområdet
-
Analys4 veckor sedan
Brent sideways on sanctions and peace talks
-
 Nyheter4 veckor sedan
Ett samtal om koppar, kaffe och spannmål
-
 Nyheter4 veckor sedan
Sommarens torka kan ge högre elpriser i höst
-
Analys4 veckor sedan
Brent edges higher as India–Russia oil trade draws U.S. ire and Powell takes the stage at Jackson Hole
-

 Nyheter3 veckor sedan
Mahvie Minerals är verksamt i guldrikt område i Finland
-
Analys3 veckor sedan
Increasing risk that OPEC+ will unwind the last 1.65 mb/d of cuts when they meet on 7 September