

Analys
SEB Jordbruksprodukter, 21 januari 2013
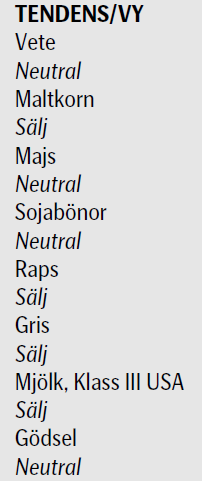
 Det var allmän prisuppgång – mot de fallande pristrenderna – i veckan på spannmål och oljeväxter. Även om torkan i USA slog nya rekord i veckan som gick, ser den tekniska bilden inte så tydligt positiv ut. Vi går därför över från köprekommendation på vete och majs, till neutral rekommendation. Vi byter rekommendation från sälj till neutral på sojabönor. Effekten av WASDE-rapporten har ebbat ut och på ena sidan har marknaden nu torkan i USA och kanske bristen på nederbörd i Argentina. På den andra finns det faktum att priset är högt och därmed ska stimulera till högre produktion.
Ny börs för durum-vete öppnar i Italien
 Borsa Italiana, som driver den italienska aktiebörsen i Milano, startar handel med terminer på durumvete idag, måndagen den 21 januari. Futureskontrakten går under namnet ”AGREX”. Syftet är att hjälpa pastaproducenterna att hantera prissvängningarna. Italien är också världens största producent av grödan, som också går på export till länder i Nordafrika och Mellanöstern, där den anrättas till couscous. Barilla, som är världens största pastaproducent och köper 70% av sin råvara från Italien, välkomnar börsen och de möjligheter den ger att minska riskerna. Barilla har också väglett börsen i skapandet av ett kontrakt som ska vara så användbart som möjligt för riskhantering i branschen. AGREX-kontrakten är på 50 ton och kontraktsmånaderna är mars, maj, september och december. Handeln sker på derivatbörsen IDEM och leveranspunkten är den syditalienska staden Foggia.
Odlingsväder
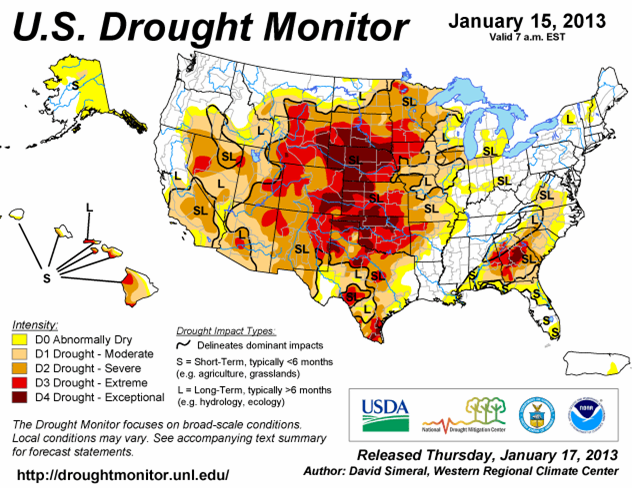
Torkan i USA håller i sig, som vi ser i den senaste ”Drought Monitor”, som publicerades i torsdags. Sedan förra veckan har torkan förvärrats.
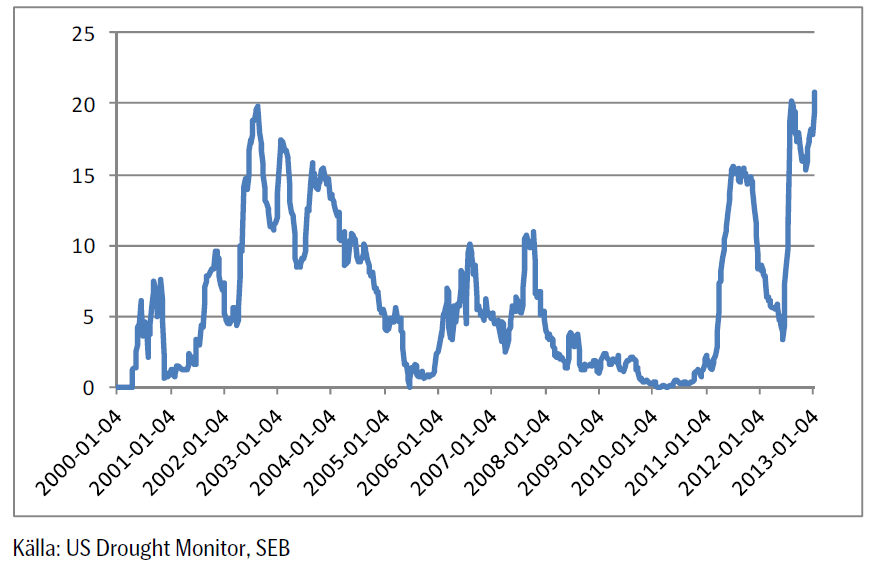
Om vi summerar andelen av USA som är drabbad av D3 (extrem torka) och D4 (exceptionell torka) och gör ett diagram över tiden, får vi nedanstående bild. Där ser vi att 20.8% av USA är drabbat av de svåraste kategorierna av torka. Det är det mesta de senaste tio åren, så långt det finns data tillgängligt.
Torsdagens långtidsprognos från NOAA sade att ”varmt och torrt” väder kommer att fortsätta råda på Prärien fram till och under sommaren.
Det regnar normalt i norra Brasilien. Argentina och södra Brasilien är torrt och väntas fortsätta vara torrt så långt som prognoserna är tillförlitliga (10 dagar). Argentina har varit torrt ett ganska långt tag nu. Hela EU får mer nederbörd än normalt nu, utom Skandinavien. Det är också kallare än normalt i praktiskt taget hela EU.
Den senaste IGC-rapporten
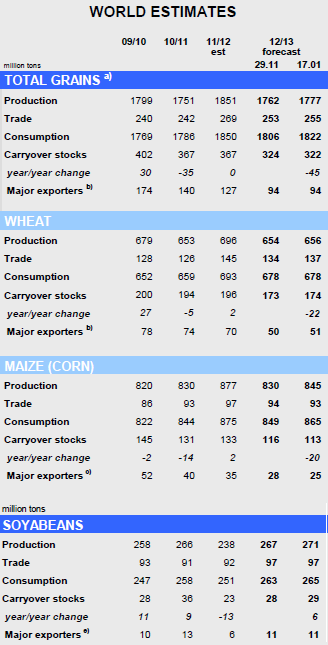
IGC (International Grains Council) justerar upp sitt estimat något för den globala spannmålsproduktionen 2012/13 från 1762 mt till 1777 mt, vilket dock är betydligt lägre än produktionen 2011/12. Trots en förväntad nedgång i konsumtionen för första gången på 14 år, så väntas lagren att minska med 45 mt.
Den globala produktionen av vete 2012/13 justeras upp med 2 mt till 656 mt, som en följd av högre produktion i Australien (+0.5 mt) , Kanada (+0.5 mt), Kina (+0.6 mt) och EU-27 (+0.3 mt), vilket dock är en minskning från 696 mt 2011/12. Utgående lager justeras upp med 1 mt till 174 mt, vilket dock är en minskning med 22 procent på årsbasis till följd av markant nedgång i OSS. Fokus ligger nu på tillståndet för norra halvklotets höstgrödor 2013/13, särskilt för de områden i USA som drabbats av torka. På andra håll i världen är utsikterna generellt mer lovande och den globala produktionen förväntas preliminärt att öka med 4 procent på årsbasis för 2013/14, med en ökning av areal på 2 procent.
IGC justerar upp estimatet för den globala majsproduktionen med nästan 2 procent jämfört med förra månaden som en följd av högre estimat för Kina (+10 mt), USA (+1.4 mt) och ljusare utsikter för Argentina, men då även konsumtionen justeras upp så revideras utgående lager ner med 3 mt till 113 mt, den snävaste nivån på nio år. Den globala produktionen av sojabönor 2012/13 justeras upp av IGC till rekordhöga 271 mt, vilket är en ökning med 14 procent på årsbasis som en följd av en förväntad markant ökning av produktionen i Sydamerika. Den globala produktionen av raps/canola 2012/13 förväntas minska med 3 procent på årsbasis.

Vete
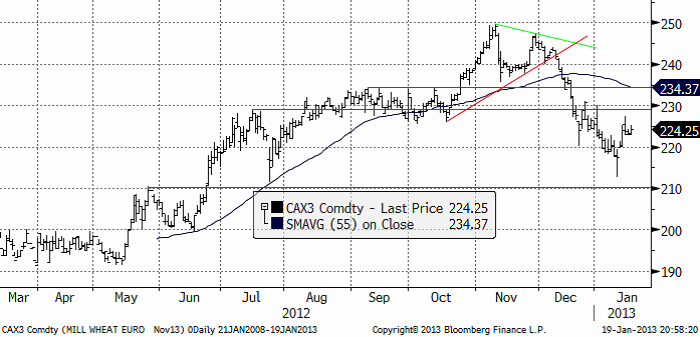
Nedan ser vi november (2013) kontraktet, där priset föll kraftigt i fredags, men återhämtade sig och stängde på 217.50, nästan oförändrat på dagen.
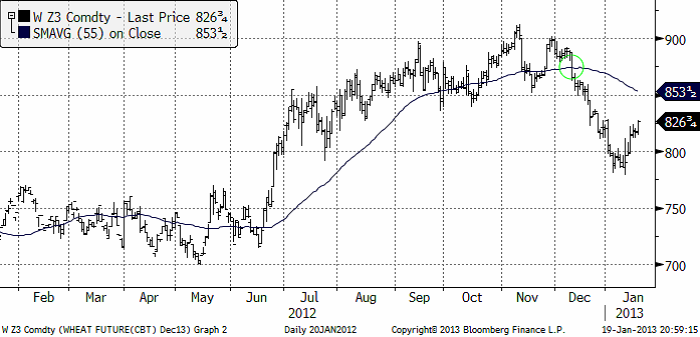
Nedan ser vi decemberkontraktet på CBOT. Chicago-vetet var ovanligt starkt i veckan, men så är det också världens billigaste vete.
Vi ser här en bild på terminskurvorna för Matif och Chicago, båda omräknade till euro per ton.
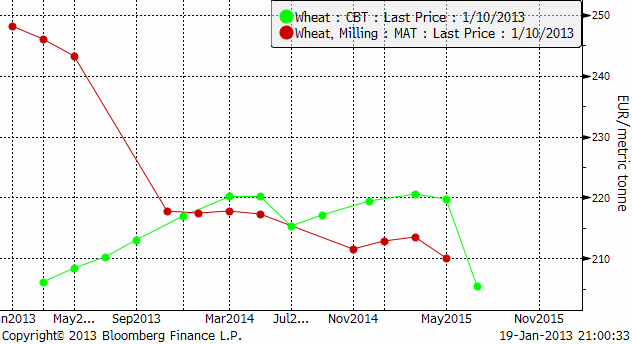
Av diagrammet ovan ser man att gammal skörd av Matif-vete är avsevärt mycket dyrare än Chicagovetet. Maj-terminen handlas dessutom lägre än mars-terminen. Det säger att den som väntar med att sälja till maj riskerar att få väsentligt sämre betalt – och dessutom får bära ränte- och lagerkostnader fram till dess.
Den som vill ta en position på högre priser och har fysiskt vete i lager gör därför sannolikt bäst i att sälja den fysiska varan och istället köpa terminer.
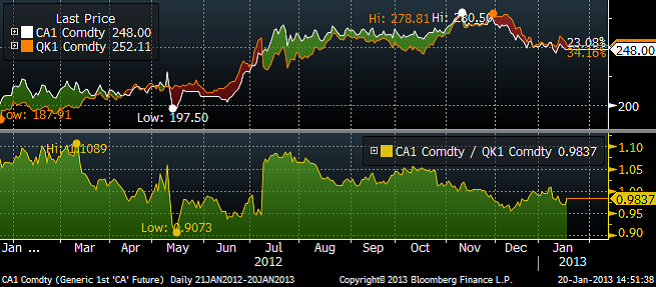
En annan utveckling vi sett den senaste tiden är att bristen på fodervete i norra Europa inneburit att denna blivit dyrare än brödvete. I veckan gick en last fodervete från Frankrike till norra Tyskland erfar vi.
I diagrammet nedan ser vi, i den nedre delen, kvoten mellan ”spotkontraktet” på Matif och spotkontraktet på Liffe för engelskt fodervete. Vi ser att fodervetet i år blivit ett par procent dyrare än brödvetet.
Strategie Grains justerar ner sitt estimat för EU:s veteproduktion 2013/14 med 1.7 mt till 133.3 mt som en följd av det blöta vädret under sådden och lägre areal. Nedjusteringar görs för grödor i bl.a Sverige, Danmark, Frankrike Tyskland, och framförallt Storbritannien. En produktion på 133 mt skulle dock fortfarande innebära en förbättring jämfört med de 123.9 mt som unionen uppnådde förra året då blött väder förstörde skördar i delar av nordvästra Europa medan de östra delarna drabbades av torka.
Argentinas jordbruksdepartement sänkte skördeestimatet med 400,000 ton till 10.1 mt. USDA hade 11 mt i WASDE:n från den 11 januari. Buenos Aires Grain Exchange (BAGE) ligger på 9.8 mt.
Det kinesiska vetepriset FOB lagerhus i Shanghai (svart linje nedan) har hittills i år fallet ner med 5 euro till 294.74 euro / ton. Vi får tolka det som ett styrketecken, eftersom det är ordentligt mycket mindre än t ex Matif (blå linje nedan).
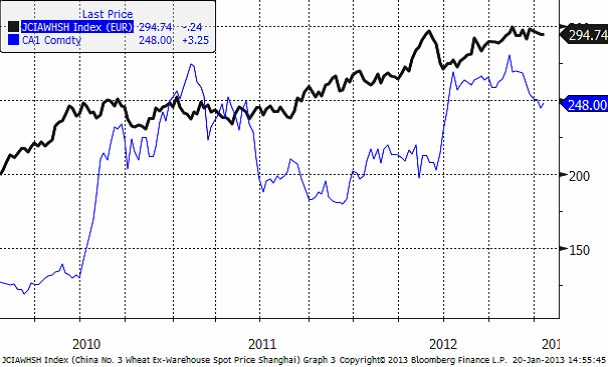
Fundamentalt talar de flesta faktorer för ett stigande pris. Rapporten från Strategie Grains gör det däremot inte. Tekniskt ser uppgången ut som en rekyl i en fallande marknad. Därför går vi nu över till neutral rekommendation på vete.
Maltkorn
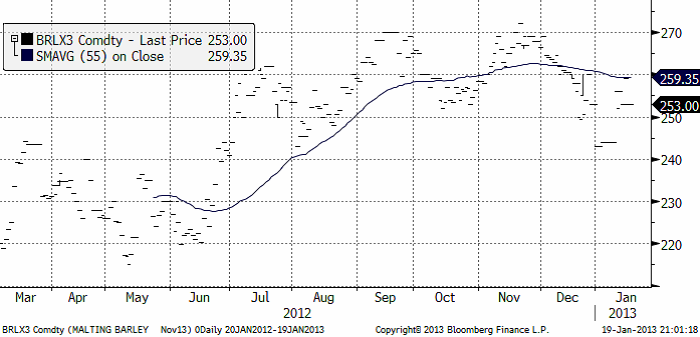
November 2013-kontraktet steg först upp till 260 euro men föll sedan ner till 253 euro, 1 euro högre än förra veckans stängning. Detta innebär att 240 euro-nivån höll. Där fanns verkligen motiverade köpare.
Potatis
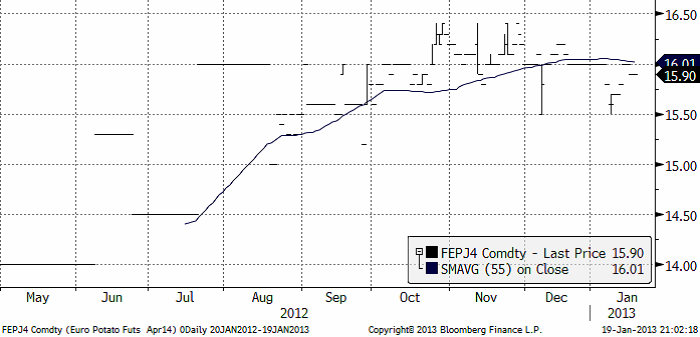
Potatispriset för leverans i april nästa år (2014) steg från 15.70 för en vecka sedan till 15.90 i fredags vid stängning.
Majs
Majspriset (december 2013) fortsatte att stiga hela förra veckan, efter WASDE-rapporten fredagen den 11 januari. Tekniskt ser det ut som en rekyl uppåt mot en fallande trend. 600 cent på decemberkontraktet har tidigare bevisat sig vara en viktig nivå, som nu fungerar som ett motstånd. Den tekniska analysen indikerar alltså att prisuppgången efter lager- och WASDE-rapporten från USDA, börjar närma sig sitt slut och att trenden nedåt kan fortsätta.
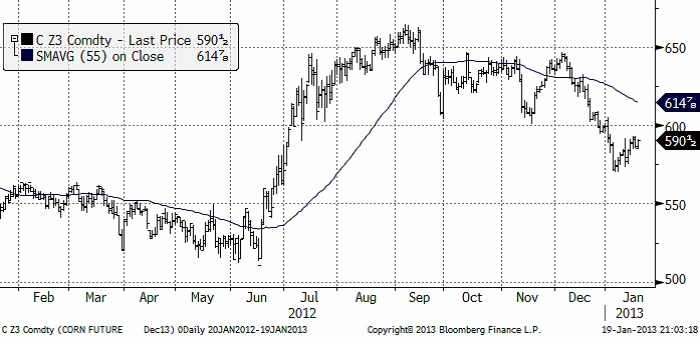
Fundamentalt pekar nyhetsflödet dock i motsatt riktning. Nyheterna, särskilt NOAA:s långtidsprognos om varmt och torrt väder i centrala USA (corn belt), gör att oron ökat i veckan.
Den veckovisa exportstatistiken för majs från USA förbättrades 16 Mbu, till en ackumulerad nivå på 518 Mbu för marknadsföringsåret. Det är dock 49% mindre än förra året.
Antalet nötkreatur i USA rapporteras nu ligga på 60-års-lägsta, efter att de slaktats ut i brist på foder (crop condition var ännu sämre för betesmark i USA, än de var för majs i somras/höstas).
BAGE rapporterade i veckan att 93% av sådden är klar i Argentina. Det väntas vara fortsatt torrt i landet. De flesta lokala estimat på skörden ligger väsentligt under jordbruksdepartementets och USDA:s estimat på 28 – 30 mt. De lokala estimaten ligger ca 5 mt lägre kring 24 – 25 mt. Argentinas export väntas vara tidig. Dels för att terminskurvan är i backwardation. Att vänta ger förmodligen lägre pris. Man vill säkert också komma före Brasiliens bönder, som skördar lite efter Argentinas – vilket återspeglar sig i terminskurvan.
Tisdagens Department of Energy (DOE) rapport var en besvikelse vad gäller etanolefterfrågan. Sammanfattnignsvis: Ihållande torka i USA, som enligt NOAA väntas hålla i sig till sommaren, gör att många lär hålla i sin gamla skörd av majs. Argentinas skörd tycks av dem närmast marken (lokala estimat) ligga väsentligt lägre än vad USDA förutspådde för en vecka sedan. Nästan allt – utom etanolefterfrågan och foderefterfrågan i USA – pekar på att priset borde kunna fortsätta att stiga. Mot detta talar den tekniska analysen. Så där är vi. Till nästa vecka behåller vi vår positiva vy, men tycker att man ska ta hem vinster på långa positioner om priset närmar sig 600 cent – i väntan på mer information
Sojabönor
Sojabönorna hängde med majs och vete uppåt, också med stöd av en något svagare dollar i veckan. Trenden är alltjämt nedåtriktad. Brottet av stödlinjen visade sig falskt, än så länge. 55-dagars glidande medelvärde, som många tittar på, ligger strax över dagens kursnivå och kan ge anledning till säljordrar kring den. Tekniskt är bilden ännu i vänteläge. Stiger kursen från de här nivåerna, bryts den nedåtgående trenden.
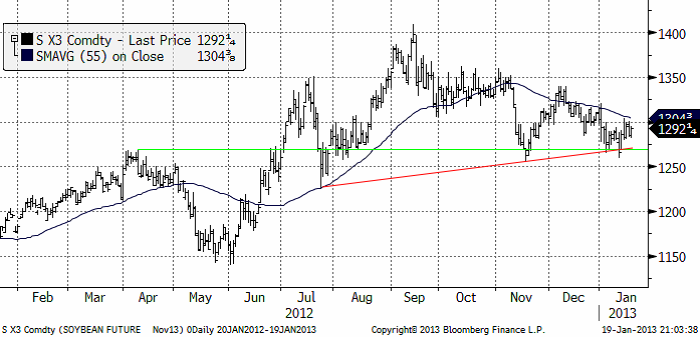
Just nu finns inga signaler om styrka eller svaghet, så bäst är att vara neutral. Vi byter alltså rekommendation från sälj till neutral.
Raps
Rapspriset (november 2013) fann stöd vid 415 euro. Det senaste prisfallet nådde faktiskt inte ända ner till 415 euro. Det fanns alltså ivriga fyndköpare som väntade.
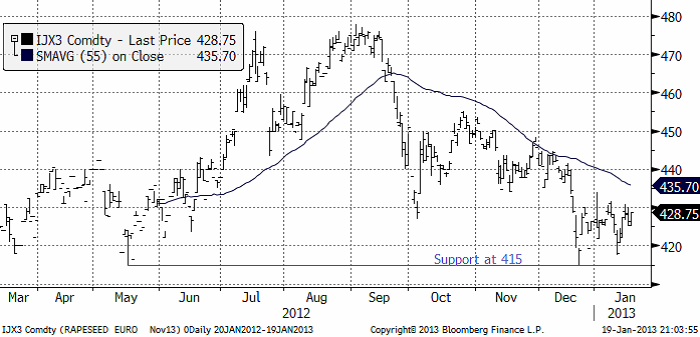
Trenden har varit nedåtriktad sedan i september / oktober. Frågan är om det håller på att vända nu. Det är lite för tidigt att ändra rekommendation och med tanke på att det finns motstånd på ovansidan redan på 430 euro-nivån, går det inte att ändra rekommendation från sälj till köp. Vi ligger alltså kvar med säljrekommendation i väntan på ny information.
Gris
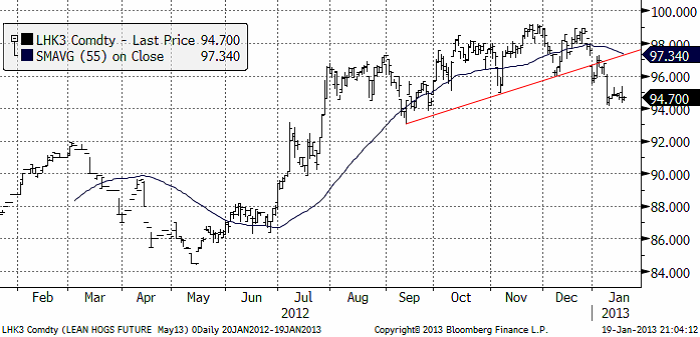
Grispriset (Maj 13), amerikansk Lean Hogs, har brutit en teknisk stödnivå (röd linje i diagrammet nedan). 94 cent per pund var första stödnivån, men antagligen fortsätter priset ner mot 92 cent i första hand.
Omfattningen av grisbranschen i USA visade en liten uppgång det sista kvartalet förra året. Det var en ökning med 29,000 djur. Antalet djur har sedan 90-talet minskat från 7.5 miljoner djur till 5.8 miljoner, som vi ser i diagrammet nedan.
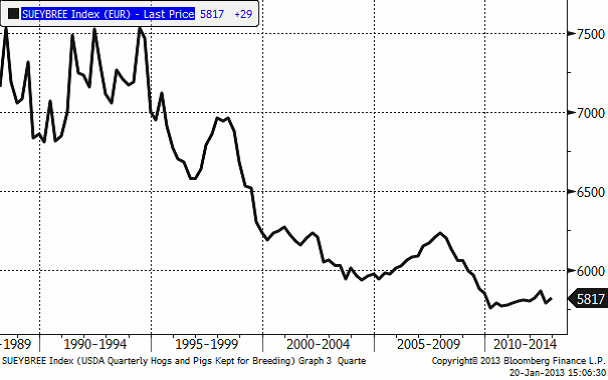
Antal djur
På samma sätt har hjorden av nötkreatur i USA fortsatt att minska, men där såg vi en ny bottennotering i den senaste statistiken.
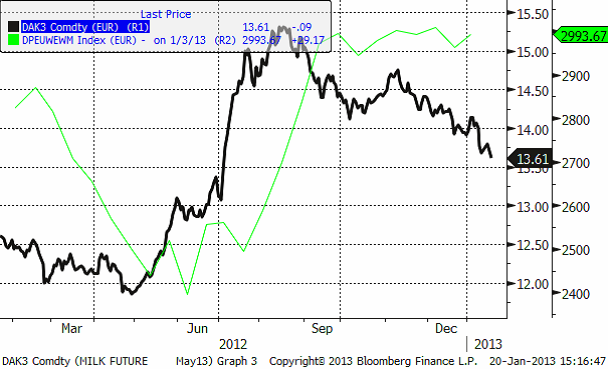
Mjölk
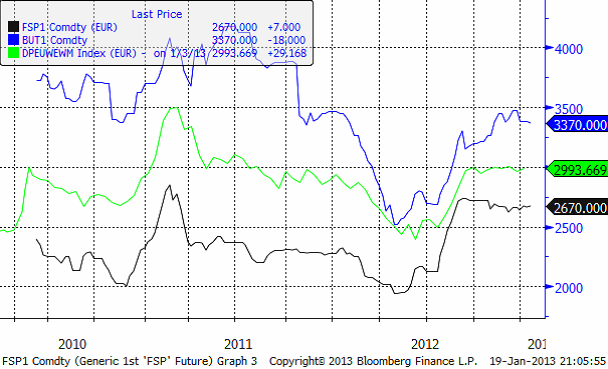
I diagrammet nedan ser vi tre kurvor.Den gröna linjen är priset på skummjölkspulver i euro per ton på Eurex-börsen. Den blå är priset på smör på Eurex börsen. Priserna på Eurex anges i euro per ton.
Slutligen så den gröna linjen. Den visar priset på helmjölkspulver (WMP) FOB Västeuropa. Källan är USDA och priserna uppdateras varannan vecka. Vi ser att WMP-priset legat stabilt det fjärde kvartalet förra året, med en liten nedgång mot slutet av året. 2013 har dock börjat med en liten prisuppgång.
Det börsbaserade priset i svenska kronor beräknas med formeln:
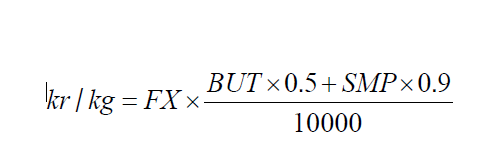
där
BUT = priset på smör i euro per ton
SMP = priset på skummjölkspulver i euro per ton
FX = växelkursen för EURSEK.
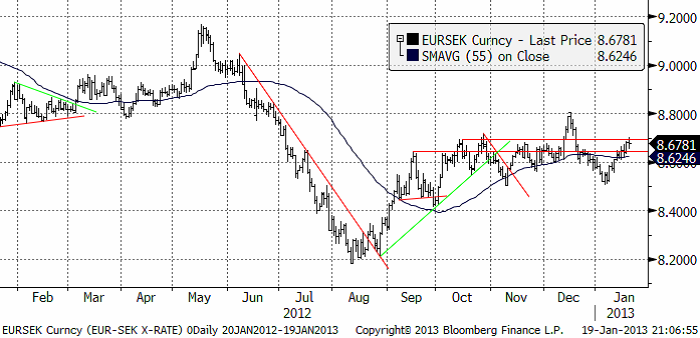
EURSEK
EURSEK stärktes successivt under veckan som gick och nådde upp till de gamla motståndsnivåerna. Det finns inte mycket ny information som ger anledning till att anta annat än att den ”sidledes” rörelse vi sett de senaste månaderna ska fortsätta.
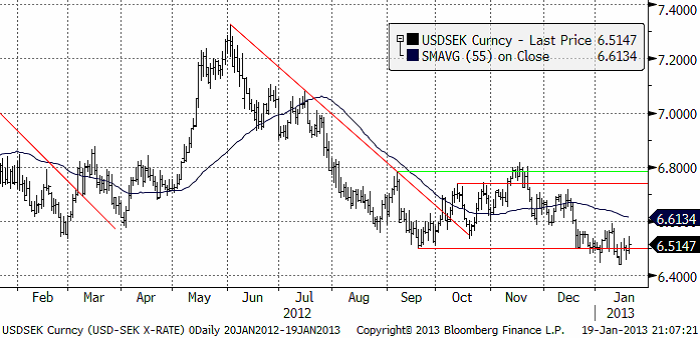
USDSEK
Dollarn föll mot kronan i veckan som gick. Det är fortsatt instabilt finansiellt och politiskt i USA. Stödnivån från botten i september är bruten, men det blev inte något förnyat kursfall i veckan. Trenden är dock nedåt och även om det blir lite ”sidledes” rörelse i veckan, tycks trenden vara nedåt.
[box]SEB Veckobrev Jordbruksprodukter är producerat av SEB Merchant Banking och publiceras i samarbete och med tillstånd på Råvarumarknaden.se[/box]
Disclaimer
The information in this document has been compiled by SEB Merchant Banking, a division within Skandinaviska Enskilda Banken AB (publ) (“SEB”).
Opinions contained in this report represent the bank’s present opinion only and are subject to change without notice. All information contained in this report has been compiled in good faith from sources believed to be reliable. However, no representation or warranty, expressed or implied, is made with respect to the completeness or accuracy of its contents and the information is not to be relied upon as authoritative. Anyone considering taking actions based upon the content of this document is urged to base his or her investment decisions upon such investigations as he or she deems necessary. This document is being provided as information only, and no specific actions are being solicited as a result of it; to the extent permitted by law, no liability whatsoever is accepted for any direct or consequential loss arising from use of this document or its contents.
About SEB
SEB is a public company incorporated in Stockholm, Sweden, with limited liability. It is a participant at major Nordic and other European Regulated Markets and Multilateral Trading Facilities (as well as some non-European equivalent markets) for trading in financial instruments, such as markets operated by NASDAQ OMX, NYSE Euronext, London Stock Exchange, Deutsche Börse, Swiss Exchanges, Turquoise and Chi-X. SEB is authorized and regulated by Finansinspektionen in Sweden; it is authorized and subject to limited regulation by the Financial Services Authority for the conduct of designated investment business in the UK, and is subject to the provisions of relevant regulators in all other jurisdictions where SEB conducts operations. SEB Merchant Banking. All rights reserved.

Wild moves yesterday. Brent crude traded to a high of $114.43/b and a low of $96.0/b and closed at $99.94/b yesterday.

US – Iran negotiations ongoing or not? What a day. Donald Trump announced that good talks were ongoing between Iran and the US and that the 48 hour deadline before bombing Iranian power plants and energy infrastructure was postponed by five days subject to success of ongoing meetings. Iranian media meanwhile stated that no meetings were ongoing at all.
Today we are scratching our heads trying to figure out what yesterday was all about.
Friends and family playing the market? Was it just Trump and his friends and family who were playing with oil and equity markets with $580m and $1.46bn in bets being placed by someone in oil and equity markets just 15 minutes before Trump’s announcement?
Was Trump pulling a TACO as he reached his political and economic pain point: Brent at $112/b, US Gas at $4/gal, SPX below 200dma and US 10yr above 4.4%?
Different Iranian factions with Trump talking with one of them? Are there real negotiations going on but with the US talking to one faction in Iran while another, the hardliners, are not involved and are denying any such negotiations going on?
Extending the ultimatum to attack and invade Kharg island next weekend? Or, is the five day delay of the deadline a tactical decision to allow US amphibious assault ships and marines to arrive in the Gulf in the upcoming weekend while US and Israeli continues to degrade Iranian military targets till then. And then next weekend a move by the US/Israel to attack and conquer for example the Kharg island?
We do not really know which it is or maybe a combination of these.
We did get some kind of TACO ydy. But markets have been waiting for some kind of TACO to happen and yesterday we got some kind of TACO. And Brent crude is now trading at $101.5/b as a result rather than at $112-114/b as it did no the high yesterday.
But what really matters in our view is the political situation on the ground in Iran. Will hardliners continue to hold power or will a more pragmatic faction gain power?
If the hardliners remain in power then oil pain should extend all the way to US midterm elections. The hardliners were apparently still in charge as of last week. Iran immediately retaliated and damaged LNG infrastructure in Qatar after Israel hit Iranian South Pars. The SoH was still closed and all messages coming out of Iran indicated defiance. Hardliners continues in power has a huge consequence for oil prices going forward. The regime has played its ’oil-weapon’ (closing or chocking the Strait of Hormuz). It is using it to achieve political goals. Deterrence: it needs to be so politically and economically expensive to attack Iran that it won’t happen again in the future. Or at least that the US/Israel thinks 10-times over before they attack again. The highest Brent crude oil closing price since the start of the war is $112.19/b last Friday. In comparison the 20-year inflation adjusted Brent price is $103/b. So Brent crude last Friday at $112.19/b isn’t a shockingly high price. And it is still far below the nominal high of $148/b from 2008 which is $220/b if inflation adjusted. So once in a lifetime Iran activates its most powerful weapon. The oil weapon. It needs to show the power of this weapon and it needs to reap political gains. Getting Brent to $112/b and intraday high of $119.5/b (9 March) isn’t a display of the power of that weapon. And it is not a deterrence against future attacks.
So if the hardliners remain in power in Iran, then the SoH will likely remain chocked all the way to US midterm elections and Brent crude will at a minimum go above the historical nominal high of $148/b from 2008.
Thus the outlook for the oil price for the rest of the year doesn’t depend all that much of whether Trump pulls a TACO or not. Stops bombing or not. It depends more on who is in charge in Iran. If it is the hardliners, then deterrence against future attacks via chocking of the SoH and high oil prices is the likely line of action. It is impacting the world but the Iranian ’oil-weapon’ is directed towards the US president and the the US midterm elections.
If a pragmatic faction gets to power in Iran, then a very prosperous future is possible. However, if power is shifting towards a more pragmatic faction in Iran then a completely different direction could evolve. Such a faction could possibly be open for cooperation with the US and the GCC and possibly put its issues versus Israel aside. Then the prosperity we have seen evolving in Dubai could be a possible future also for Iran.
So far it looks like the hardliners are fully in charge. As far as we can see, the hardliners are still fully in control in Iran. That points towards continued chocking of the SoH and oil prices ticking higher as global inventories (the oil market buffers) are drawn lower. And not just for a few more weeks, but possibly all the way to the US midterm elections.
A brief sigh of relief yesterday as oil infra at Kharg wasn’t damaged. But higher today. Brent crude dabbled around a bit yesterday in relief that oil infrastructure at Iran’s Kharg island wasn’t damaged. It traded briefly below the 100-line and in a range of $99.54 – 106.5/b. Its close was near the low at $100.21/b.
No easy victorious way out for Trump. So no end in sight yet. Brent is up 3.2% today to $103.4/b with no signs that the war will end anytime soon. Trump has no easy way to declare victory and mission accomplished as long as Iran is in full control of the Strait of Hormuz while also holding some 440 kg of uranium enriched to 60% and not far from weapons grade at 90%. As long as these two factors are unresolved it is difficult for Trump to pull out of the Middle East. Naturally he gets increasingly frustrated over the situation as the oil price and US retail gas prices keeps ticking higher while the US is tied into the mess in the Middle East. Trying to drag NATO members into his mess but not much luck there.
When commodity prices spike they spike 2x, 3x, 4x or 5x. Supply and demand for commodities are notoriously inflexible. When either of them shifts sharply, the the price can easily go to zero (April 2022) or multiply 2x, 3x, or even 5x of normal. Examples in case cobalt in 2025 where Kongo restricted supply and the price doubled. Global LNG in 2022 where the price went 5x normal for the full year average. Demand for tungsten in ammunition is up strongly along with full war in the middle east. And its price? Up 537%.
Why hasn’t the Brent crude oil price gone 2x, 3x, 4x or 5x versus its normal of $68/b given close to full stop in the flow of oil of the Strait of Hormuz? We are after all talking about close to 20% of global supply being disrupted. The reason is the buffers. It is fairly easy to store oil. Commercial operators only hold stocks for logistical variations. It is a lot of oil in commercial stocks, but that is predominantly because the whole oil system is so huge. In addition we have Strategic Petroleum Reserves (SPRs) of close to 2500 mb of crude and 1000 mb of oil products. The IEA last week decided to release 400 mb from global SPR. Equal to 20 days of full closure of the Strait of Hormuz. Thus oil in commercial stocks on land, commercial oil in transit at sea and release of oil from SPRs is currently buffering the situation.
But we are running the buffers down day by day. As a result we see gradually increasing stress here and there in the global oil market. Asia is feeling the pinch the most. It has very low self sufficiency of oil and most of the exports from the Gulf normally head to Asia. Availability of propane and butane many places in India (LPG) has dried up very quickly. Local prices have tripled as a result. Local availability of crude, bunker oil, fuel oil, jet fuel, naphtha and other oil products is quickly running down to critical levels many places in Asia with prices shooting up. Oman crude oil is marked at $153/b. Jet fuel in Singapore is marked at $191/b.
Oil at sea originating from Strait of Hormuz from before 28 Feb is rapidly emptied. Oil at sea is a large pool of commercial oil. An inventory of oil in constant move. If we assume that the average journey from the Persian Gulf to its destinations has a volume weighted average of 13.5 days then the amount of oil at sea originating from the Persian Gulf when the the US/Israel attacked on 28 Feb was 13.5 days * 20 mb/d = 269 mb. Since the strait closed, this oil has increasingly been delivered at its destinations. Those closest to the Strait, like Pakistan, felt the emptying of this supply chain the fastest. Propane prices shooting to 3x normal there already last week and restaurants serving cold food this week is a result of that. Some 50-60% of Asia’s imports of Naphtha normally originates from the Persian Gulf. So naphtha is a natural pain point for Asia. The Gulf also a large and important exporter of Jet fuel. That shut in has lifted jet prices above $200/b.
To simplify our calculations we assume that no oil has left the Strait since that date and that there is no increase in Saudi exports from Yanbu. Then the draining of this inventory at sea originated from the Persian Gulf will essentially look like this:
The supply chain of oil at sea originating from the Strait of Hormuz is soon empty. Except for oil allowed through the Strait of Hormuz by Iran and increased exports from Yanbu in the Red Sea. Not included here.

Oil at sea is falling fast as oil is delivered without any new refill in the Persian Gulf. Waivers for Russian crude is also shifting Russian crude to consumers. Brent crude will likely start to feel the pinch much more forcefully when oil at sea is drawn down another 200 mb to around 1000 mb. That is not much more than 10 days from here.

Oil and oil products are starting to become very pricy many places. Brent crude has still been shielded from spiking like the others.

Closing at highest since Aug 2022. Brent crude gained 9.2% yesterday. The trading range was limited to $95.2 – 101.85/b with a close at $100.46/b and higher than the Monday close of $98.96/b. Ydy close was the highest close since August 2022. This morning Brent is up 2% to $102.4/b and is trading at the highest intraday level since Monday when it high an intraday high of $119.5/b.
A military hit at Iran’s Kharg island would be a big, big bang for the oil price. The big, big risk for the weekend is that oil infrastructure could be damaged. For example Iran’s Kharg island which is Iran’s major oil export hub. If damaged we would have a longer lasting loss of supply stretching way beyond Trump’s announced ”two more weeks”. It will make the spot price spike higher and it will lift the curve. Brent crude 2027 swap would jump above $80/b immediately. An attack on Kharg island would naturally lead Iran to strike back at other oil infrastructures in the Gulf. Especially those belonging to countries who harbor US military bases. I.e. countries who essentially are supporting the attack by US and Israel towards Iran. Though if not in spirit, then in practical operational terms. An attack on Kharg island would not just lead to a lasting outage of supply from Iran until it would be repaired. It would immediately endanger other oil infrastructure in the region as well and additional lasting loss of supply.
No one in their right mind would dare to sit short oil over the coming weekend. Oil is thus set to close the week at a very strong note today.
Prepare for another 400 mb SPR release next week. This week’s announcement of a 400 mb release from Strategic Oil Reserves totally underwhelmed the market with the oil price going higher rather than lower following the announcement. For one it means that the market expects the war and the closure of the Strait of Hormuz to last longer than Trump’s recent announced ”two more weeks”. 400 mb only amounts to 20 days of lost supply to the world through Hormuz and we are already at day 14. So next week when we are getting close to the 20 day mark, we are likely to see another announcement of another 400 mb release of SPR stocks to the market. Preparing for the next 20 days of war.
Global oil logistics in total disarray. We have previously addressed the issue of the huge logistical web of the global oil market which is now in total disarray. The logistical disruption started to fry the oil market at the end of last week. Helped to spike the oil market on Monday. What we hear from our shipping clients is that the problems with supply of fuels locally in Korea, Singapore, India and Africa are getting worse with physical availability of fuels there drying up. It is getting increasingly difficult to find physical supply of bunker oil with local, physical prices shooting way higher than financial benchmarks. To the point that biofuels have become the cheap option many places. Availability of fuels in the US is still good. Not so surprising as the US is self-sufficient with crude and refineries.
The disruption in global oil logistics doesn’t seem to improve. Rather the opposite. If you cannot get fuel to run your ships, then how can you distribute fuels to where it is needed.
Buy Brent Dec-2026 calls with strike $150/b!! As the days goes by the oil price is ticking higher while Trump is getting one day closer to US midterm elections. Trump was betting that he could put this war to bead well before November. But that will probably not be up to him to decide. It will be up to Iran to decide when to reopen the Strait of Hormuz. It is very hard to imagine that Iran will let Trump easily off the hock after he has killed its Supreme Leader. This will likely go all the way to November. Buy Brent Dec-2026 calls with strike $150/b!!
Brent closed at highest since 2022 ydy. Will end this Friday at a very strong note! Consumers still dreaming of $60/b oil


Christian Kopfer om läget för oljan

Marknaden måste börja betrakta de höga kopparpriserna som det nya normala

Det fysiska spotpriset på brentolja har slagit nytt rekord

40 minuter med Javier Blas om hur världen verkligen påverkas av energikrisen

Efter tillväxten: Guldbrev satsar på expansion i Europa
40 minuter med Javier Blas om hur världen verkligen påverkas av energikrisen

Elpriserna fördubblas, stor osäkerhet inför sommaren

MP Materials, USA:s svar på Kinas dominans över sällsynta jordartsmetaller
Det fysiska spotpriset på brentolja har slagit nytt rekord

Studsvik har idag ansökt om att få bygga 1200-1600 MW kärnkraft i Valdemarsvik
-
 Nyheter2 veckor sedan
40 minuter med Javier Blas om hur världen verkligen påverkas av energikrisen
-
 Nyheter3 veckor sedan
Elpriserna fördubblas, stor osäkerhet inför sommaren
-
 Nyheter4 veckor sedan
MP Materials, USA:s svar på Kinas dominans över sällsynta jordartsmetaller
-
 Nyheter2 veckor sedan
Det fysiska spotpriset på brentolja har slagit nytt rekord
-
 Nyheter4 veckor sedan
Studsvik har idag ansökt om att få bygga 1200-1600 MW kärnkraft i Valdemarsvik
-
 Nyheter2 veckor sedan
Marknaden måste börja betrakta de höga kopparpriserna som det nya normala
-

 Nyheter4 veckor sedan
Matproduktion är beroende av gödsel, Gulfkriget skapar brist
-
Analys4 veckor sedan
TACO (or Whatever It Was) Sends Oil Lower — Iran Keeps Choking Hormuz