

Analys
SEB Jordbruksprodukter, 14 april 2014


 Priserna på spannmål och oljeväxter har generellt sett utvecklats positivt, drivna av torka i USA för vete, lägre areal än förväntat i USA för majs, oron för lägre odlad areal och sämre avkastning i Ukraina och av torkan i januari/februari i Brasilien. Nu har crop ratings kommit för USA:s vete och det är dåligt, men bara 1% sämre än förra årets första estimat. Brasiliens CONAB justerar upp produktionen för flera torkdrabbade jordbruksprodukter och aktiemarknaden har varit väldigt svag de senaste dagarna. En fallande aktiemarknad kan få konsumenterna att hålla igen. Det ser alltså återigen lite svagare ut på marknaderna för jordbruksprodukter.
Odlingsväder
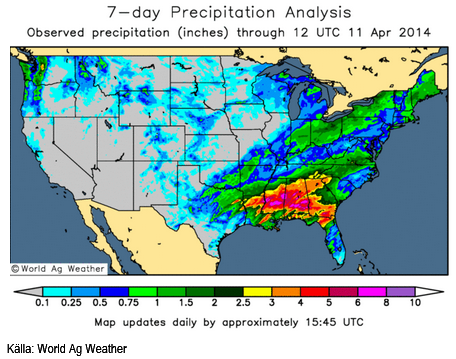
Indien har varit absolut torrt den senaste veckan, liksom i Kina söder om Peking. USA har fått regn, som dock missat de delstater som odlar vete, som vi ser på kartbilden nedan:
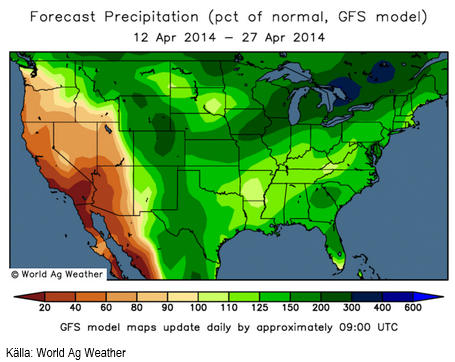
Nederbördsprognosen enligt GFS-modellen innehåller dock nederbörd över det normala även för Kansas, Oklahoma och Texas.
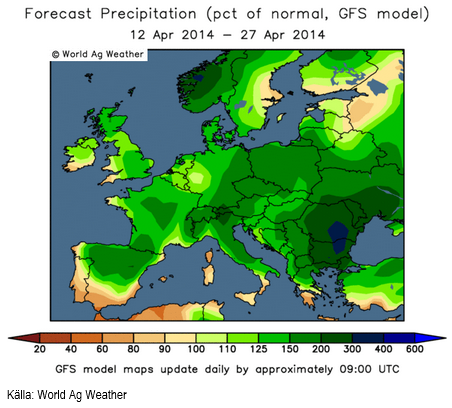
Europa har varit relativt torrt den senaste veckan, särskilt i sydvästra Tyskland och nordvästra Frankrike. Prognosen visar att Benelux-området fortsätter att få något mindre nederbörd än normalt.
Vete
Den senaste veckan har terminerna i Chicago gått ner, medan de har gått upp i Paris.
Egypten köpte vete från Ukraina i den senaste tendern. Det var länge sedan sist och det tyder på att Egypten känner sig trygga med att ta den risken. Ryssland har fattat ett beslut om att betrakta Krim-halvön som en del av Ryssland. Ryssland fortsätter att mobilisera mot Ukraina på samma sätt som man gjorde när man ockuperade Krim.
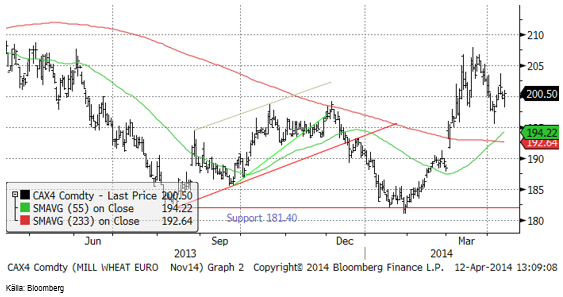
Tekniskt är novemberkontraktet på Matif i neutralt läge, varifrån priset lika gärna kan gå upp som ner.
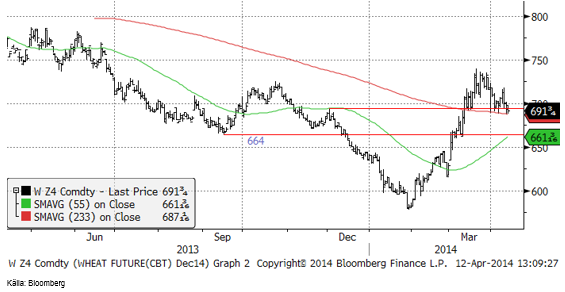
Chicagovetet (december) stängde ett par cent lägre än för en vecka sedan.
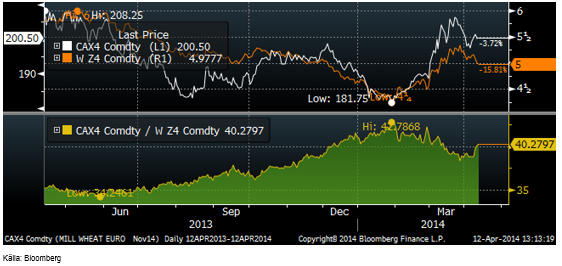
Som jag nämnde inledningsvis, har Matifs novemberkontrakt återhämtat sig i förhållande till Chicagovetet. Kvoten mellan priset på Matifs novemberkontrakt och Chicagos decemberkontrakt omräknat till euro per bushel steg under förra året från en kvot på 35 till 42.8 i januari i år. Sedan föll kvoten till 38 och de senaste dagarna har den alltså hämtat sig till 40.3. Ett ton Chicagovete med leverans i december kostar 183 euro medan det kostar 200 euro på Matif. Den senaste veckans uppgång gör det mer förmånligt att sälja Matifterminer, allt annat lika.
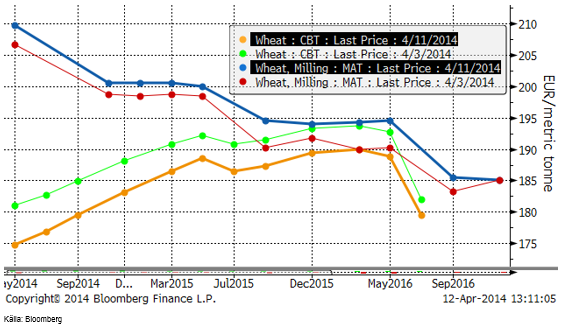
Nedan ser vi terminskurvorna för Chicagovete och Matif i fredags och veckan innan. Notera att jämfört med den 3 april, ligger Matif nu högre och Chicago lägre!
I tisdags kom årets första Crop Condition för vete och den visade, som väntat, att vetet är i dåligt skick i USA med endast 35 % i ”good” eller ”excellent” skick. I diagrammet nedan ser vi hur förra veckans siffra på 35% (märkt med en liten cirkel) förhåller sig till tidigare år. Om man vill vara optimistisk, kan man dock notera att årets första crop condition bara är lite lägre än var det började både förra året 2013 och år 2011. Förra året blev avkastningen rekordhög, så det kan faktiskt bli ett bra år än.
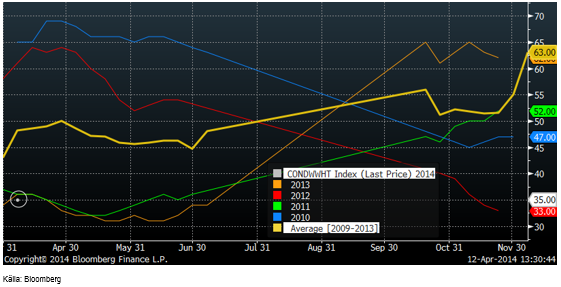
Nästa crop condition-rapport kommer på måndag kväll klockan 22:00 CET.
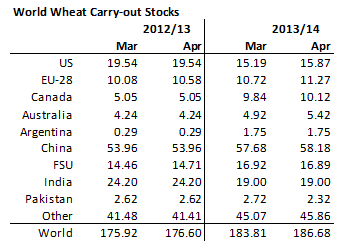
Det kom också en WASDE-rapport i veckan från det amerikanska jordbruksdepartementet. För vete gjordes inga betydande justeringar av produktionsestimaten för 2013/14.
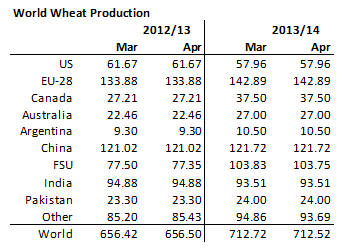
Konsumtionen justerades dock ner, vilket medrörde att utgående lager justerades upp med 3 mt på global basis.
Priset har backat den senaste veckan på regn i USA, så vi väljer att gå över till neutral vy, men fundamenta ser övervägande negativt ut och det skulle inte förvåna om priset på vete går ner lite till.
Maltkorn
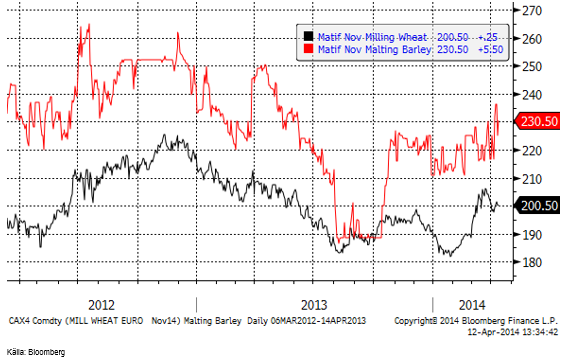
Maltkornsterminerna steg med 10 euro till 230.50 – och ligger nu alltså 30 euro över Matifs veteterminer.
Majs
Decemberkontraktet på majs steg i veckan till en ny årshögsta på 517 cent, men föll sedan tillbaka och stängde under 500, ungefär 2 cent lägre än förra veckan. Tekniskt stöd finns på 494 cent, som kan vara en bra nivå att köpa vid.
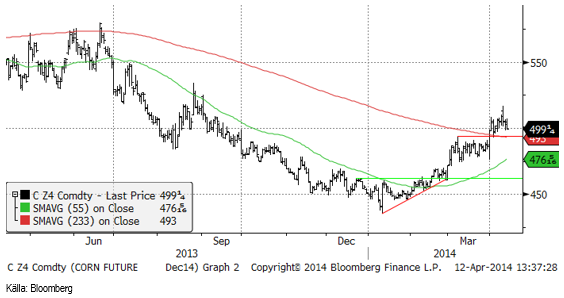
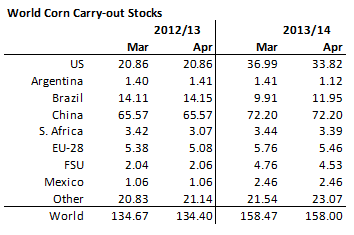
I WASDE-rapporten justerade USDA upp produktionen i Brasilien med 2 mt, och Sydafrika och FSU med vardera 1 mt. Produktionen i ”övriga länder” höjdes också med 2 mt. Totalt sett höjde USDA produktionen 2013/14 med nästan 6.5 mt.
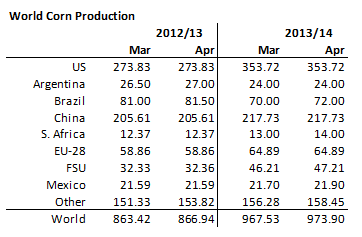
Dessa produktionsökningar slog dock nästan inte alls igenom i högre utgående lager. De är troligtvis ett sätt för USDA att få ihop den högre konsumtionen och exporten med vad som rapporteras finnas i lager. Som du kunde läsa förra veckan, är t ex USA:s export av majs redan uppe i 100% av vad den skulle vara för hela säsongen 2013/14. Givet de lager som finns, måste alltså produktionen ha varit högre i USA än vad USDA har räknat med tidigare. Det är en slags baklängeskalkyl. Det blev dock en höjning av utgående lager med 0.5 mt och det får väl tolkas som negativt för priset. Tillsammans med uppjusteringen av utgående lager för vete är detta alltså negativt för spannmål rent generellt.
På måndag klockan 22:00 CET publicerar USDA årets första planting progress-data.
Vi går över till neutral rekommendation för majs.
Sojabönor
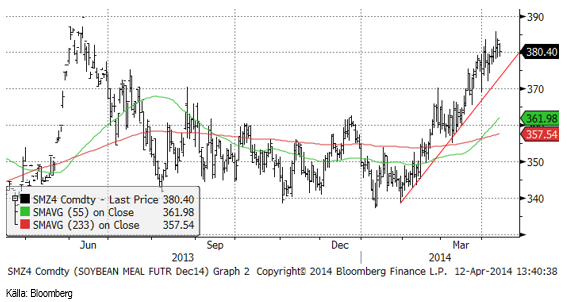
Novemberkontraktet på sojabönor i Chicago gick i veckan upp och nuddade vid motståndet på 1236 cent. Nu väntar sannolikt en rekyl nedåt. Tekniskt stöd finns vid 1200 cent.
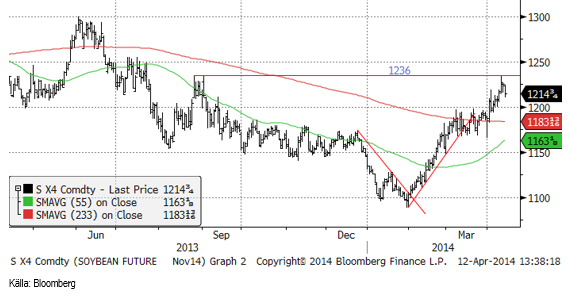
Sojamjölet fortsatte upp ett par dollar i veckan, men ”borde” ur ett tekniskt perspektiv ha stigit färdigt.
Sojaoljan steg initialt, men backade sedan tillbaka.
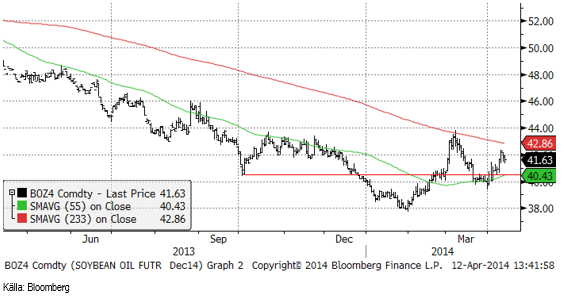
Palmoljeterminerna i Malaysia har fallit ner till ett område med tekniskt stöd. I veckan som gick sjönk priset från 2705 MYR / ton till 2660. De senaste dagarna har en liten rekyl uppåt noterats.
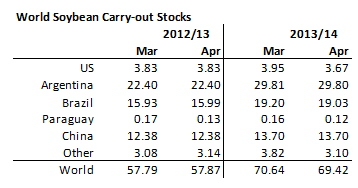
I WASDE-rapporten sänkte USDA global produktion med nästan 1.5 mt. Brasilien justerades ner med 1 mt. CONAB, som publicerade sin skörderapport i veckan, angav skörden till 86.1 mt. Det var faktiskt en höjning från 85.5 mt, som de varnat för tidigare. Skörden i Brasilien är klar till 85%.
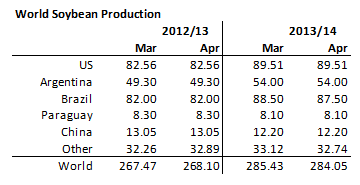
Sänkningen av global produktion slår i fallet med sojabönor direkt igenom till 1 mt lägre utgående lager.
Tekniskt ser det ut som om styrkan i sojamarknaden kommer att mattas men vi behåller neutral som rekommendation för soja.
Raps
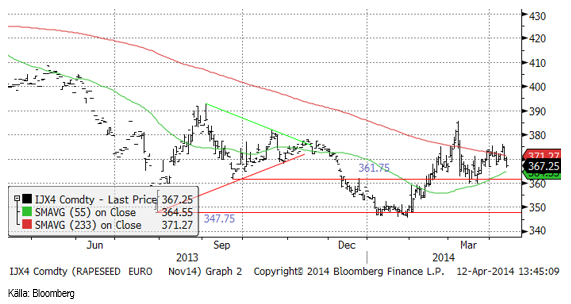
Rapspriset hämtade sig under veckan, men vände sedan tillbaka ner. Den huvudsakligan nedgången i veckan noterades i fredags. För veckan noterades en nedgång i priset med 50 eurocent till 367.25.
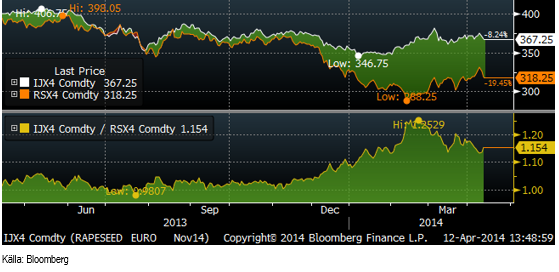
Skillnaden mellan kanadensisk canola i eurotermer och Matifs rapskontrakt (båda för novemberleverans) som i fredags för en vecka sedan var 14.9%, har nu ökat till 15.4%, främst pga att canolan i Winnipeg har fallit mer än Matifkontraktet. Matif är ca 12% för dyr i förhållande till ICE Canada.
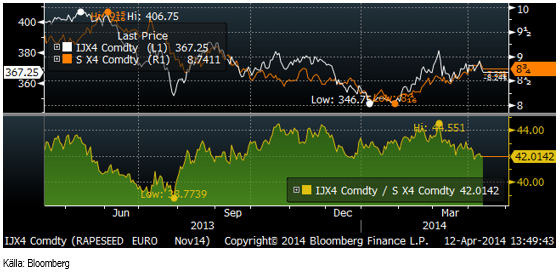
Nedanför ser vi kvoten mellan rapsfrö (november) och sojabönor (november, omräknat till euro). Enligt den jämförelsen är det sojabönorna som är dyra och rapsen som är billig.
Vi fortsätter med säljrekommendation på raps.
Potatis
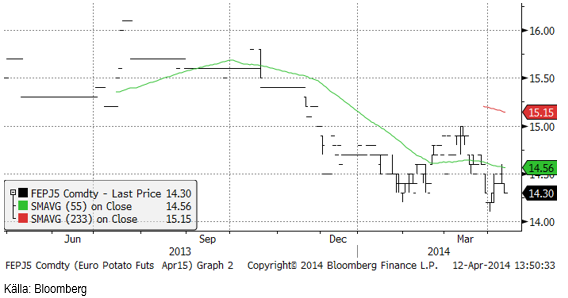
Potatis för leverans i april nästa år sjönk till 14.30 euro per 100 Kg från 14.50 förra veckan.
Gris
Det snabba prisfall jag förutspådde förra veckan i Lean Hogs, slog verkligen in. Priset föll i mitten av veckan till 115 cent, men där fanns uppenbarligen köpare som lyfte priset till 120 cent, där priset höll sig till slutet av veckan. Konsumenterna i USA är enligt fredagens ”consumer conficende” statistik oväntat positiva inför framtiden, vilket kan återspegla sig i konsumtionen av kött framöver. Fredagens Hog Slaughter-statistik kom in på 370,000. Förra veckan var det 407,000. Även detta är sådant som ger stöd för priset.
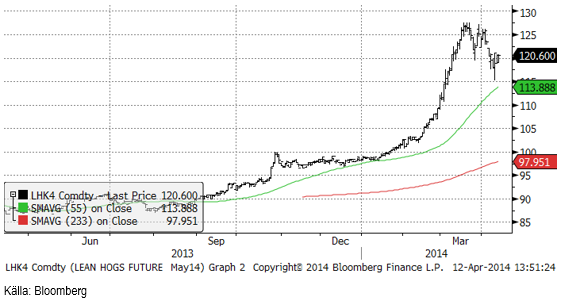
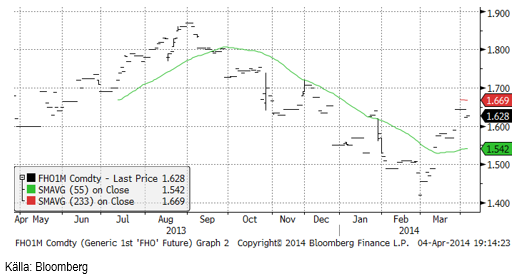
Spotkontraktet på EUREX Hogs stängde veckan på oförändrad nivå, 1.57 euro per Kg.
Mjölk
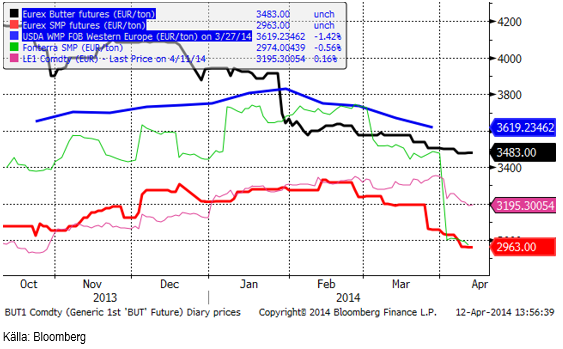
Smörterminerna på Eurex har fortsatt sjunka i veckan och även SMP-terminerna sjönk något lite. Den möjlighet till rekyl, som jag spekulerade om förra veckan uteblev alltså. Trenden mot lägre priser ser ut att fortsätta. Vi lämnar därför förra veckans rekommendation att avvakta med försäljning, till att återgå till säljrekommendation vad gäller terminspriserna.
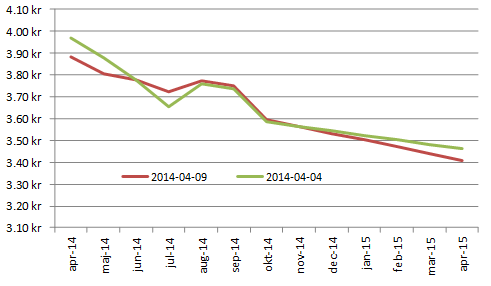
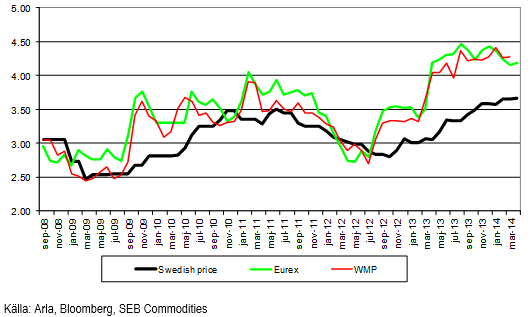
Nedan ser vi terminspriserna man får i svenska kronor från terminspriserna på SMP och smör på Eurex, omräknat till kronor per kilo mjölkråvara. Notera att hela den här prisnivån alltid ska ligga över avräkningspriset på mjölkråvara med ca 50 öre, som är en uppskattning av kostnaden för att förädla mjölkråvara till SMP och smör. Fram till och med oktober finns nu regelmässigt priser på Eurex. Nu fanns det även en köpkurs i januari-kontraktet på smör, som stämde väl överens med vår uppfattning om var priset ska ligga.
Som vi kan se är det framförallt på terminskontrakten april och maj som ligger lite lägre jämfört med förra veckan. Juli och augusti ligger något högre och därefter är det ungefär oförändrat.
ARLA:s avräkningspris för april är i princip oförändrat från månaderna innan (en höjning med 0.1 öre per Kg på Aktuellt Pris och en sänkning med 0.4 öre på Arlanoteringen). Nedan ser vi priser i SEK / Kg för värdet på råmjölk. Dels är det ARLA:s Aktuellt Pris, dels ett pris baserat på USDA:s helmjölkspulvernotering och slutligen EUREX baserat på spotprisindexen för SMP och smör.
Socker
CONAB höjde årets skörd 2014/15 med 4.2% till 39.5 mt. Skörden av sockerrör, själva råvaran väntas öka med 2% till rekordhöga 671.7 mt. Det här är CONABS första estimat på den kommande skörden och den publicerades i torsdags. Detta sjönk uppenbarligen inte in hos marknadens aktörer förrän dagen efter. Möjligen kan det bero på att CONAB:s rapporter enbart publiceras på portugisiska. I fredags föll priset ganska kraftigt och stängde på 17.46 cent. Priset kan nog fortsätta att falla, eftersom hela ”caset” med lägre produktion pga torkan i Brasilien inte existerar längre för socker. Enligt oss har torkan i Brasilien aldrig varit ett ”case” för socker, eftersom Sao Paulo-delstaten visserligen varit åt det torrare hållet, men inte såsom Minas Gerais för kaffe.
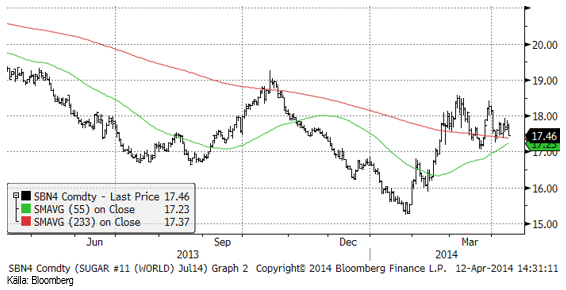
Vi går över från neutral på socker till sälj och rekommenderar köp av BEAR SOCKER X4 S.
Gödsel
Urea-priset, FOB Yuzny ligger kvar på samma nivå som förra veckan.
[box]SEB Veckobrev Jordbruksprodukter är producerat av SEB Commodities Sales desk och publiceras i samarbete och med tillstånd på Råvarumarknaden.se[/box]
Detta marknadsföringsmaterial, framtaget av SEB’s Commodities Sales desk, har upprättats enbart i informationssyfte.
Även om innehållet är baserat på källor som SEB bedömt som tillförlitliga ansvarar SEB inte för fel eller brister i informationen. Den utgör inte oberoende, objektiv investeringsanalys och skyddas därför inte av de bestämmelser som SEB har infört för att förebygga potentiella intressekonflikter. Yttranden från SEB’s Commodities Sales desk kan vara oförenliga med tidigare publicerat material från SEB, då den senare hänvisas uppmanas du att läsa den fullständiga rapporten innan någon åtgärd vidtas.
Dokumentationen utgör inte någon investeringsrådgivning och tillhandahålls till dig utan hänsyn till dina investeringsmål. Du uppmanas att självständigt bedöma och komplettera uppgifterna i denna dokumentation och att basera dina investeringsbeslut på material som bedöms erforderligt. Alla framåtblickande uttalanden, åsikter och förväntningar är föremål för risker, osäkerheter och andra faktorer och kan orsaka att det faktiska resultatet avviker väsentligt från det förväntade. Historisk avkastning är ingen garanti för framtida resultat. Detta dokument utgör inte ett erbjudande att teckna några värdepapper eller andra finansiella instrument. SEB svarar inte för förlust eller skada – direkt eller indirekt, eller av vad slag det vara må – som kan uppkomma till följd av användandet av detta material eller dess innehåll.
Observera att det kan förekomma att SEB, dess ledamöter, dess anställda eller dess moder- och/eller dotterbolag vid olika tillfällen innehar, har innehaft eller kommer att inneha aktier, positioner, rådgivningsuppdrag i samband med corporate finance-transaktioner, investment- eller merchantbankinguppdrag och/eller lån i de bolag/finansiella instrument som nämns i materialet.
Materialet är avsett för mottagaren, all spridning, distribuering mångfaldigande eller annan användning av detta meddelande får inte ske utan SEB:s medgivande. Oaktat detta får SEB tillåta omfördelning av materialet till utvald tredje part i enlighet med gällande avtal. Materialet får inte spridas till fysiska eller juridiska personer som är medborgare eller har hemvist i ett land där sådan spridning är otillåten enligt tillämplig lag eller annan bestämmelse.
Skandinaviska Enskilda Banken AB (publ) är ett [publikt] aktiebolag och står under tillsyn av Finansinspektionen samt de lokala finansiella tillsynsmyndigheter i varje jurisdiktionen där SEB har filial eller dotterbolag.

Hesitant today. Brent jumped to an intraday high of $66.36/b yesterday after having touched an intraday low of $60.07/b on Monday as Indian and Chinese buyers cancelled some Russian oil purchases and instead redirected their purchases towards the Middle East due to the news US sanctions. Brent is falling back 0.4% this morning to $65.8/b.

It’s our strong view that the only sensible thing is to sell this rally. In all Trump’s unpredictability he has become increasingly predictable. Again and again he has rumbled about how he is going to be tough on Putin. Punish Putin if he won’t agree to peace in Ukraine. Recent rumbling was about the Tomahawk rockets which Trump threatened on 10 October and 12 October to sell/send to Ukraine. Then on 17 October he said that ”the U.S. didn’t want to give away weapons (Tomahawks) it needs”.
All of Trump’s threats towards Putin have been hot air. So far Trump’s threats have been all hot air and threats which later have evaporated after ”great talks with Putin”. After all these repetitions it is very hard to believe that this time will be any different. The new sanctions won’t take effect before 21. November. Trump has already said that: ”he was hoping that these new sanctions would be very short-lived in any case”. Come 21. November these new sanctions will either evaporate like all the other threats Trump has thrown at Putin before fading them. Or the sanctions will be postponed by another 4 weeks or 8 weeks with the appearance that Trump is even more angry with Putin. But so far Trump has done nothing that hurt Putin/Russia. We can’t imagine that this will be different. The only way forward in our view for a propre lasting peace in Ukraine is to turn Ukraine into defensive porcupine equipped with a stinging tail if need be.
China will likely stand up to Trump if new sanctions really materialize on 21 Nov. Just one country has really stood up to Trump in his tariff trade war this year: China. China has come of age and strength. I will no longer be bullied. Trump upped tariffs. China responded in kind. Trump cut China off from high-end computer chips. China put on the breaks on rare earth metals. China won’t be bullied any more and it has the power to stand up. Some Chinese state-owned companies like Sinopec have cancelled some of their Russian purchases. But China’s Foreign Ministry spokesperson Guo Jiakun has stated that China “oppose unilateral sanctions which lack a basis in international law and authorization of the UN Security Council”. Thus no one, not even the US shall unilaterally dictate China from whom they can buy oil or not. This is yet another opportunity for China to show its new strength and stand up to Trump in a show of force. Exactly how China choses to play this remains to be seen. But China won’t be bullied by over something as important as its oil purchases. So best guess here is that China will defy Trump on this. But probably China won’t need to make a bid deal over this. Firstly because these new sanctions will either evaporate as all the other threats or be postponed once we get to 21 November. Secondly because the sanctions are explicit towards US persons and companies but only ”may” be enforced versus non-US entities.
Sanctions is not a reduction in global supply of oil. Just some added layer of friction. Anyhow, the new sanctions won’t reduce the supply of Russian crude oil to the market. It will only increase the friction in the market with yet more need for the shadow fleet and ship to ship transfer of Russian oil to dodge the sanctions. If they materialize at all.
The jump in crude oil prices is probably due to redirections of crude purchases to the Mid-East and not because all speculators are now turned bullish. Has oil rallied because all speculators now suddenly have turned bullish? We don’t think so. Brent crude has probably jumped because some Indian and Chinese oil purchasers of have redirected their purchases from Russia towards the Mid-East just in case the sanctions really materializes on 21 November.
Parts of the Brent crude curve dipping into the high $50ies/b. Brent crude fell 2.3% over the week to Friday. It closed the week at $61.29/b, a slight gain on the day, but also traded to a low of $60.14/b that same day and just barely avoided trading into the $50ies/b. This morning it is risk-on in equities which seems to help industrial metals a little higher. But no such luck for oil. It is down 0.8% at $60.8/b. This week looks set for Brent crude to dip its feet in the $50ies/b. The Brent 3mth contract actually traded into the high $50ies/b on Friday.
The front-end backwardation has been on a weakening foot and is now about to fully disappear. The lowest point of the crude oil curve has also moved steadily lower and lower and its discount to the 5yr contract is now $6.8/b. A solid contango. The Brent 3mth contract did actually dip into the $50ies/b intraday on Friday when it traded to a low point of $59.93/b.
More weakness to come as lots of oil at sea comes to ports. Mid-East OPEC countries have boosted exports along with lower post summer consumption and higher production. The result is highly visibly in oil at sea which increased by 17 mb to 1,311 mb over the week to Sunday. Up 185 mb since mid-August. On its way to discharge at a port somewhere over the coming month or two.
Don’t forget that the oil market path ahead is all down to OPEC+. Remember that what is playing out in the oil market now is all by design by OPEC+. The group has decided that the unwind of the voluntary cuts is what it wants to do. In a combination of meeting demand from consumers as well as taking back market share. But we need to remember that how this plays out going forward is all at the mercy of what OPEC+ decides to do. It will halt the unwinding at some point. It will revert to cuts instead of unwind at some point.
A few months with Brent at $55/b and 40-50 US shale oil rigs kicked out may be what is needed. We think OPEC+ needs to see the exit of another 40-50 drilling rigs in the US shale oil patches to set US shale oil production on a path to of a 1 mb/d year on year decline Dec-25 to Dec-26. We are not there yet. But a 2-3 months period with Brent crude averaging $55/b would probably do it.
Oil on water increased 17 mb over the week to Sunday while oil in transit increased by 23 mb. So less oil was standing still. More was moving.

Crude oil floating storage (stationary more than 7 days). Down 11 mb over week to Sunday

The lowest point of the Brent crude oil curve versus the 5yr contract. Weakest so far this year.

Crude oil 1mth to 3mth time-spreads. Dubai held out strongly through summer, but then that center of strength fell apart in late September and has been leading weakness in crude curves lower since then.

Rebounding along with most markets. But concerns over solidity of Gaza peace may also contribute. Brent crude fell 0.8% yesterday to $61.91/b and its lowest close since May this year. This morning it is bouncing up 0.9% to $62.5/b along with a softer USD amid positive sentiment with both equities and industrial metals moving higher. Concerns that the peace in Gaza may be less solid than what one might hope for also yields some support to Brent. Bets on tech stocks are rebounding, defying fears of trade war. Money moving back into markets. Gold continues upwards its strong trend and a softer dollar helps it higher today as well.
US crude & products probably rose 5.6 mb last week (API) versus a normal seasonal decline of 2.4 mb. The US API last night partial and thus indicative data for US oil inventories. Their data indicates that US crude stocks rose 7.4 mb last week, gasoline stocks rose 3.0 mb while Distillate stocks fell 4.8 mb. Altogether an increase in commercial crude and product stocks of 5.6 mb. Commercial US crude and product stocks normally decline by 2.4 mb this time of year. So seasonally adjusted the US inventories rose 8 mb last week according to the indicative numbers by the API. That is a lot. Also, the counter seasonal trend of rising stocks versus normally declining stocks this time of year looks on a solid pace of continuation. If the API is correct then total US crude and product stocks would stand 41 mb higher than one year ago and 6 mb higher than the 2015-19 average. And if we combine this with our knowledge of a sharp increase in production and exports by OPEC(+) and a large increase in oil at sea, then the current trend in US oil inventories looks set to continue. So higher stocks and lower crude oil prices until OPEC(+) switch to cuts. Actual US oil inventory data today at 18:00 CET.
US commercial crude and product stocks rising to 1293 mb in week 41 if last nights indicative numbers from API are correct.

Crude oil soon coming to a port near you. OPEC has lifted production sharply higher this autumn. At the same time demand for oil in the Middle-East has fallen as we have moved out of summer heat and crude oil burn for power for air-conditioning. The Middle-East oil producers have thus been able to lift exports higher on both accounts. Crude oil and condensates on water has shot up by 177 mb since mid-August. This oil is now on its way to ports around the world. And when they arrive, it will likely help to lift stocks onshore higher. That is probably when we will lose the last bit of front-end backwardation the the crude oil curves. That will help to drive the front-month Brent crude oil price down to the $60/b line and revisit the high $50ies/b. Then the eyes will be all back on OPEC+ when they meet in early November and then again in early December.
Crude oil and condensates at sea have moved straight up by 177 mb since mid-August as OPEC(+) has produced more, consumed less and exported more.


Sell the rally. Trump has become predictable in his unpredictability

Gruvbolaget Boliden överträffade analytikernas förväntningar

Australien och USA investerar 8,5 miljarder USD för försörjningskedja av kritiska mineraler
Brent crude set to dip its feet into the high $50ies/b this week

Vad guldets uppgång egentligen betyder för världen

Goldman Sachs höjer prognosen för guld, tror priset når 4900 USD

Blykalla och amerikanska Oklo inleder ett samarbete

Guld nära 4000 USD och silver 50 USD, därför kan de fortsätta stiga

Leading Edge Materials är på rätt plats i rätt tid

Nytt prisrekord, guld stiger över 4000 USD
-
 Nyheter3 veckor sedan
Goldman Sachs höjer prognosen för guld, tror priset når 4900 USD
-
 Nyheter4 veckor sedan
Blykalla och amerikanska Oklo inleder ett samarbete
-
 Nyheter3 veckor sedan
Guld nära 4000 USD och silver 50 USD, därför kan de fortsätta stiga
-
 Nyheter2 veckor sedan
Leading Edge Materials är på rätt plats i rätt tid
-
 Nyheter3 veckor sedan
Nytt prisrekord, guld stiger över 4000 USD
-

 Nyheter4 veckor sedan
Ett samtal om guld, olja, koppar och stål
-
Analys4 veckor sedan
OPEC+ will likely unwind 500 kb/d of voluntary quotas in October. But a full unwind of 1.5 mb/d in one go could be in the cards
-

 Nyheter4 veckor sedan
Neptune Energy bekräftar enorma litiumfyndigheter i Tyskland