

Analys
SEB Jordbruksprodukter, 13 maj 2013


 45 mt högre veteskörd globalt och 6 mt högre lager är USDA:s första prognos för säsongen 2013/14, som kom i fredags klockan 18:00 svensk tid. WASDE-rapporten indikerar att rätt pris för vete, sojabönor och majs är väsentligt lägre än dagens höga priser. Lantbrukare som inte prissäkrat sin skörd av spannmål eller raps borde göra det, åtminstone till en betydande del.
Vete
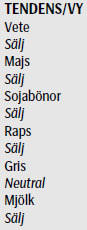
Priset på vete stängde ner på Matif på den halvtimmes handel som var möjlig efter att WASDE-rapporten publicerats i fredags. Det tekniska stödet vid 210 euro lär kunna brytas när handeln drar igång på den nya veckan.
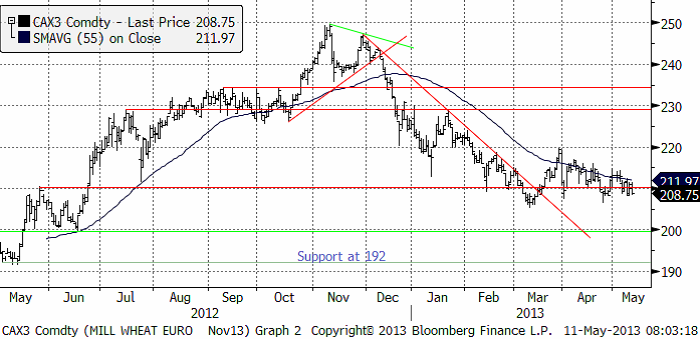
Decemberkontraktet på CBOT steg inför rapporten upp mot motståndet på 758 cent, men föll sedan tillbaka på fredagen efter USDA:s rapport.
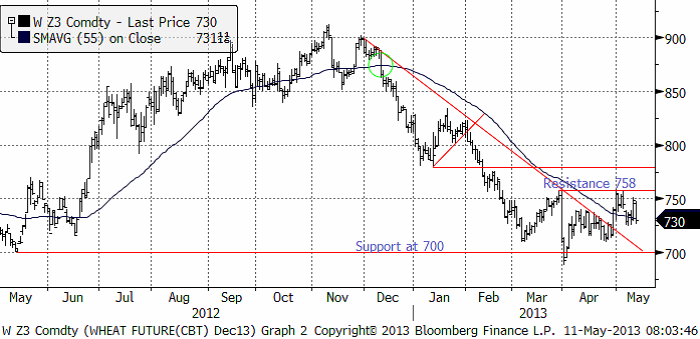
Ser vi på den senaste veckan förändring av terminskurvorna, ser vi att terminspriserna framåt i tiden gått ner ungefär lika mycket oavsett löptid i Europa. I USA, däremot har bara de kortaste terminskurvorna sjunkit. Från och med mars-leverans nästa år ligger priset högre i USA än i Europa. Som vanligt får man alltså bättre betalt om man säljer nästa års skörd via Chicago-terminerna än om man säljer Matif-terminerna.
Nedan ser vi USDA:s estimat för global produktion enligt den senaste rapporten som publicerades i fredags klockan 18 CET.
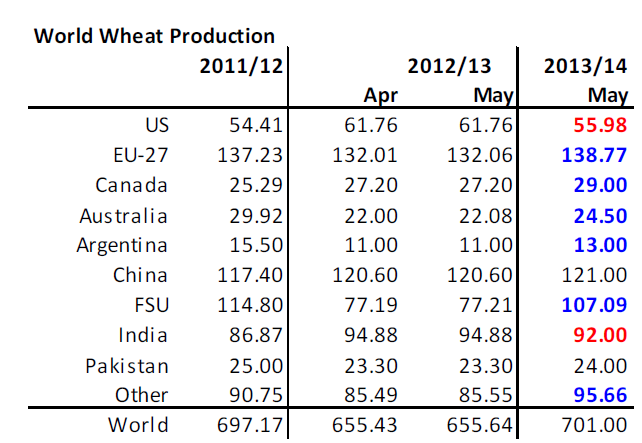
USDA gjorde inga förändringar för 2012/13, men det var första gången de gav ett estimat för 2013/14. Den visar 45 mt högre produktion än förra året och något högre än för två år sedan. Det är lite lägre skörd väntad i USA än förra året, ganska mycket högre i EU (över lokala estimat här). Fd Sovjuetunionen väntas stå för den stora ökningen, med +30 mt. Indien väntas ge lägre skörd än förra året, men mer än för två år sedan.
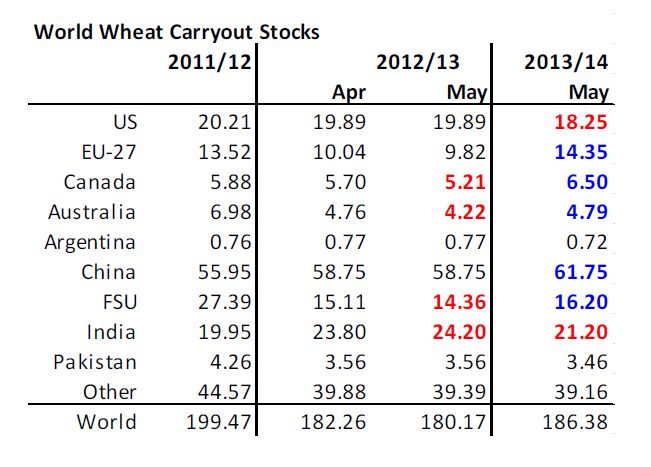
Med den här ökningen av produktionen är det inte konstigt att utgående lager ökar. Men med 45 mt högre produktion, är ökningen av lagren med 6 mt ganska låg. USDA räknar med att foderefterfrågan ökar med 7 mt. För att få en så mycket högre konsumtion av vete i världen totalt sett som USDA räknar med måste priset vara riktigt lågt. Jag tror att de har estimerat utgående lager för lågt, eller varit för optimistiska om den stora ökningen av skörden i fd Sovjetunionen och kanske i USA. Men hur som helst är detta en rapport som indikerar väsentligt lägre pris på vete framöver.
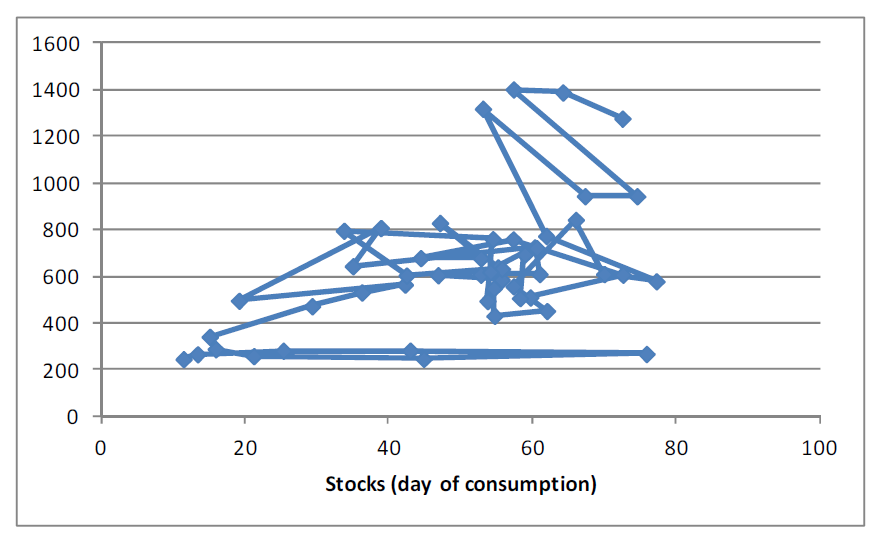
Nedan ser vi priset på decemberkontraktet på CBOT i cent, i förhållande till estimat för utgående lager.
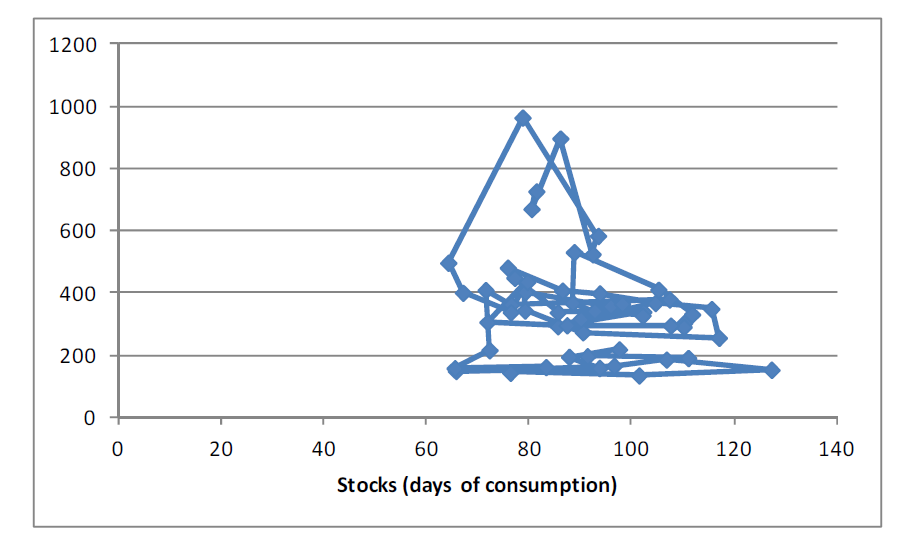
Slutsatsen är att vi behåller vår säljrekommendation på vete.
Maltkorn
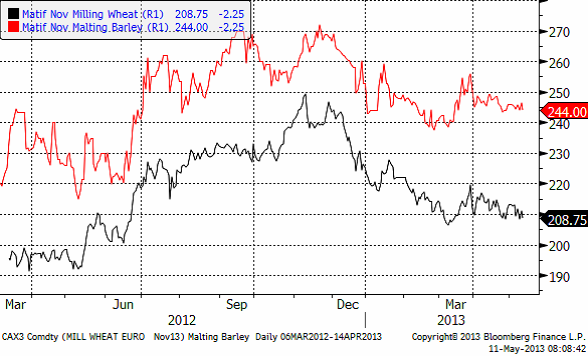
Priset på maltkorn med leverans i november har ännu en vecka fortsatt att visa mer styrka än höstvetet / kvarnvetet på Matif.
Majs
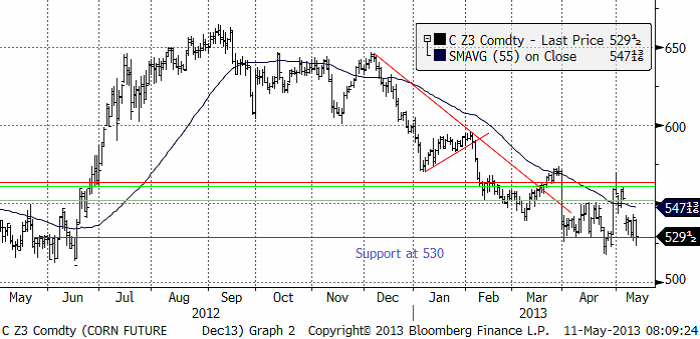
Majspriset (december 2013) som testade en trendvändning uppåt för en vecka sedan föll tillbaka när det i måndags kväll stod klart att sådden trots allt tagit ett större kliv framåt än befarat. När WASDE-rapporten så kom i fredags föll priset ytterligare. Det finns ett starkt tekniskt stöd vid 530 cent och vid den här nivån har vi också bottennoteringarna från förra året, innan torkan och prisuppgången i juli. Det är psykologiskt viktig nivå. Men icke desto mindre – om WASDE-rapporten blir verklighet borde priset ligga på en ännu lägre nivå. Kanske till och med på 400 cent per bushel.
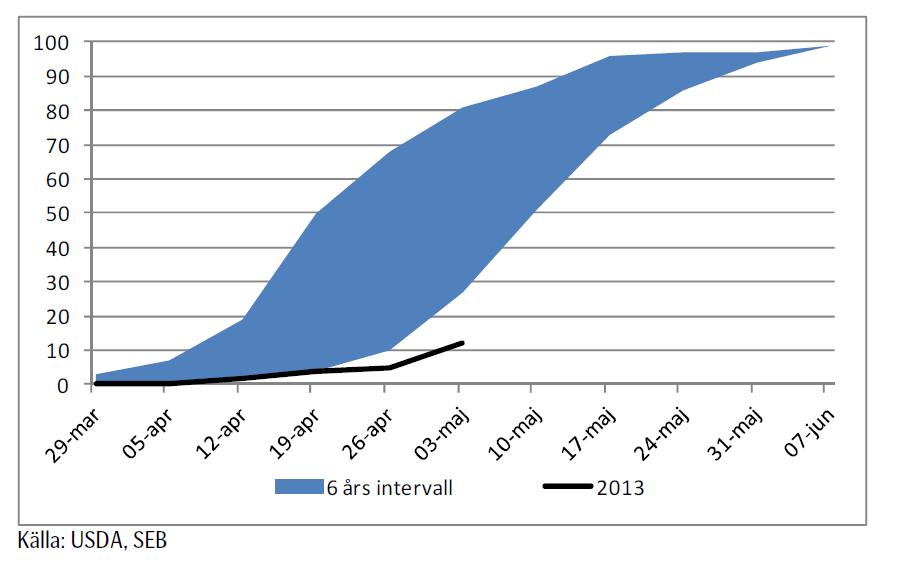
Sådden ligger kraftigt efter i USA. Nedan ser vi såddens framåtskridande i USA. 6-årsintervallet sträcker sig från 2007 till 2012. Förra helgen var 12% sått.
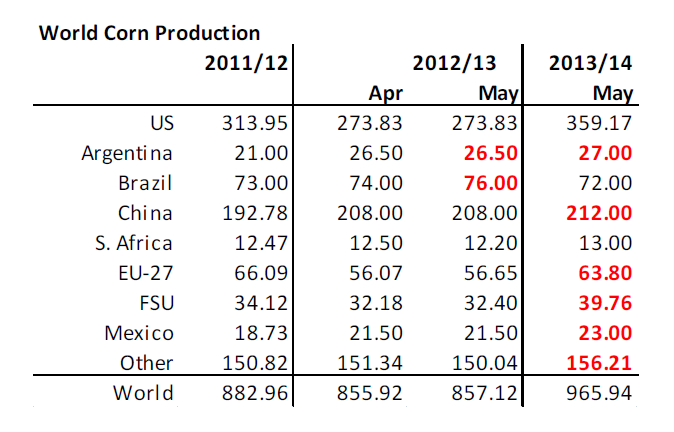
Nedan ser vi USDA:s estimat, som publicerades i fredags för majsproduktionen. För 2012/13 noterar vi de inte justerade ner Argentinas skörd, men höjde Brasiliens skörd med 2 mt. Det är också första gången som USDA rapporterar något för 2013/14. Som vi ser är det en rejäl höjning av global produktion, från 857 mt 2012/13 till 965 mt med start i höst. Vi ser att USDA väntar sig en rekordskörd i USA, 80 mt högre än förra året och större skördar både i EU och i fd Sovjetunionen.
Nedan ser vi USDA:s estimat för utgående lager.
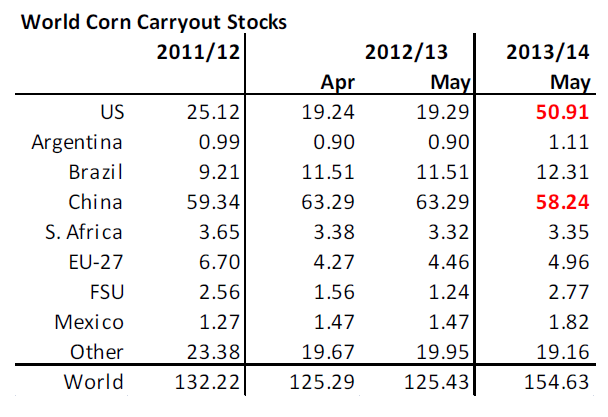
Som vi ser är det väsentligt högre lager den sista augusti nästa år i USA, som USDA förväntar sig. Trots detta väntar sig USDA att foderefterfrågan på global basis stiger med 44 mt. Lägg därtill 7 mt ökad foderkonsumtion av vete. Det är knappast rimligt att vänta sig detta, om inte priset är väsentligt mycket lägre och gör att köttefterfrågan ökar radikalt. De hot som finns är att vädret i USA drar ner skörden i USA från vad USDA väntar sig nu. Det skulle få priset att bli högre. Å andra sidan är det inte sannolikt att foderefterfrågan blir så stor som USDA nu räknar med och då ökar utgående lager, med lägre pris som följd. Utgående lager förutspås bli så stora att det är svårt att se att priset ska kunna gå upp nu. Nedanför ser vi priset i cent per bushel på decemberkontraktet på CBOT i förhållande till utgående lager.
Som vi ser kan priset mycket väl gå ner till 400 cent utan att vara ur led med tidigare års förhållande mellan lager och pris. Slutsatsen är att vi behåller vår säljrekommendation på majs.
Sojabönor
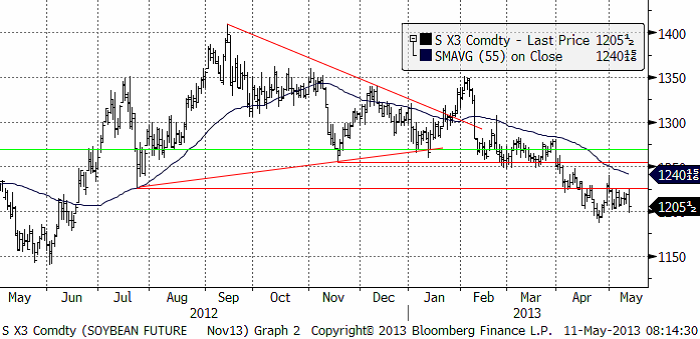
Jag har vecka efter vecka hävdat att sojabönorna (november 2013) befinner sig i en stabil negativ trend. Efter WASDE-rapporten i fredags bröts ett litet tekniskt stöd, vilket kortsiktigt kan leda till att marknaden tar ett trappsteg ner i prisnivå igen i veckan som kommer. WASDE-rapporten i fredags indikerar, om den slår in, ett pris som är ca 200 cent / bushel lägre än idag.
Nedanför ser vi USDA:s estimat för sojaproduktionen i världen.
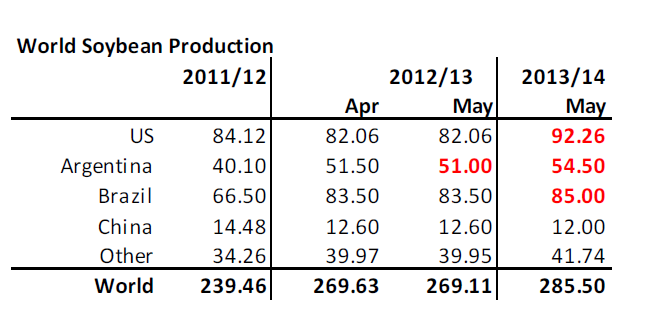
USDA sänkte Argentinas skörd 2012/13 med 0.5 mt. För första gången gav USDA också estimat för 2013/14. Vi ser att USDA väntar sig högre produktion i alla regioner / länder utom i Kina. Global produktion tar ett kliv upp med drygt 15 mt till 285.5 mt.
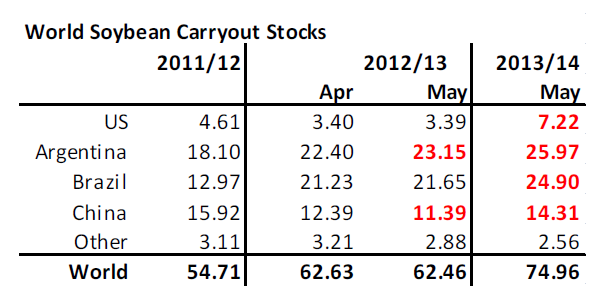
Den här ökningen av produktionen leder till en ökning av utgående lager 2013/14 med nästan 13 mt. USDA väntar sig också att Kinas import ökar till 69 mt. Jag tror det är en lite för stor ökning, med tanke på de animali-mat-problem som landet har. Man misstror inhemskt kött, inhemsk mjölk och kyckling konsumeras i vissa områden inte alls pga den pågående fågelinfluensan.
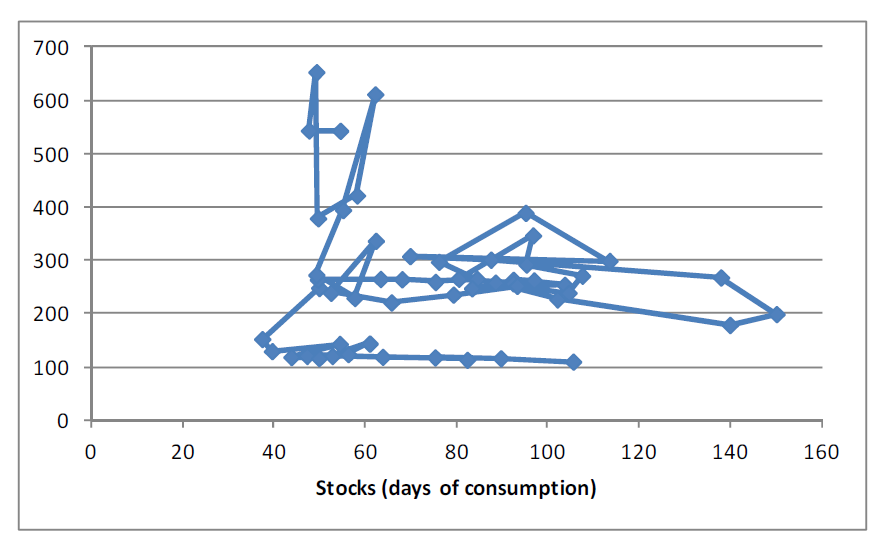
Än så länge kan mycket hända med produktionen, eftersom så stor del odlas i Brasilien, där det sås först i höst. Till dess kan vädret ha slagit om till negativt (eller ännu mer positivt). Men allt annat lika just nu, ser det ut som om den ”bear market” som har börjat, kommer att fortsätta. Nedanför ser vi priset i cent per bushel på decemberkontraktet på CBOT i förhållande till utgående lager.
Som vi ser är lite drygt 1000 cent per bushel ett rimligt pris vid den här lagernivån. Slutsatsen är att vi behåller och upprepar vår säljrekommendation på sojabönor.
Raps
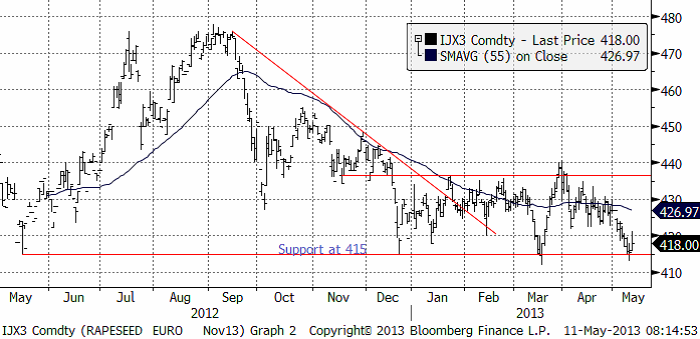
Rapspriset föll på Matif i veckan, men studsade på det tekniska stödet på 415 euro per ton. Med tanke på WASDE-rapportens ordentligt negativa siffror, tror jag ett nytt test av stödet kommer i veckan.
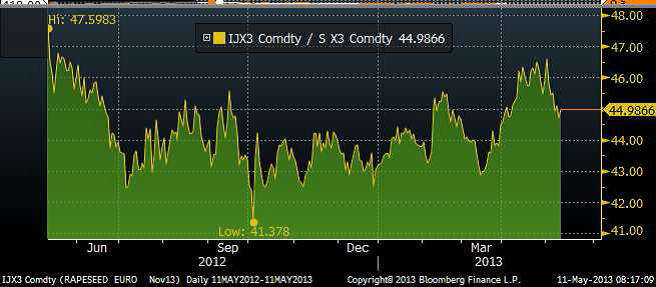
Nedanför ser vi kvoten mellan rapsterminspriset (nov) mot sojabönspriset (nov). Vi ser att raps fram till maj månads början handlades allt dyrare i förhållande till sojabönor, men att detta, som vi påpekat börjat normaliseras genom ett större prisfall på raps än på sojabönor. Ännu finns det extra fallhöjd i rapspriset, eftersom rapsen fortfarande är dyr i ett historiskt perspektiv, i förhållande till sojabönor.
Skulle det tekniska stödet på 415 euro brytas, är detta en rejäl säljsignal. Jag tror att rapspriset kommer att falla. Dels för att sojabönorna bör ha en lång tid av fallande priser framför sig och dels för att rapsen är ovanligt dyr i förhållande till sojabönor.
Mjölk
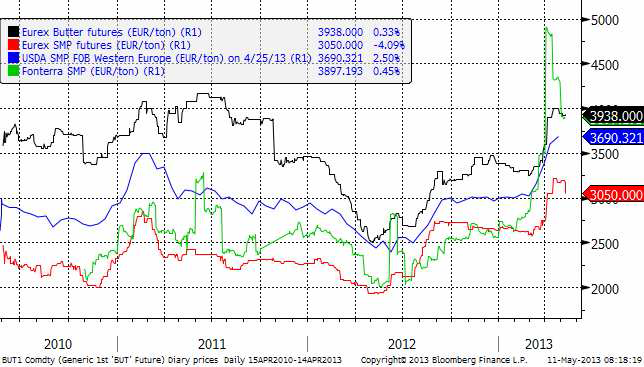
Fonterras notering har nu vänt ner ganska kraftigt och terminsmarknaden på SMP och mör på Eurex har också handlats lägre. Jag tror att vi sett slutet på prisuppgången. Priserna på Eurex ligger ännu kvar på en hög nivå. Den som är snabb kan hinna med att säkra produktion på attraktiva nivåer innan priserna hinner falla tillbaka igen.
[box]SEB Veckobrev Jordbruksprodukter är producerat av SEB Merchant Banking och publiceras i samarbete och med tillstånd på Råvarumarknaden.se[/box]
Disclaimer
The information in this document has been compiled by SEB Merchant Banking, a division within Skandinaviska Enskilda Banken AB (publ) (“SEB”).
Opinions contained in this report represent the bank’s present opinion only and are subject to change without notice. All information contained in this report has been compiled in good faith from sources believed to be reliable. However, no representation or warranty, expressed or implied, is made with respect to the completeness or accuracy of its contents and the information is not to be relied upon as authoritative. Anyone considering taking actions based upon the content of this document is urged to base his or her investment decisions upon such investigations as he or she deems necessary. This document is being provided as information only, and no specific actions are being solicited as a result of it; to the extent permitted by law, no liability whatsoever is accepted for any direct or consequential loss arising from use of this document or its contents.
About SEB
SEB is a public company incorporated in Stockholm, Sweden, with limited liability. It is a participant at major Nordic and other European Regulated Markets and Multilateral Trading Facilities (as well as some non-European equivalent markets) for trading in financial instruments, such as markets operated by NASDAQ OMX, NYSE Euronext, London Stock Exchange, Deutsche Börse, Swiss Exchanges, Turquoise and Chi-X. SEB is authorized and regulated by Finansinspektionen in Sweden; it is authorized and subject to limited regulation by the Financial Services Authority for the conduct of designated investment business in the UK, and is subject to the provisions of relevant regulators in all other jurisdictions where SEB conducts operations. SEB Merchant Banking. All rights reserved.

Brent crude has climbed roughly USD 1.5-2 per barrel since Friday, yet falling USD 0.3 per barrel this mornig and currently trading near USD 67.25/bbl after yesterday’s climb. While the rally reflects short-term geopolitical tension, price action has been choppy, and crude remains locked in a broader range – caught between supply-side pressure and spot resilience.

Prices have been supported by renewed Ukrainian drone strikes targeting Russian infrastructure. Over the weekend, falling debris triggered a fire at the 20mtpa Kirishi refinery, following last week’s attack on the key Primorsk terminal.
Argus estimates that these attacks have halted ish 300 kbl/d of Russian refining capacity in August and September. While the market impact is limited for now, the action signals Kyiv’s growing willingness to disrupt oil flows – supporting a soft geopolitical floor under prices.
The political environment is shifting: the EU is reportedly considering sanctions on Indian and Chinese firms facilitating Russian crude flows, while the U.S. has so far held back – despite Bessent warning that any action from Washington depends on broader European participation. Senator Graham has also publicly criticized NATO members like Slovakia and Hungary for continuing Russian oil imports.
It’s worth noting that China and India remain the two largest buyers of Russian barrels since the invasion of Ukraine. While New Delhi has been hit with 50% secondary tariffs, Beijing has been spared so far.
Still, the broader supply/demand balance leans bearish. Futures markets reflect this: Brent’s prompt spread (gauge of near-term tightness) has narrowed to the current USD 0.42/bl, down from USD 0.96/bl two months ago, pointing to weakening backwardation.
This aligns with expectations for a record surplus in 2026, largely driven by the faster-than-anticipated return of OPEC+ barrels to market. OPEC+ is gathering in Vienna this week to begin revising member production capacity estimates – setting the stage for new output baselines from 2027. The group aims to agree on how to define “maximum sustainable capacity,” with a proposal expected by year-end.
While the IEA pegs OPEC+ capacity at 47.9 million barrels per day, actual output in August was only 42.4 million barrels per day. Disagreements over data and quota fairness (especially from Iraq and Nigeria) have already delayed this process. Angola even quit the group last year after being assigned a lower target than expected. It also remains unclear whether Russia and Iraq can regain earlier output levels due to infrastructure constraints.
Also, macro remains another key driver this week. A 25bp Fed rate cut is widely expected tomorrow (Wednesday), and commodities in general could benefit a potential cut.
Summing up: Brent crude continues to drift sideways, finding near-term support from geopolitics and refining strength. But with surplus building and market structure softening, the upside may remain capped.
Brent crude is essentially flat on the week, but after a volatile ride. Prices started Monday near USD 65.5/bl, climbed steadily to a mid-week high of USD 67.8/bl on Wednesday evening, before falling sharply – losing about USD 2/bl during Thursday’s session.
Brent is currently trading around USD 65.8/bl, right back where it began. The volatility reflects the market’s ongoing struggle to balance growing surplus risks against persistent geopolitical uncertainty and resilient refined product margins. Thursday’s slide snapped a three-day rally and came largely in response to a string of bearish signals, most notably from the IEA’s updated short-term outlook.
The IEA now projects record global oversupply in 2026, reinforcing concerns flagged earlier by the U.S. EIA, which already sees inventories building this quarter. The forecast comes just days after OPEC+ confirmed it will continue returning idle barrels to the market in October – albeit at a slower pace of +137,000 bl/d. While modest, the move underscores a steady push to reclaim market share and adds to supply-side pressure into year-end.
Thursday’s price drop also followed geopolitical incidences: Israeli airstrikes reportedly targeted Hamas leadership in Doha, while Russian drones crossed into Polish airspace – events that initially sent crude higher as traders covered short positions.
Yet, sentiment remains broadly cautious. Strong refining margins and low inventories at key pricing hubs like Europe continue to support the downside. Chinese stockpiling of discounted Russian barrels and tightness in refined product markets – especially diesel – are also lending support.
On the demand side, the IEA revised up its 2025 global demand growth forecast by 60,000 bl/d to 740,000 bl/d YoY, while leaving 2026 unchanged at 698,000 bl/d. Interestingly, the agency also signaled that its next long-term report could show global oil demand rising through 2050.
Meanwhile, OPEC offered a contrasting view in its latest Monthly Oil Market Report, maintaining expectations for a supply deficit both this year and next, even as its members raise output. The group kept its demand growth estimates for 2025 and 2026 unchanged at 1.29 million bl/d and 1.38 million bl/d, respectively.
We continue to watch whether the bearish supply outlook will outweigh geopolitical risk, and if Brent can continue to find support above USD 65/bl – a level increasingly seen as a soft floor for OPEC+ policy.
Brent crude makes some gains as Israel’s attack on Hamas in Qatar rattles markets. Brent crude spiked to a high of USD 67.38/b yesterday as Israel made a strike on Hamas in Qatar. But it wasn’t able to hold on to that level and only closed up 0.6% in the end at USD 66.39/b. This morning it is starting on the up with a gain of 0.9% at USD 67/b. Still rattled by Israel’s attack on Hamas in Qatar yesterday. Brent is getting some help on the margin this morning with Asian equities higher and copper gaining half a percent. But the dark cloud of surplus ahead is nonetheless hanging over the market with Brent trading two dollar lower than last Tuesday.

Geopolitical risk premiums in oil rarely lasts long unless actual supply disruption kicks in. While Israel’s attack on Hamas in Qatar is shocking, the geopolitical risk lifting crude oil yesterday and this morning is unlikely to last very long as such geopolitical risk premiums usually do not last long unless real disruption kicks in.
US API data yesterday indicated a US crude and product stock build last week of 3.1 mb. The US API last evening released partial US oil inventory data indicating that US crude stocks rose 1.3 mb and middle distillates rose 1.5 mb while gasoline rose 0.3 mb. In total a bit more than 3 mb increase. US crude and product stocks usually rise around 1 mb per week this time of year. So US commercial crude and product stock rose 2 mb over the past week adjusted for the seasonal norm. Official and complete data are due today at 16:30.
A 2 mb/week seasonally adj. US stock build implies a 1 – 1.4 mb/d global surplus if it is persistent. Assume that if the global oil market is running a surplus then some 20% to 30% of that surplus ends up in US commercial inventories. A 2 mb seasonally adjusted inventory build equals 286 kb/d. Divide by 0.2 to 0.3 and we get an implied global surplus of 950 kb/d to 1430 kb/d. A 2 mb/week seasonally adjusted build in US oil inventories is close to noise unless it is a persistent pattern every week.
US IEA STEO oil report: Robust surplus ahead and Brent averaging USD 51/b in 2026. The US EIA yesterday released its monthly STEO oil report. It projected a large and persistent surplus ahead. It estimates a global surplus of 2.2 m/d from September to December this year. A 2.4 mb/d surplus in Q1-26 and an average surplus for 2026 of 1.6 mb/d resulting in an average Brent crude oil price of USD 51/b next year. And that includes an assumption where OPEC crude oil production only averages 27.8 mb/d in 2026 versus 27.0 mb/d in 2024 and 28.6 mb/d in August.
Brent will feel the bear-pressure once US/OECD stocks starts visible build. In the meanwhile the oil market sits waiting for this projected surplus to materialize in US and OECD inventories. Once they visibly starts to build on a consistent basis, then Brent crude will likely quickly lose altitude. And unless some unforeseen supply disruption kicks in, it is bound to happen.
US IEA STEO September report. In total not much different than it was in January

US IEA STEO September report. US crude oil production contracting in 2026, but NGLs still growing. Close to zero net liquids growth in total.


Tyskland har så höga elpriser att företag inte har råd att använda elektricitet
Brent crude ticks higher on tension, but market structure stays soft

Kinas elproduktion slog nytt rekord i augusti, vilket även kolkraft gjorde

Det stigande guldpriset en utmaning för smyckesköpare

Aktier i guldbolag laggar priset på guld

Meta bygger ett AI-datacenter på 5 GW och 2,25 GW gaskraftverk
Aker BP gör ett av Norges största oljefynd på ett decennium, stärker resurserna i Yggdrasilområdet
Sommarens torka kan ge högre elpriser i höst
Brent edges higher as India–Russia oil trade draws U.S. ire and Powell takes the stage at Jackson Hole

Mahvie Minerals är verksamt i guldrikt område i Finland
-
 Nyheter4 veckor sedan
Meta bygger ett AI-datacenter på 5 GW och 2,25 GW gaskraftverk
-
 Nyheter4 veckor sedan
Aker BP gör ett av Norges största oljefynd på ett decennium, stärker resurserna i Yggdrasilområdet
-
 Nyheter4 veckor sedan
Sommarens torka kan ge högre elpriser i höst
-
Analys4 veckor sedan
Brent edges higher as India–Russia oil trade draws U.S. ire and Powell takes the stage at Jackson Hole
-
 Nyheter3 veckor sedan
Mahvie Minerals är verksamt i guldrikt område i Finland
-
Analys3 veckor sedan
Increasing risk that OPEC+ will unwind the last 1.65 mb/d of cuts when they meet on 7 September
-

 Nyheter3 veckor sedan
Neil Atkinson spår att priset på olja kommer att stiga till 70 USD
-
Analys2 veckor sedan
OPEC+ in a process of retaking market share