

Analys
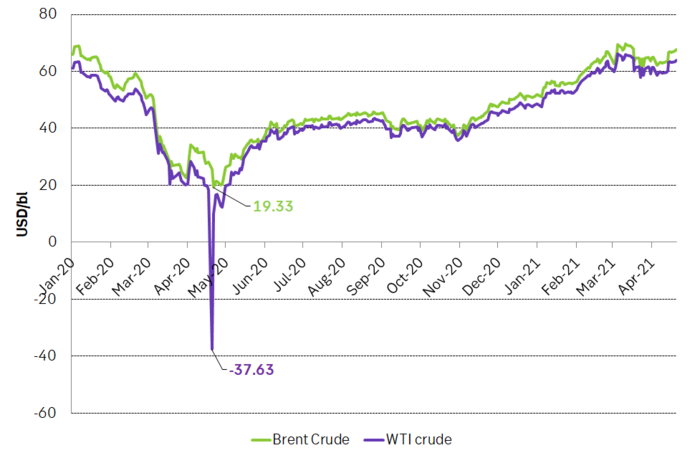
One year after USD -37.63/bl


It is exactly one year since WTI crashed to USD -37.63/bl. Yes, it was probably trading games involved. Yes, it was highly specific to storage and pipeline constraints at the pricing point of WTI in Cushing Oklahoma as Brent crude only fell to USD 19.33/bl. Yes, it was a price war between Russia and Saudi Arabia which broke out after the 6 March meeting. Yes, it was Covid-19 lock-downs which killed demand. But what really stands out looking back was that you don’t steal from the King. You don’t steal from OPEC. You don’t steal market shares from the world’ lowest cost producers. Try that again and you’ll get punished again.

The price war between Russia and Saudi Arabia which broke out after the 6 March meeting last year looked like an ill considered tantrum from a hot tempered Muhammed bin Salman in Saudi Arabia lashing out against Russia which did not want to play the ”hold back production, loose market share, get higher prices” game any more. And maybe such a tantrum was really what happen. Who knows.
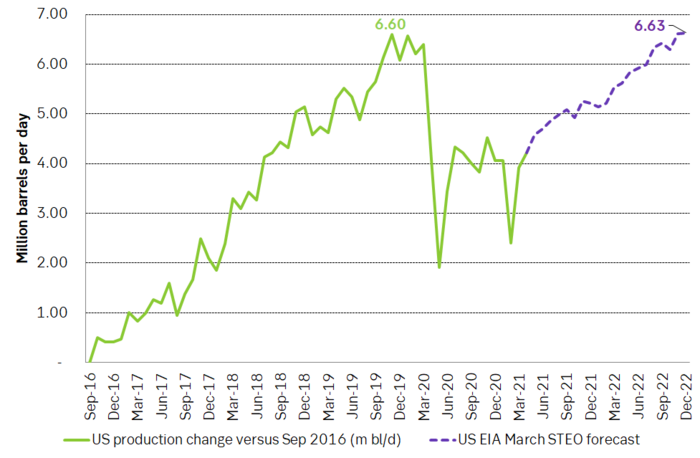
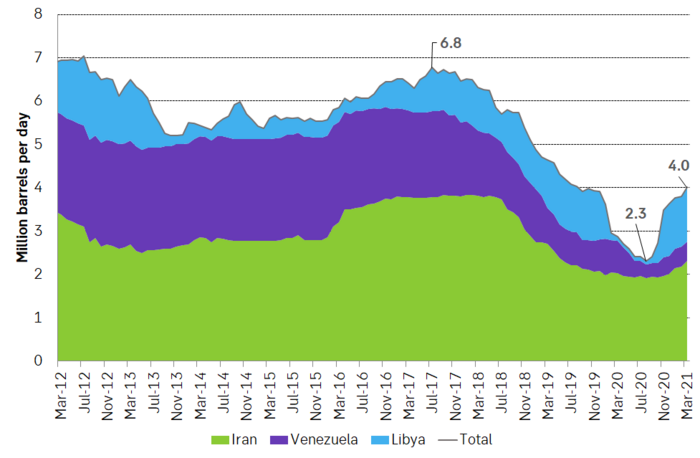
But the underlying fundamentals story here was that US liquids production was growing like crazy. From Sep 2016 to Jan 2020 it grew by 6.6 m bl/d. And Russia was sick of holding back production forever while seeing US taking more and more market share. The only reason for why this could go on as long as it did was because there was an almost comparable large decline in supply from the key OPEC producers being Venezuela, Iran and Libya which lost 4.5 m bl/d from mid-2017 to mid-2020. Thus yielding room for the incredible US production growth.
It was like the business strategy of US shale oil players was: ”Let’s steel market share from the lowest cost producers in the world being OPEC/OPEC+. Fundamentally that is a no-go strategy to start. Though it can go on for a little while before it falls apart. And it did go on for a little while but largely because of the very large decline from Venezuela, Libya and Iran. But looking back it is obvious that it had to end.
OPEC knows very well that the oil price is all about controlling supply. There is an infinite amount of oil under ground. Make sure it is not too much above ground and you’ll get rich. I.e. control your capex spending. US shale oil players obviously have been nowhere near thinking along such lines.
Looking forward is not all such a great picture if we base it on 1) The ongoing return of production from Iran and Libya. I.e. the reversal of the losses within OPEC from mid-2017 which enabled the US shale oil boom to go on as long as it did and 2) The projected non-OPEC production growth from the US EIA in its March STEO pointing to a very strong rebound in both US shale oil and total non-OPEC production towards the end of 2022.
The key message from 20 April 2020 is: Do not steal from the King. Do not try to steal market shares from the worlds lowest cost producers (it is stupid). If you do you will get punished again. In a world where oil demand is growing at around 1% over the coming years you should not lay plans for growing your production at 2% or 5% or 10% per year. Because if you do it fundamentally means that you must steel market share from someone. It for sure won’t be the lowest cost producers.
The end-game though could be that there is only one way to tame the production from non-OPEC and that is a lower price.
Brent and WTI crude prices and the crazy WTI crash to USD -37.63/bl. The recovery since then is all due to deep cuts in production by OPEC+ and still is. If OPEC+ hadn’t still been holding back significant volumes then we would have had no more than USD 30-40/bl today.
Crazy US hydrocarbon liquids growth. From a low in Sep-2016 it grew by 6.6 m bl/d before the collapse in Q1-2020. According to the EIA’s STEO from March it is set to revive and reach the same gain at the end of 2022 though the EIA STEO from April has modified that a bit lower again.
The same chart for changes in total non-OPEC production since Sep-2016 gives much the same picture. What we see is that it is not only US production which increased but also other non-OPEC producers lifted increased production in this period. But mostly it is US.
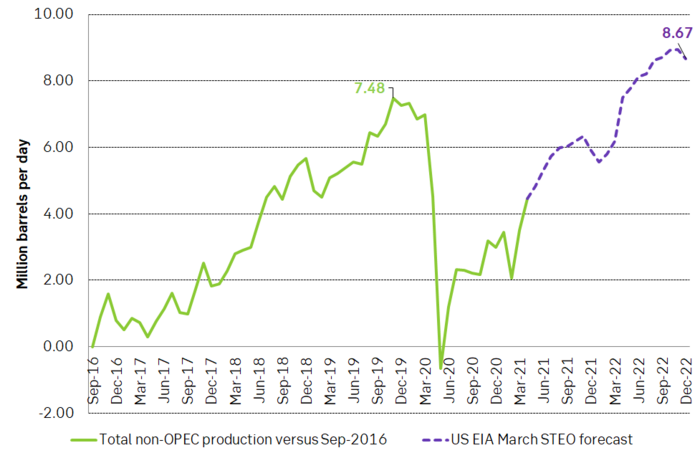
And the maga-growth in non-OPEC production did of course take their market share from OPEC. Massive decline in production by three OPEC members Iran, Venezuela and Iran. Libya has now kicked back with more to come and Iran is just about to move into the market again as signals from the ongoing Vienna talks on the revival of JCPOA (Iran nuclear deal) are positive with all sides at the table wanting the same thing. Saudi Arabia, Israel and the Iranian Revolutionary Guard may not want success but they are not sitting at the negotiation table in Vienna. A strong rebound in non-OPEC production as envisioned by the EIA March STEO forecast will be outright impossible with a production revival from these three countries.
When it starts to move lower it moves rather quickly. Gaza, China, IEA. Brent crude is down 2.1% today to $62/b after having traded as high as $66.58/b last Thursday and above $70/b in late September. The sell-off follows the truce/peace in Gaze, a flareup in US-China trade and yet another bearish oil outlook from the IEA.

A lasting peace in Gaze could drive crude oil at sea to onshore stocks. A lasting peace in Gaza would probably calm down the Houthis and thus allow more normal shipments of crude oil to sail through the Suez Canal, the Red Sea and out through the Bab-el-Mandeb Strait. Crude oil at sea has risen from 48 mb in April to now 91 mb versus a pre-Covid normal of about 50-60 mb. The rise to 91 mb is probably the result of crude sailing around Africa to be shot to pieces by the Houthis. If sailings were to normalize through the Suez Canal, then it could free up some 40 mb in transit at sea moving onshore into stocks.
The US-China trade conflict is of course bearish for demand if it continues.
Bearish IEA yet again. Getting closer to 2026. Credibility rises. We expect OPEC to cut end of 2025. The bearish monthly report from the IEA is what it is, but the closer we get to 2026, the more likely the IEA is of being ball-park right in its outlook. In its monthly report today the IEA estimates that the need for crude oil from OPEC in 2026 will be 25.4 mb/d versus production by the group in September of 29.1 mb/d. The group thus needs to do some serious cutting at the end of 2025 if it wants to keep the market balanced and avoid inventories from skyrocketing. Given that IEA is correct that is. We do however expect OPEC to implement cuts to avoid a large increase in inventories in Q1-26. The group will probably revert to cuts either at its early December meeting when they discuss production for January or in early January when they discuss production for February. The oil price will likely head yet lower until the group reverts to cuts.
Dubai: The Mid-East anchor dragging crude oil lower. Surplus emerging in Mid-East pricing. Crude oil prices held surprisingly strong all through the summer. A sign and a key source of that strength came from the strength in the front-end backwardation of the Dubai crude oil curve. It held out strong from mid-June and all until late September with an average 1-3mth time-spread premium of $1.8/b from mid-June to end of September. The 1-3mth time-spreads for Brent and WTI however were in steady deterioration from late June while their flat prices probably were held up by the strength coming from the Persian Gulf. Then in late September the strength in the Dubai curve suddenly collapsed. Since the start of October it has been weaker than both the Brent and the WTI curves. The Dubai 1-3mth time-spread now only stands at $0.25/b. The Middle East is now exporting more as it is producing more and also consuming less following elevated summer crude burn for power (Aircon) etc.
The only bear-element missing is a sudden and solid rise in OECD stocks. The only thing that is missing for the bear-case everyone have been waiting for is a solid, visible rise in OECD stocks in general and US oil stocks specifically. So watch out for US API indications tomorrow and official US oil inventories on Thursday.
No sign of any kind of fire-sale of oil from Saudi Arabia yet. To what we can see, Saudi Arabia is not at all struggling to sell its oil. It only lowered its Official Selling Prices (OSPs) to Asia marginally for November. A surplus market + Saudi determination to sell its oil to the market would normally lead to a sharp lowering of Saudi OSPs to Asia. Not yet at least and not for November.
The 5yr contract close to fixed at $68/b. Of importance with respect to how far down oil can/will go. When the oil market moves into a surplus then the spot price starts to trade in a large discount to the 5yr contract. Typically $10-15/b below the 5yr contract on average in bear-years (2009, 2015, 2016, 2020). But the 5yr contract is usually pulled lower as well thus making this approach a moving target. But the 5yr contract price has now been rock solidly been pegged to $68/b since 2022. And in the 2022 bull-year (Brent spot average $99/b), the 5yr contract only went to $72/b on average. If we assume that the same goes for the downside and that 2026 is a bear-year then the 5yr goes to $64/b while the spot is trading at a $10-15/b discount to that. That would imply an average spot price next year of $49-54/b. But that is if OPEC doesn’t revert to cuts and instead keeps production flowing. We think OPEC(+) will trim/cut production as needed into 2026 to prevent a huge build-up in global oil stocks and a crash in prices. But for now we are still heading lower. Into the $50ies/b.
Some rebound but not much. Brent crude rebounded 1.5% yesterday to $65.47/b. This morning it is inching 0.2% up to $65.6/b. The lowest close last week was on Thursday at $64.11/b.
The curve structure is almost as week as it was before the weekend. The rebound we now have gotten post the message from OPEC+ over the weekend is to a large degree a rebound along the curve rather than much strengthening at the front-end of the curve. That part of the curve structure is almost as weak as it was last Thursday.
We are still on a weakening path. The message from OPEC+ over the weekend was we are still on a weakening path with rising supply from the group. It is just not as rapidly weakening as was feared ahead of the weekend when a quota hike of 500 kb/d/mth for November was discussed.
The Brent curve is on its way to full contango with Brent dipping into the $50ies/b. Thus the ongoing weakening we have had in the crude curve since the start of the year, and especially since early June, will continue until the Brent crude oil forward curve is in full contango along with visibly rising US and OECD oil inventories. The front-month Brent contract will then flip down towards the $60/b-line and below into the $50ies/b.
At what point will OPEC+ turn to cuts? The big question then becomes: When will OPEC+ turn around to make some cuts? At what (price) point will they choose to stabilize the market? Because for sure they will. Higher oil inventories, some more shedding of drilling rigs in US shale and Brent into the 50ies somewhere is probably where the group will step in.
There is nothing we have seen from the group so far which indicates that they will close their eyes, let the world drown in oil and the oil price crash to $40/b or below.
The message from OPEC+ is also about balance and stability. The world won’t drown in oil in 2026. The message from the group as far as we manage to interpret it is twofold: 1) Taking back market share which requires a lower price for non-OPEC+ to back off a bit, and 2) Oil market stability and balance. It is not just about 1. Thus fretting about how we are all going to drown in oil in 2026 is totally off the mark by just focusing on point 1.
When to buy cal 2026? Before Christmas when Brent hits $55/b and before OPEC+ holds its last meeting of the year which is likely to be in early December.
Brent crude oil prices have rebounded a bit along the forward curve. Not much strengthening in the structure of the curve. The front-end backwardation is not much stronger today than on its weakest level so far this year which was on Thursday last week.

The front-end backwardation fell to its weakest level so far this year on Thursday last week. A slight pickup yesterday and today, but still very close to the weakest year to date. More oil from OPEC+ in the coming months and softer demand and rising inventories. We are heading for yet softer levels.

Down to the lowest since early May. Brent crude has fallen sharply the latest four days. It closed at USD 64.11/b yesterday which is the lowest since early May. It is staging a 1.3% rebound this morning along with gains in both equities and industrial metals with an added touch of support from a softer USD on top.
What stands out the most to us this week is the collapse in the Dubai one to three months time-spread.
Dubai is medium sour crude. OPEC+ is in general medium sour crude production. Asian refineries are predominantly designed to process medium sour crude. So Dubai is the real measure of the balance between OPEC+ holding back or not versus Asian oil demand for consumption and stock building.
A sharp weakening of the front-end of the Dubai curve. The front-end of the Dubai crude curve has been holding out very solidly throughout this summer while the front-end of the Brent and WTI curves have been steadily softening. But the strength in the Dubai curve in our view was carrying the crude oil market in general. A source of strength in the crude oil market. The core of the strength.
The now finally sharp decline of the front-end of the Dubai crude curve is thus a strong shift. Weakness in the Dubai crude marker is weakness in the core of the oil market. The core which has helped to hold the oil market elevated.
Facts supports the weakening. Add in facts of Iraq lifting production from Kurdistan through Turkey. Saudi Arabia lifting production to 10 mb/d in September (normal production level) and lifting exports as well as domestic demand for oil for power for air con is fading along with summer heat. Add also in counter seasonal rise in US crude and product stocks last week. US oil stocks usually decline by 1.3 mb/week this time of year. Last week they instead rose 6.4 mb/week (+7.2 mb if including SPR). Total US commercial oil stocks are now only 2.1 mb below the 2015-19 seasonal average. US oil stocks normally decline from now to Christmas. If they instead continue to rise, then it will be strongly counter seasonal rise and will create a very strong bearish pressure on oil prices.
Will OPEC+ lift its voluntary quotas by zero, 137 kb/d, 500 kb/d or 1.5 mb/d? On Sunday of course OPEC+ will decide on how much to unwind of the remaining 1.5 mb/d of voluntary quotas for November. Will it be 137 kb/d yet again as for October? Will it be 500 kb/d as was talked about earlier this week? Or will it be a full unwind in one go of 1.5 mb/d? We think most likely now it will be at least 500 kb/d and possibly a full unwind. We discussed this in a not earlier this week: ”500 kb/d of voluntary quotas in October. But a full unwind of 1.5 mb/d”
The strength in the front-end of the Dubai curve held out through summer while Brent and WTI curve structures weakened steadily. That core strength helped to keep flat crude oil prices elevated close to the 70-line. Now also the Dubai curve has given in.

Brent crude oil forward curves

Total US commercial stocks now close to normal. Counter seasonal rise last week. Rest of year?

Total US crude and product stocks on a steady trend higher.


The Mid-East anchor dragging crude oil lower

Samtal om sällsynta jordartsmetaller, guld och silver

Brookfield köper bränsleceller för 5 miljarder USD av Bloom Energy för att driva AI-datacenter

Teck Resources kan förse Nordamerika och kanske hela G7 med all germanium som behövs

Leading Edge Materials är på rätt plats i rätt tid

Kinas elproduktion slog nytt rekord i augusti, vilket även kolkraft gjorde

Tyskland har så höga elpriser att företag inte har råd att använda elektricitet

OPEC+ missar produktionsmål, stöder oljepriserna

Ett samtal om guld, olja, fjärrvärme och förnybar energi
Brent crude ticks higher on tension, but market structure stays soft
-
 Nyheter4 veckor sedan
Kinas elproduktion slog nytt rekord i augusti, vilket även kolkraft gjorde
-
Nyheter4 veckor sedan
Tyskland har så höga elpriser att företag inte har råd att använda elektricitet
-
 Nyheter3 veckor sedan
OPEC+ missar produktionsmål, stöder oljepriserna
-
 Nyheter3 veckor sedan
Ett samtal om guld, olja, fjärrvärme och förnybar energi
-
Analys4 veckor sedan
Brent crude ticks higher on tension, but market structure stays soft
-
Analys3 veckor sedan
Are Ukraine’s attacks on Russian energy infrastructure working?
-

 Nyheter2 veckor sedan
Guld nära 4000 USD och silver 50 USD, därför kan de fortsätta stiga
-

 Nyheter3 veckor sedan
Guldpriset uppe på nya höjder, nu 3750 USD