

Analys
Metals price forecast: Lower Before Higher

Lower before higher

The world is slowing down along with fiscal and monetary tightening. The rapid rise in interest rates this year will work with a lag so the slowdown in the real economy is likely to continue. We expect metals prices to ease along with that. The continued deterioration in the Chinese property market is likely structural with growth shifting towards higher value sectors including green energy and EVs. Chinese credit expansion has started. Stronger demand for metals like copper, nickel and aluminium is likely to emerge in H2-23. Strong prices for metals over the coming decade due to sub-par capex spending over the past decade is likely.

Weakening macro and weakening demand. The world is now in the grip of a tightening craze amid inflation panic which was the result of the stimulus boom ignited by Covid-19 panic. The US expanded its M2 monetary base by 30% of GDP during the stimulus boom. Donald Trump earlier clamped down on immigration from Mexico/Latin America. Rampant consumer spending on capital goods together with an ultra-tight labor market then led to intense inflation pressure in the US. But also, in many other countries which also stimulated too much. The US is ahead of the curve with respect to interest rate hikes. The USD has rallied, forcing many central banks around the world to lift rates to defend their currencies as well as fighting their own inflationary pressures. The Japanese central bank has refrained from doing so and has instead intervened in the yen currency market for the first time since 1998. The year 2022 will likely be the worst selloff in global government bonds since 1949 as interest rates rise rapidly from very low levels. This is taking place following a decade where the world has been gorging on ultra-cheap debt. There is clearly a risk that something will break apart somewhere in the financial system as the world gallops through this extreme roller coaster ride of stimulus and tightening. On top of this we have and energy crisis in Europe where natural gas prices for year 2023 currently is priced at 700% of normal levels. War in Ukraine, risk for the use of nuclear weapons, an enduring cool-down of the Chinese property market and continued lock-downs in China due to Covid-19 is adding plenty of uncertain elements.
Downside price risks for metals over the coming 6-9 months. The significant rise in rates around the world will work with a lag. There can be up to a 12-month lag from rates starts to rise to when they take real effect. Continued economic cool-down in the economy is thus likely. Chinese politicians seem unlikely to run yet another round of property market-based stimulus. As such there are clearly downside risks to global economic growth and industrial metals prices over the coming 6 months.
China may be a “White Swan Event” in H2-23 onward. LME’s China seminar in London on Monday 24 October this year was very interesting. The brightest spot in our view was Jinny Yang, the Chief China economist at ICBC Standard Bank. She stated that China may turn out to be a “white swan event” in H2-2023. Further that the Chinese economy now is on a decade long type of transition period. Away from property focused growth. With a shift instead to technology and innovation, telecoms and energy transition, consumer demand side economy and higher value and more advanced sectors. The property market will be a fading sector with respect to growth. Chinese politicians are fully committed to the energy transition. No slowdown in there. Credit expansion has already started. The real effect of that will emerge in H2-23. The new growth focus will be different from before. But it will still imply lots of metals like aluminium, copper, nickel, zinc, cobalt, manganese, and other special metals. There will be less copper for pipes and wiring for housing but there will be more copper for EVs, Solar power, Wind power and power networks etc.
Copper: Struggling supply from Chile, rising supply from Africa while Russian exports keeps flowing to market. The Chinese housing market normally accounts for 20% of global copper demand. So, slowing Chinese housing market is bad for copper. Russian exports keep flowing to SE Asia where it is re-exported. Good supply growth is expected from Africa in 2023. Supply from Chile is struggling with falling ore grades, political headwinds, and mining strikes. Demand is projected to boom over the coming decades while investments in new mines have been sub-par over the past decade. So strong prices in the medium to longer term. But in the short-term the negative demand forces will likely have the upper hand.
Nickel: Tight high-quality nickel market but surplus for low-quality nickel. There is currently a plentiful supply of low-grade nickel with weak stainless-steel demand and strong demand for high quality nickel for EV batteries. The result is a current USD 5-6000/ton price premium for high-quality vs. low-quality nickel. High-quality LME grade nickel now only accounts for 25% of the global nickel market. Over the coming decade there will be strong demand growth for high-quality nickel for EV batteries, but high-quality NiSO4 will take center stage. The price of high-quality nickel over the coming decade will depend on how quickly the world can ramp up low-grade to high-grade conversion capacity.
Aluminium: Russian production and exports keeps flowing at normal pace to the market through different routes. Supply from the western world set to expand by 1.3 m ton pa in 2023, the biggest expansion in a decade. Demand is projected to grow strongly over the decade to come with energy transition and EVs being strong sources of demand. Western premiums likely to stay elevated versus Asian premiums to attract metal. Increasing focus on low carbon aluminium. But weakness before strength.
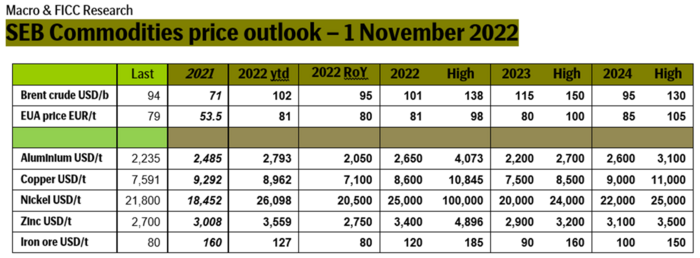
SEB commodities price forecast:
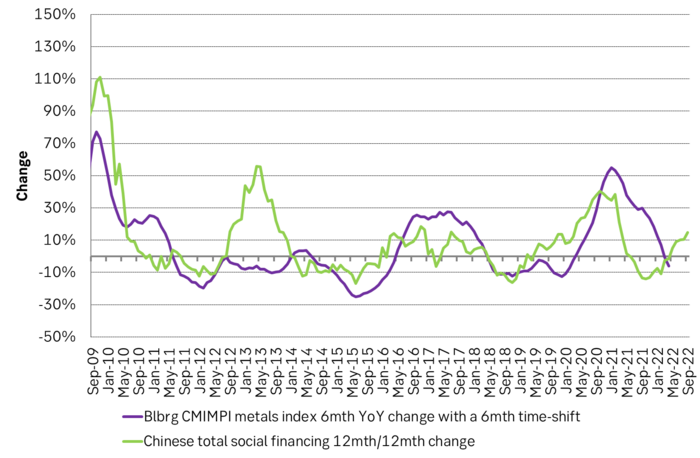
Chinese credit cycle vs industrial metals. Chinese credit expansion has already started.
This report has been compiled by SEB´s Commodity Research, a division within Skandinaviska Enskilda Banken AB (publ) (”SEB”), to provide background information only.
Some rebound but not much. Brent crude rebounded 1.5% yesterday to $65.47/b. This morning it is inching 0.2% up to $65.6/b. The lowest close last week was on Thursday at $64.11/b.

The curve structure is almost as week as it was before the weekend. The rebound we now have gotten post the message from OPEC+ over the weekend is to a large degree a rebound along the curve rather than much strengthening at the front-end of the curve. That part of the curve structure is almost as weak as it was last Thursday.
We are still on a weakening path. The message from OPEC+ over the weekend was we are still on a weakening path with rising supply from the group. It is just not as rapidly weakening as was feared ahead of the weekend when a quota hike of 500 kb/d/mth for November was discussed.
The Brent curve is on its way to full contango with Brent dipping into the $50ies/b. Thus the ongoing weakening we have had in the crude curve since the start of the year, and especially since early June, will continue until the Brent crude oil forward curve is in full contango along with visibly rising US and OECD oil inventories. The front-month Brent contract will then flip down towards the $60/b-line and below into the $50ies/b.
At what point will OPEC+ turn to cuts? The big question then becomes: When will OPEC+ turn around to make some cuts? At what (price) point will they choose to stabilize the market? Because for sure they will. Higher oil inventories, some more shedding of drilling rigs in US shale and Brent into the 50ies somewhere is probably where the group will step in.
There is nothing we have seen from the group so far which indicates that they will close their eyes, let the world drown in oil and the oil price crash to $40/b or below.
The message from OPEC+ is also about balance and stability. The world won’t drown in oil in 2026. The message from the group as far as we manage to interpret it is twofold: 1) Taking back market share which requires a lower price for non-OPEC+ to back off a bit, and 2) Oil market stability and balance. It is not just about 1. Thus fretting about how we are all going to drown in oil in 2026 is totally off the mark by just focusing on point 1.
When to buy cal 2026? Before Christmas when Brent hits $55/b and before OPEC+ holds its last meeting of the year which is likely to be in early December.
Brent crude oil prices have rebounded a bit along the forward curve. Not much strengthening in the structure of the curve. The front-end backwardation is not much stronger today than on its weakest level so far this year which was on Thursday last week.

The front-end backwardation fell to its weakest level so far this year on Thursday last week. A slight pickup yesterday and today, but still very close to the weakest year to date. More oil from OPEC+ in the coming months and softer demand and rising inventories. We are heading for yet softer levels.

Down to the lowest since early May. Brent crude has fallen sharply the latest four days. It closed at USD 64.11/b yesterday which is the lowest since early May. It is staging a 1.3% rebound this morning along with gains in both equities and industrial metals with an added touch of support from a softer USD on top.
What stands out the most to us this week is the collapse in the Dubai one to three months time-spread.
Dubai is medium sour crude. OPEC+ is in general medium sour crude production. Asian refineries are predominantly designed to process medium sour crude. So Dubai is the real measure of the balance between OPEC+ holding back or not versus Asian oil demand for consumption and stock building.
A sharp weakening of the front-end of the Dubai curve. The front-end of the Dubai crude curve has been holding out very solidly throughout this summer while the front-end of the Brent and WTI curves have been steadily softening. But the strength in the Dubai curve in our view was carrying the crude oil market in general. A source of strength in the crude oil market. The core of the strength.
The now finally sharp decline of the front-end of the Dubai crude curve is thus a strong shift. Weakness in the Dubai crude marker is weakness in the core of the oil market. The core which has helped to hold the oil market elevated.
Facts supports the weakening. Add in facts of Iraq lifting production from Kurdistan through Turkey. Saudi Arabia lifting production to 10 mb/d in September (normal production level) and lifting exports as well as domestic demand for oil for power for air con is fading along with summer heat. Add also in counter seasonal rise in US crude and product stocks last week. US oil stocks usually decline by 1.3 mb/week this time of year. Last week they instead rose 6.4 mb/week (+7.2 mb if including SPR). Total US commercial oil stocks are now only 2.1 mb below the 2015-19 seasonal average. US oil stocks normally decline from now to Christmas. If they instead continue to rise, then it will be strongly counter seasonal rise and will create a very strong bearish pressure on oil prices.
Will OPEC+ lift its voluntary quotas by zero, 137 kb/d, 500 kb/d or 1.5 mb/d? On Sunday of course OPEC+ will decide on how much to unwind of the remaining 1.5 mb/d of voluntary quotas for November. Will it be 137 kb/d yet again as for October? Will it be 500 kb/d as was talked about earlier this week? Or will it be a full unwind in one go of 1.5 mb/d? We think most likely now it will be at least 500 kb/d and possibly a full unwind. We discussed this in a not earlier this week: ”500 kb/d of voluntary quotas in October. But a full unwind of 1.5 mb/d”
The strength in the front-end of the Dubai curve held out through summer while Brent and WTI curve structures weakened steadily. That core strength helped to keep flat crude oil prices elevated close to the 70-line. Now also the Dubai curve has given in.

Brent crude oil forward curves

Total US commercial stocks now close to normal. Counter seasonal rise last week. Rest of year?

Total US crude and product stocks on a steady trend higher.

Analys
OPEC+ will likely unwind 500 kb/d of voluntary quotas in October. But a full unwind of 1.5 mb/d in one go could be in the cards
Down to mid-60ies as Iraq lifts production while Saudi may be tired of voluntary cut frugality. The Brent December contract dropped 1.6% yesterday to USD 66.03/b. This morning it is down another 0.3% to USD 65.8/b. The drop in the price came on the back of the combined news that Iraq has resumed 190 kb/d of production in Kurdistan with exports through Turkey while OPEC+ delegates send signals that the group will unwind the remaining 1.65 mb/d (less the 137 kb/d in October) of voluntary cuts at a pace of 500 kb/d per month pace.
Signals of accelerated unwind and Iraqi increase may be connected. Russia, Kazakhstan and Iraq were main offenders versus the voluntary quotas they had agreed to follow. Russia had a production ’debt’ (cumulative overproduction versus quota) of close to 90 mb in March this year while Kazakhstan had a ’debt’ of about 60 mb and the same for Iraq. This apparently made Saudi Arabia angry this spring. Why should Saudi Arabia hold back if the other voluntary cutters were just freeriding? Thus the sudden rapid unwinding of voluntary cuts. That is at least one angle of explanations for the accelerated unwinding.
If the offenders with production debts then refrained from lifting production as the voluntary cuts were rapidly unwinded, then they could ’pay back’ their ’debts’ as they would under-produce versus the new and steadily higher quotas.
Forget about Kazakhstan. Its production was just too far above the quotas with no hope that the country would hold back production due to cross-ownership of oil assets by international oil companies. But Russia and Iraq should be able to do it.
Iraqi cumulative overproduction versus quotas could reach 85-90 mb in October. Iraq has however steadily continued to overproduce by 3-5 mb per month. In July its new and gradually higher quota came close to equal with a cumulative overproduction of only 0.6 mb that month. In August again however its production had an overshoot of 100 kb/d or 3.1 mb for the month. Its cumulative production debt had then risen to close to 80 mb. We don’t know for September yet. But looking at October we now know that its production will likely average close to 4.5 mb/d due to the revival of 190 kb/d of production in Kurdistan. Its quota however will only be 4.24 mb/d. Its overproduction in October will thus likely be around 250 kb/d above its quota with its production debt rising another 7-8 mb to a total of close to 90 mb.
Again, why should Saudi Arabia be frugal while Iraq is freeriding. Better to get rid of the voluntary quotas as quickly as possible and then start all over with clean sheets.
Unwinding the remaining 1.513 mb/d in one go in October? If OPEC+ unwinds the remaining 1.513 mb/d of voluntary cuts in one big go in October, then Iraq’s quota will be around 4.4 mb/d for October versus its likely production of close to 4.5 mb/d for the coming month..
OPEC+ should thus unwind the remaining 1.513 mb/d (1.65 – 0.137 mb/d) in one go for October in order for the quota of Iraq to be able to keep track with Iraq’s actual production increase.
October 5 will show how it plays out. But a quota unwind of at least 500 kb/d for Oct seems likely. An overall increase of at least 500 kb/d in the voluntary quota for October looks likely. But it could be the whole 1.513 mb/d in one go. If the increase in the quota is ’only’ 500 kb/d then Iraqi cumulative production will still rise by 5.7 mb to a total of 85 mb in October.
Iraqi production debt versus quotas will likely rise by 5.7 mb in October if OPEC+ only lifts the overall quota by 500 kb/d in October. Here assuming historical production debt did not rise in September. That Iraq lifts its production by 190 kb/d in October to 4.47 mb/d (August level + 190 kb/d) and that OPEC+ unwinds 500 kb/d of the remining quotas in October when they decide on this on 5 October.


Silver spränger den magiska gränsen, kostar nu över 50 USD per uns

Blykalla, Evroc och Studsvik vill bygga kärnkraftsdrivna datacenter i Sverige

Toppmöte om framtidens kärnkraft runt Östersjön hölls idag

Nytt prisrekord, guld stiger över 4000 USD

Goldman Sachs höjer prognosen för guld, tror priset når 4900 USD

Mahvie Minerals i en guldtrend
Volatile but going nowhere. Brent crude circles USD 66 as market weighs surplus vs risk

Aktier i guldbolag laggar priset på guld

Kinas elproduktion slog nytt rekord i augusti, vilket även kolkraft gjorde

Tyskland har så höga elpriser att företag inte har råd att använda elektricitet
-
 Nyheter4 veckor sedan
Mahvie Minerals i en guldtrend
-
Analys4 veckor sedan
Volatile but going nowhere. Brent crude circles USD 66 as market weighs surplus vs risk
-
 Nyheter4 veckor sedan
Aktier i guldbolag laggar priset på guld
-
 Nyheter3 veckor sedan
Kinas elproduktion slog nytt rekord i augusti, vilket även kolkraft gjorde
-
Nyheter3 veckor sedan
Tyskland har så höga elpriser att företag inte har råd att använda elektricitet
-

 Nyheter4 veckor sedan
Guld når sin högsta nivå någonsin, nu även justerat för inflation
-

 Nyheter4 veckor sedan
Det stigande guldpriset en utmaning för smyckesköpare
-
Analys4 veckor sedan
Waiting for the surplus while we worry about Israel and Qatar