

Analys
Market doubting demand but Saudi/Russia are holding a steady course


Brent crude has sold off hard since 28 September. Fear for the health of the global economy and thus oil demand going forward is at the heart of the sell-off. Prior to that, a clarifying message from the Saudi Energy Minister, Prince Abdulaziz bin Salman, at a conference in Calgary on 18 September to a large degree also removed the USD 100/b plus scenario. Speculators had also accumulated significant long positions in oil since a low point in late June. And the last in have probably been hurt in the sell-off and tried to get out. Lastly we have the US oil inventories published on Wednesday this week which were very bearish as they rose almost 5 m b vs an normal draw this time of year of around 2 m b. And specifically gasoline stocks which jumped 6.5 m b to above the 2015-19 level with gasoline refining margins crashing as a result. But amid all this we still have Saudi/Russia which are holding a steady course with cuts and export reductions to end of year with Saudi spicing this up with Official Selling Price of its Extra Light crude to Europe at USD 7.2/b (Premium to Dubai crude) for November which is the highest since 2002. So USD 100/b plus is not in the cards. But neither is USD 50-60-70/b as Saudi his holding a steady course. Our bet is Brent crude averaging USD 85/b in Q4-23 in a balance between what Saudi Arabia wants and needs versus what is a sensible and acceptable level for the global economy.
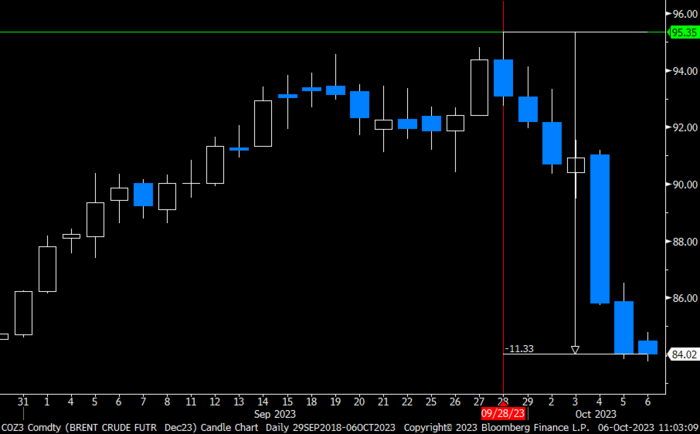
The December Brent crude oil contract has fallen from an intraday high of USD 95.35/b on 28 September to now USD 83.9/b, a loss of USD 11.4/b. At heart of this decline is concerns for the outlook for the global economy and thus oil demand.
The clear and almost unanimous message from central banks across the board towards the end of September was ”interest rates higher for longer”. Add in flows for US government bonds where China and Japan no longer are big buyers (if at all), the US Fed is a net seller of bonds (QT) rather than a buyer (QE) while the US government is selling more and more bonds. This has driven the US 10yr government bond yield higher and higher to a recent peak of 4.8% which is the highest since 2007. With no relief in sight, this ”interest rate pain” is going to hurt the global economy and thus oil demand. This is probably one key reason/trigger for why oil has sold down so hard recently.
An other reason is probably the message to the market which Saudi Arabia’s energy minister, Prince Abdulaziz bin Salman, delivered to the market at a conference in Calgary on 18 September. He made it very clear that the current cuts were not about driving the oil price to the sky, but rather that it was precautionary versus uncertain demand. Further that if demand indeed turned out to be strong then hallelujah, they would produce more. The oil market has probably been a bit confused on this point with some saying that the aim of Saudi cuts was to drive crude oil above USD 100/b. Such kind of views was pushed aside by the Saudi minister. A sustained move above USD 100/b was very unlikely after the minister’s statements.
Speculators added more than 300 million barrels of net long positions late June. These have probably taken money off the table in the recent sell-off and thus contributed to the sharpness in the sell-off.
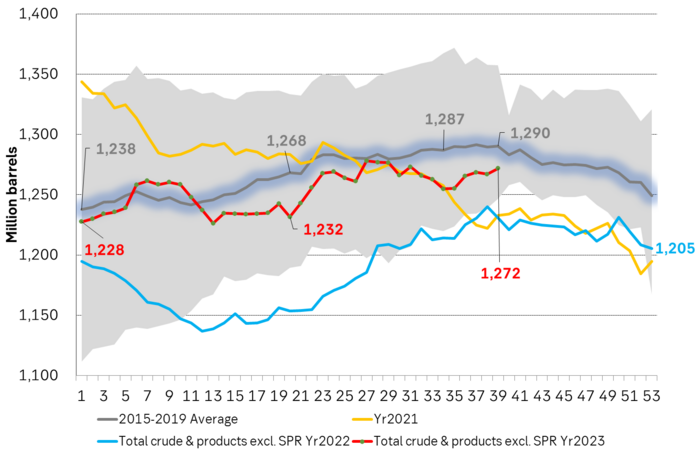
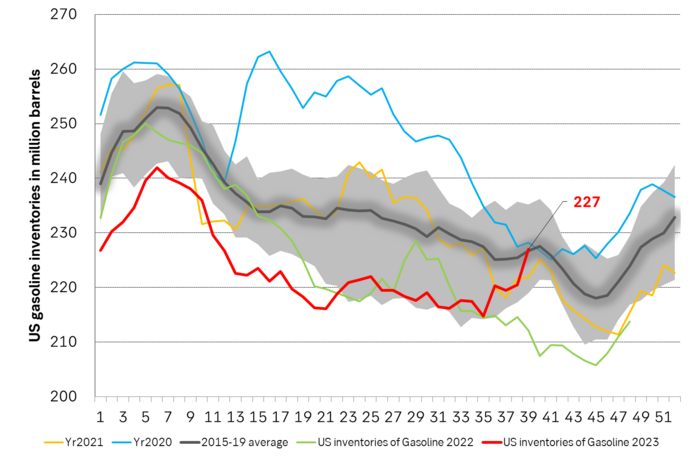
Then we have the US oil inventory data this Wednesday which gave a very bearish message to the market. Rather than a seasonal draw of around 2 m b the total US commercial crude and product stocks rose 4.6 m b. With this the US commercial oil stocks are only about 15 m b below the smoothed 2015-19 seasonal average. Gasoline stocks roes 6.5 m b to a level slightly above the 2015-19 average with implied US gasoline demand falling to the lowest level since 2008. The gasoline refining margin, the crack, has now collapsed to less than USD 6/b while it was more than USD 30/b in late August. US inventories of crude and middle distillates are still significantly below normal. In total almost 50 m b below the 2015-19 level. This is an uncomfortable situation ahead of the winter which keeps the market in a partial bullish grip.
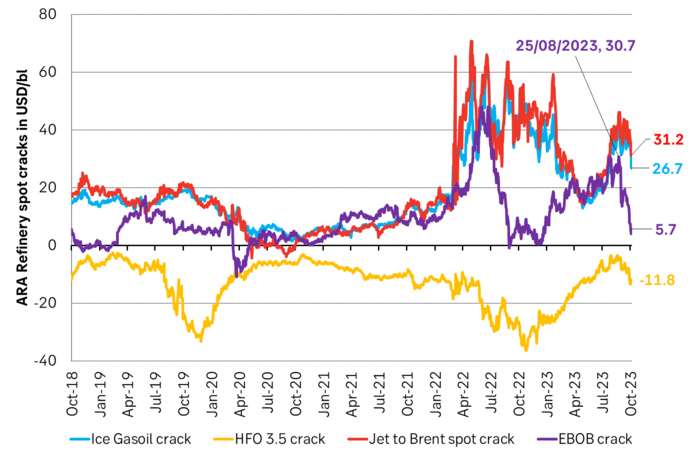
A key bullish driver for crude oil has been the stellar overall refining margins. This has give refineries incentive to buy as much crude as they could and convert it to oil products which consumers could consume. Bullish for crude oil demand. A part of this bullishness has dissipated with the collapse of the gasoline crack. The diesel and jet fuel cracks are however still unusually strong at USD 26/b and USD 31/b vs. seasonal norms of around USD 16/b. Strong mid-dist cracks and still low inventories of middle distillates ahead of the winter will induce refineries to keep processing crude and churn out oil products. As such we should expect US gasoline stocks to continue higher. Gasoline cracks could thus drop yet lower from an already very low level.
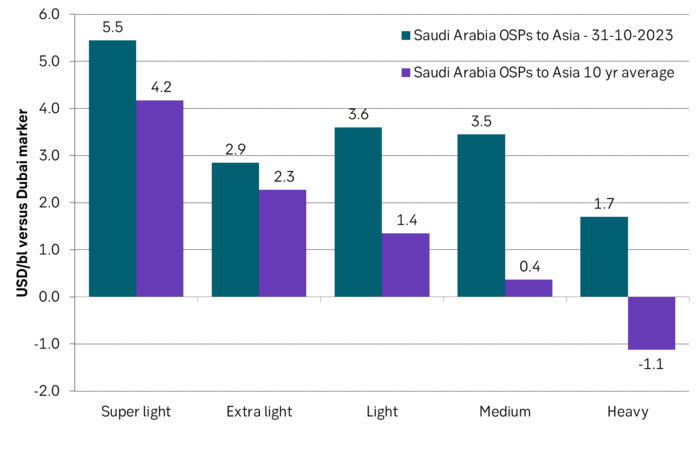
But amid all this bearishness we still have OPEC+. We still have Saudi/Russia. And they are holding a strong and steady course. They are extending existing cuts and export reductions to the end of the year. They haven’t wavered for a second. Backing up this picture of steadfastness is the fact that Saudi Arabia has lifted its Official Selling Prices (OSPs) for November. By USD 0.5/b to USD 3.4/b for its Extra Light grade to Asia vs. a 10yr average of USD 2.3/b. And to Europe it has lifted it to USD 7.2/b which is the highest since 2002. These are reference prices vs. the Dubai marker. With this Saudi Arabia is saying to the market: ”You are free to buy our crude, but it will cost you”. It is a way of making its supply less available to the market. Making it more expensive.
Yes, Brent crude can of course sell off further and test the USD 80/b line for a little while. But Saudi/Russia are holding a steady course and USD 85/b is a great price. It should be acceptable for a shaky global economy as well as for Saudi/Russia for the time being.
The December Brent crude oil contract has fallen like a rock since its intraday high of USD 95.35/b on 28 Sep. Interest rates ”high for longer” has created deep concerns for oil demand going forward.
US commercial crude and product stocks are converging to the 2015-19 average and thus easing the bullishness in the market.
US gasoline stocks were up 6.5 m b last week and are now above the 2015-19 average. They could rise yet higher as implied demand is very weak and refineries keeps producing more gasoline because they are trying to satisfy the market’s craving for middle distillates where stocks are still low.
As a result the ARA gasoline crack has crashed to less than USD 6/b and could fall further.
But Saudi Arabia is holding a strong and steady course. It keeps its production at 9 m b/d vs. a normal of 10 m b/d to the end of the year. And to back it up it has lifted its official selling prices further to Asia and to the highest since 2002 to Europe (Extra Light).
Rebounding along with most markets. But concerns over solidity of Gaza peace may also contribute. Brent crude fell 0.8% yesterday to $61.91/b and its lowest close since May this year. This morning it is bouncing up 0.9% to $62.5/b along with a softer USD amid positive sentiment with both equities and industrial metals moving higher. Concerns that the peace in Gaza may be less solid than what one might hope for also yields some support to Brent. Bets on tech stocks are rebounding, defying fears of trade war. Money moving back into markets. Gold continues upwards its strong trend and a softer dollar helps it higher today as well.

US crude & products probably rose 5.6 mb last week (API) versus a normal seasonal decline of 2.4 mb. The US API last night partial and thus indicative data for US oil inventories. Their data indicates that US crude stocks rose 7.4 mb last week, gasoline stocks rose 3.0 mb while Distillate stocks fell 4.8 mb. Altogether an increase in commercial crude and product stocks of 5.6 mb. Commercial US crude and product stocks normally decline by 2.4 mb this time of year. So seasonally adjusted the US inventories rose 8 mb last week according to the indicative numbers by the API. That is a lot. Also, the counter seasonal trend of rising stocks versus normally declining stocks this time of year looks on a solid pace of continuation. If the API is correct then total US crude and product stocks would stand 41 mb higher than one year ago and 6 mb higher than the 2015-19 average. And if we combine this with our knowledge of a sharp increase in production and exports by OPEC(+) and a large increase in oil at sea, then the current trend in US oil inventories looks set to continue. So higher stocks and lower crude oil prices until OPEC(+) switch to cuts. Actual US oil inventory data today at 18:00 CET.
US commercial crude and product stocks rising to 1293 mb in week 41 if last nights indicative numbers from API are correct.

Crude oil soon coming to a port near you. OPEC has lifted production sharply higher this autumn. At the same time demand for oil in the Middle-East has fallen as we have moved out of summer heat and crude oil burn for power for air-conditioning. The Middle-East oil producers have thus been able to lift exports higher on both accounts. Crude oil and condensates on water has shot up by 177 mb since mid-August. This oil is now on its way to ports around the world. And when they arrive, it will likely help to lift stocks onshore higher. That is probably when we will lose the last bit of front-end backwardation the the crude oil curves. That will help to drive the front-month Brent crude oil price down to the $60/b line and revisit the high $50ies/b. Then the eyes will be all back on OPEC+ when they meet in early November and then again in early December.
Crude oil and condensates at sea have moved straight up by 177 mb since mid-August as OPEC(+) has produced more, consumed less and exported more.

When it starts to move lower it moves rather quickly. Gaza, China, IEA. Brent crude is down 2.1% today to $62/b after having traded as high as $66.58/b last Thursday and above $70/b in late September. The sell-off follows the truce/peace in Gaze, a flareup in US-China trade and yet another bearish oil outlook from the IEA.
A lasting peace in Gaze could drive crude oil at sea to onshore stocks. A lasting peace in Gaza would probably calm down the Houthis and thus allow more normal shipments of crude oil to sail through the Suez Canal, the Red Sea and out through the Bab-el-Mandeb Strait. Crude oil at sea has risen from 48 mb in April to now 91 mb versus a pre-Covid normal of about 50-60 mb. The rise to 91 mb is probably the result of crude sailing around Africa to be shot to pieces by the Houthis. If sailings were to normalize through the Suez Canal, then it could free up some 40 mb in transit at sea moving onshore into stocks.
The US-China trade conflict is of course bearish for demand if it continues.
Bearish IEA yet again. Getting closer to 2026. Credibility rises. We expect OPEC to cut end of 2025. The bearish monthly report from the IEA is what it is, but the closer we get to 2026, the more likely the IEA is of being ball-park right in its outlook. In its monthly report today the IEA estimates that the need for crude oil from OPEC in 2026 will be 25.4 mb/d versus production by the group in September of 29.1 mb/d. The group thus needs to do some serious cutting at the end of 2025 if it wants to keep the market balanced and avoid inventories from skyrocketing. Given that IEA is correct that is. We do however expect OPEC to implement cuts to avoid a large increase in inventories in Q1-26. The group will probably revert to cuts either at its early December meeting when they discuss production for January or in early January when they discuss production for February. The oil price will likely head yet lower until the group reverts to cuts.
Dubai: The Mid-East anchor dragging crude oil lower. Surplus emerging in Mid-East pricing. Crude oil prices held surprisingly strong all through the summer. A sign and a key source of that strength came from the strength in the front-end backwardation of the Dubai crude oil curve. It held out strong from mid-June and all until late September with an average 1-3mth time-spread premium of $1.8/b from mid-June to end of September. The 1-3mth time-spreads for Brent and WTI however were in steady deterioration from late June while their flat prices probably were held up by the strength coming from the Persian Gulf. Then in late September the strength in the Dubai curve suddenly collapsed. Since the start of October it has been weaker than both the Brent and the WTI curves. The Dubai 1-3mth time-spread now only stands at $0.25/b. The Middle East is now exporting more as it is producing more and also consuming less following elevated summer crude burn for power (Aircon) etc.
The only bear-element missing is a sudden and solid rise in OECD stocks. The only thing that is missing for the bear-case everyone have been waiting for is a solid, visible rise in OECD stocks in general and US oil stocks specifically. So watch out for US API indications tomorrow and official US oil inventories on Thursday.
No sign of any kind of fire-sale of oil from Saudi Arabia yet. To what we can see, Saudi Arabia is not at all struggling to sell its oil. It only lowered its Official Selling Prices (OSPs) to Asia marginally for November. A surplus market + Saudi determination to sell its oil to the market would normally lead to a sharp lowering of Saudi OSPs to Asia. Not yet at least and not for November.
The 5yr contract close to fixed at $68/b. Of importance with respect to how far down oil can/will go. When the oil market moves into a surplus then the spot price starts to trade in a large discount to the 5yr contract. Typically $10-15/b below the 5yr contract on average in bear-years (2009, 2015, 2016, 2020). But the 5yr contract is usually pulled lower as well thus making this approach a moving target. But the 5yr contract price has now been rock solidly been pegged to $68/b since 2022. And in the 2022 bull-year (Brent spot average $99/b), the 5yr contract only went to $72/b on average. If we assume that the same goes for the downside and that 2026 is a bear-year then the 5yr goes to $64/b while the spot is trading at a $10-15/b discount to that. That would imply an average spot price next year of $49-54/b. But that is if OPEC doesn’t revert to cuts and instead keeps production flowing. We think OPEC(+) will trim/cut production as needed into 2026 to prevent a huge build-up in global oil stocks and a crash in prices. But for now we are still heading lower. Into the $50ies/b.
Some rebound but not much. Brent crude rebounded 1.5% yesterday to $65.47/b. This morning it is inching 0.2% up to $65.6/b. The lowest close last week was on Thursday at $64.11/b.
The curve structure is almost as week as it was before the weekend. The rebound we now have gotten post the message from OPEC+ over the weekend is to a large degree a rebound along the curve rather than much strengthening at the front-end of the curve. That part of the curve structure is almost as weak as it was last Thursday.
We are still on a weakening path. The message from OPEC+ over the weekend was we are still on a weakening path with rising supply from the group. It is just not as rapidly weakening as was feared ahead of the weekend when a quota hike of 500 kb/d/mth for November was discussed.
The Brent curve is on its way to full contango with Brent dipping into the $50ies/b. Thus the ongoing weakening we have had in the crude curve since the start of the year, and especially since early June, will continue until the Brent crude oil forward curve is in full contango along with visibly rising US and OECD oil inventories. The front-month Brent contract will then flip down towards the $60/b-line and below into the $50ies/b.
At what point will OPEC+ turn to cuts? The big question then becomes: When will OPEC+ turn around to make some cuts? At what (price) point will they choose to stabilize the market? Because for sure they will. Higher oil inventories, some more shedding of drilling rigs in US shale and Brent into the 50ies somewhere is probably where the group will step in.
There is nothing we have seen from the group so far which indicates that they will close their eyes, let the world drown in oil and the oil price crash to $40/b or below.
The message from OPEC+ is also about balance and stability. The world won’t drown in oil in 2026. The message from the group as far as we manage to interpret it is twofold: 1) Taking back market share which requires a lower price for non-OPEC+ to back off a bit, and 2) Oil market stability and balance. It is not just about 1. Thus fretting about how we are all going to drown in oil in 2026 is totally off the mark by just focusing on point 1.
When to buy cal 2026? Before Christmas when Brent hits $55/b and before OPEC+ holds its last meeting of the year which is likely to be in early December.
Brent crude oil prices have rebounded a bit along the forward curve. Not much strengthening in the structure of the curve. The front-end backwardation is not much stronger today than on its weakest level so far this year which was on Thursday last week.

The front-end backwardation fell to its weakest level so far this year on Thursday last week. A slight pickup yesterday and today, but still very close to the weakest year to date. More oil from OPEC+ in the coming months and softer demand and rising inventories. We are heading for yet softer levels.


Vad guldets uppgång egentligen betyder för världen

Spotpriset på guld över 4300 USD och silver över 54 USD
Crude oil soon coming to a port near you

Guld och silver stiger hela tiden mot nya höjder
The Mid-East anchor dragging crude oil lower

OPEC+ missar produktionsmål, stöder oljepriserna

Ett samtal om guld, olja, fjärrvärme och förnybar energi

Goldman Sachs höjer prognosen för guld, tror priset når 4900 USD
Guld nära 4000 USD och silver 50 USD, därför kan de fortsätta stiga
Are Ukraine’s attacks on Russian energy infrastructure working?
-
 Nyheter3 veckor sedan
OPEC+ missar produktionsmål, stöder oljepriserna
-
 Nyheter4 veckor sedan
Ett samtal om guld, olja, fjärrvärme och förnybar energi
-
 Nyheter2 veckor sedan
Goldman Sachs höjer prognosen för guld, tror priset når 4900 USD
-
 Nyheter2 veckor sedan
Guld nära 4000 USD och silver 50 USD, därför kan de fortsätta stiga
-
Analys3 veckor sedan
Are Ukraine’s attacks on Russian energy infrastructure working?
-

 Nyheter2 veckor sedan
Blykalla och amerikanska Oklo inleder ett samarbete
-

 Nyheter4 veckor sedan
Guldpriset uppe på nya höjder, nu 3750 USD
-
Nyheter2 veckor sedan
Ett samtal om guld, olja, koppar och stål