

Analys
Natural gas – A Glimpse into Supply, Demand, and Prices


Supply: Recent weather patterns across Europe have been milder than usual, leading to a delayed onset of the heating season. The weather forecast for the next two weeks predicts a continuation of this trend. As a result, EU TTF spot prices have decreased, leading to a reduced volume of LNG imports to Europe in September and early October. Current imports stand at about 3.3 TWh/day, down from 4.0 TWh/day at this time last year, and significantly lower than the 6.0 TWh/day at the beginning of summer 2023.
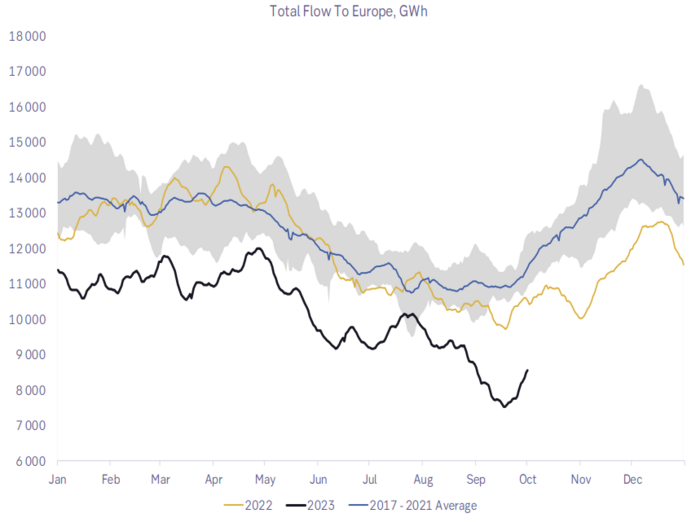
Although peak maintenance on the Norwegian Continental Shelf (NCS) concluded in mid-September, it is scheduled to continue for another month. Despite this, Norwegian natural gas exports to Europe are encouraging, currently at 2.6 TWh/day, though still below the historical average of 3.4 TWh/day. Meanwhile, Russian supplies have increased marginally from 0.6 TWh/day in mid-summer to 0.85 TWh/day currently, yet they remain 2.65 TWh/day below the historical average. Overall, Europe’s current supply is roughly 8.65 TWh/day, clearly lower than the historical average of 11 TWh/day for this period.
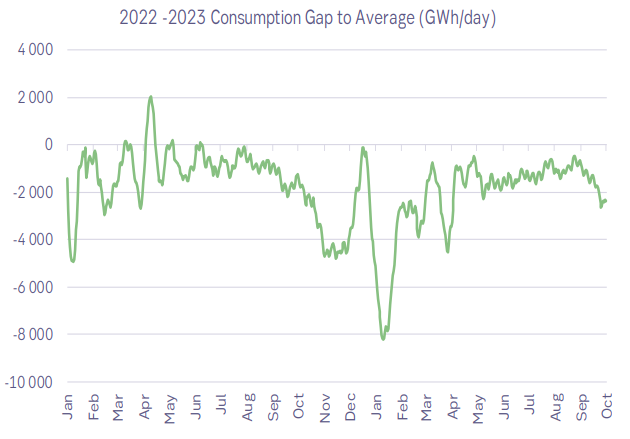
Demand: Last year witnessed a significant decrease in European natural gas demand, which has persisted longer than anticipated. Present consumption rates are slightly lower than last year at 7.5 TWh/day and are 2.5 TWh/day below the historical norm. Current consumption patterns resemble those typically seen in August—a month characterized by European holidays and peak maintenance on the continent’s natural gas infrastructure. The prevailing mild weather is likely to further reduce consumption in the coming weeks. Moreover, industrial gas consumption among the EU’s major consumers (DE, FR, IT, BE, UK, & NL) has remained consistent with October 2022 levels, at 1.9 TWh/day, which is 0.6 TWh/day below historical averages.
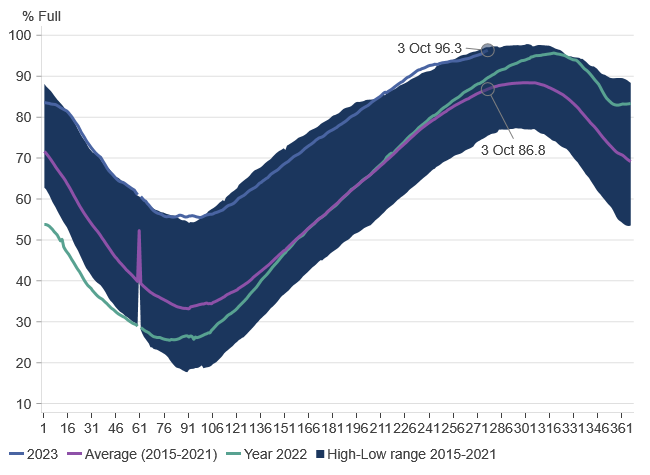
Inventories: EU natural gas storage levels are nearing capacity, with current levels at 96.3%, 9.5% higher than the five-year average. This excess has contributed to the decline in spot prices. With storage nearly full, some stored volumes must be sold at discounted rates to accommodate incoming LNG shipments. However, longer-term prices for the upcoming months and winter 2023/24 remain relatively stable. Although concerns about potential shortages for the upcoming winter are lessening, end-of-April 2023 inventory levels will influence the market for the following seasons.
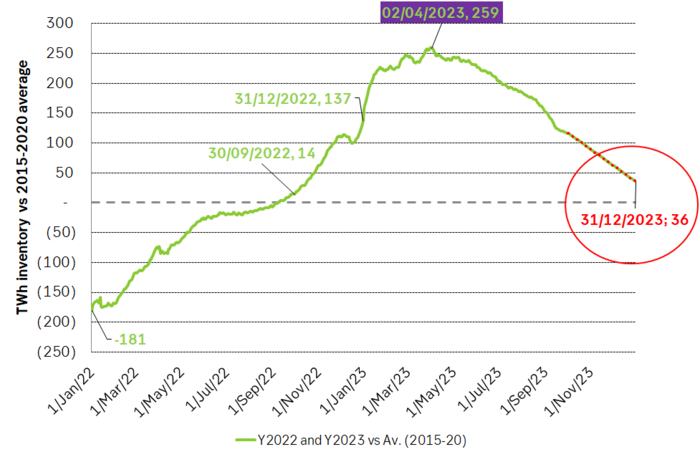
Inventory Outlook: Given the ongoing demand reduction, inventories are expected to remain robust in the short term. However, as the end of the year approaches, projections indicate a convergence towards a more ”normal” inventory level. This means that by year-end, inventories will be 36 TWh above typical levels, a significant reduction from the 259 TWh surplus in early April 2023. Presently, the surplus stands at 116.8 TWh. The trend suggests that inventory levels will approach historical norms, resulting in a tighter EU natural gas market as peak winter approaches.
Price Dynamics: Europe’s mild start to the heating season has proven beneficial, especially during a time of peak maintenance at the NCS and potential risks of decreased global LNG supplies (Australian LNG). The high current inventory levels have significantly minimized the risk of natural gas shortages for the upcoming winter. However, as the heating season progresses, the EU inventory drawdown will be significant.
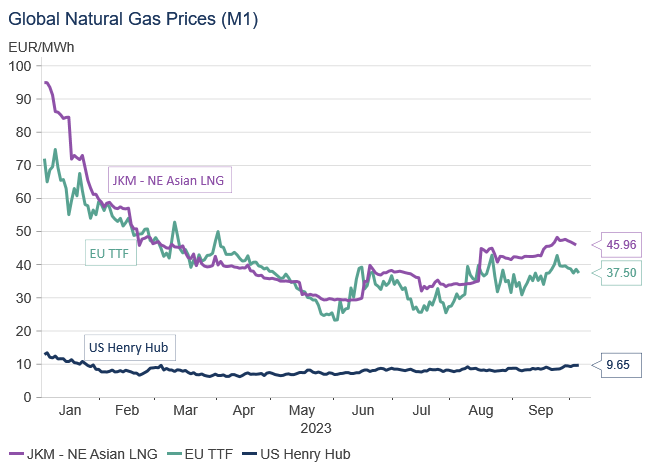
Current price dynamics reveal that the EU TTF forwards (M+1 and winter 2023/24) have declined “too far” compared to the Japanese LNG price. LNG is, and will continue to be, the marginal supplier of natural gas to Europe.
In 2022, the EU witnessed unprecedented levels of LNG imports. To realize this, the EU natural gas price consistently traded at a premium — averaging EUR 15.6/MWh over the front-month Japanese LNG price throughout the year. By the second half of 2022, this premium escalated to an average of EUR 30/MWh. However, the tables have turned: currently, the EU price is at a discount of EUR 8/MWh to the Japanese LNG price for November (M+1) and EUR 5.5/MWh for Q124.
We foresee this trend as short-lived. We believe that, as winter approaches, the EU TTF natural gas price will not only match but potentially exceed the Japanese LNG price by a premium of EUR 5-10/MWh. In our view, the current EU TTF natural gas forwards are undervalued relative to the Japanese LNG price and will likely see a correction, ensuring the EU continues its robust LNG imports. Standing by our early September Gas price projection, we anticipate the average TTF spot price for Q4 2023 to be around EUR 55/MWh and the aggregate for 2023 to settle at EUR 45.5/MWh.
Market is starting to take US/Iran headlines with a pinch of salt. Brent crude rose $2.8/b yesterday to an official close of $112.1/b. But after that it traded as low as $108.05/b before ending late night at around $109.7/b. Through the day it traded in a range of $106.87 – 112.72/b amid a flurry of news or rumors from Iran and the US. ”US temporary sanctions during negotiations” (falls alarm). ”We will bomb Iran” (not anyhow),… etc. While the market is still fluctuating to this kind of news flow, it is starting to take such headlines with a pinch of salt.

We’ll see. Maybe, maybe not. The Brent M1 contract is trading at $110.2/b this morning which very close to the average ticks through yesterday of $110.4/b.
Trump with bearish, verbal intervention whenever Brent trades above $110/b it seems. What seems to be a pattern is that Trump states something like ”very good negotiations going on with Iran”, ”New leaders in Iran are great,..”, ”Great progress in negotiations,…”, ”Deal in sight,..” etc whenever the Brent M1 contract trades above $110/b. An effort to cool the market. These hot air verbal interventions from Trump used to have a heavy bearish impact on prices, but they now seems to have less and less effect unless they are backed by reality.
As far as we can see there has been no real progress in the negotiations between the US and Iran with both sides still standing by their previous demands.
Iran is getting stronger while the cease fire lasts making a return to war for Trump yet harder. Iran is naturally in constant preparation for a return to war given Trump’s steady threats of bombing Iran again. Iran is naturally doing what ever is possible to prepare for a return to war. And every day the cease fire lasts it is better prepared. This naturally makes it more and more difficult and dangerous for the US to return to warring activity versus Iran as the consequences for energy infrastructure in the Persian Gulf will be more and more severe the longer the cease fire lasts. Israel seems to see it this way as well. That the war is not won and that current frozen state of a cease fire gives Iran opportunity to rebuild military and politically.
Global inventories are drawing down day by day. How much? In the meantime the Strait of Hormuz stays closed. There is varying measures and estimates of how much global inventories are drawing down. Our rough estimate, back of the envelope, is that global inventories are drawing down by at least some 10 mb/d or about 300 mb/d in a balance between loss of supply versus demand destruction. Other estimates we see are a monthly draw of 250-270 mb/d. The IEA only ’measured’ a draw in global observable stocks of 117 mb in April with oil on water rising 53 mb while on shore stocks fell 170 mb. But global stocks are hard to measure with large invisible, unmeasured stocks. As such a back of the envelope approach may be better.
Oil products is what the world is consuming. Oil product prices likely to rise while product stocks fall. Strategic Petroleum Reserves (SPR) are predominantly crude oil. Discharging oil from OECD SPR stocks, a sharp reduction in Chinese crude imports and a reduction in global refinery throughput of 6-7 mb/d has helped to keep crude oil markets satisfactorily supplied. But global inventories are drawing down none the less. And oil products is really what the world is consuming. So if global refinery throughput stays subdued, then demand will eventually have to match the supply of oil products. The likely path forward this summer is a steady draw down in jet fuel, diesel and gasoline. Higher prices for these. Then, if possible, higher refinery throughput and higher usage of crude in response to very profitable refinery margins. And lastly sharper draw in crude stocks and higher prices for these. But some 6 mb/d of oil products used to be exported through the Strait of Hormuz. And it may not be so easy to ramp up refinery activity across the world to compensate. Especially as Ukraine continues to damage Russian refineries as well as Russian crude production and export facilities.
Watch oil product stocks and prices as well as Brent calendar 2027. What to watch for this summer is thus oil product inventories falling and oil product premiums to crude rising. Another measure to watch is the Brent crude 2027 contract as it rises steadily day by day as the Strait of Hormuz stays closed and global oil inventories decline. The latter is close to the highest level since the start of the war and keeps rising.
The Brent M1 contract and the Brent 2027 prices and current price of jet fuel in Europe (ARA). All in USD/b

Our back of the envelope calculation of the global shortage created by the closure of the Strait of Hormuz. Note that 3.5 mb/d of discharge from SPR is also a draw. Note also that ’Forced demand loss’ of 2.5 mb/d is probably temporary and will fall back towards zero as logistics are sorted out leaving ’Price demand loss’ to do the job of balancing the market. Thus a shortfall of at least 9 mb/d created by the closure. More if SPR discharge is included and more if Forced demand loss recedes.

Brent is climbing higher. Front-month is at USD 106.3/bl this morning, close to a weekly high and a USD 9/bl jump from Mondays open. This is the move we flagged as a risk earlier in the week: the market shifting from ”a deal is around the corner” to ”this is going to take longer than we thought”.

Analyst Commodities, SEB
During April, rest-of-year Brent remained remarkably stable around USD 90/bl. A stability which rested on one single assumption: the SoH reopens around 1 May. That assumption is now slowly falling apart.
As we highlighted yesterday: every week of delay beyond 1 May adds (theoretically) ish USD 5/bl to the rest-of-year average, as global inventories draw 100 million barrels per week. i.e., a mid-May reopening implies rest-of-year Brent closer to USD 100/bl, and anything pushing into June or July takes us meaningfully higher.
What’s changed in the last 48 hours:
#1: The US military has formally warned that clearing suspected sea mines from SoH could take up to six months. That is a completely different timescale from what the financial market is pricing. Even a political deal tomorrow does not immediately reopen the strait.
#2: Trump has shifted his tone from urgency to ”strategic patience”. In yesterday’s press conference: ”Don’t rush me… I want a great deal.” The market is reading this as a president no longer feeling pressured by timelines, with the naval blockade running in the background.
#3: So far, the military activity is escalating, not de-escalating. Axios reports Iran is laying more mines in SoH. The US 3rd carrier strike group (USS George H.W. Bush) is arriving with two countermine vessels. Trump yesterday ordered the US Navy to destroy any Iranian boats caught laying mines. While CNN reports that the Pentagon is actively drawing up plans to strike Iranian SoH capabilities and individual Iranian military leaders if the ceasefire collapses. i.e., NOT a attitude consistent with an imminent deal!
Spot crude and product prices eased off the early-April highs on a combination of system rerouting and deal optimism. Both now weakening. Goldman estimates April Gulf output is reduced by 14.5 mbl/d, or 57% of pre-war supply, a number that keeps getting worse the longer this drags on.
Demand-side adaptation is ongoing: S. Korea has cut its Middle East crude dependence from 69% to 56% by pulling more from the Americas and Africa, and Japan is kicking off a second round of SPR releases from 1 May. But SPRs are finite.
Ref. to the negotiations, we should not bet on speed. The current Iranian leadership is dominated by genuine hardliners willing to absorb economic pain and run the clock to extract concessions. That is not a setup for a rapid resolution. US/Israeli media briefings keep framing the delay as ”internal Iranian divisions”, the reality is more complicated and points toward weeks and months, not days.
Our point is that the complexity is large, and higher prices have only just started (given a scenario where the negotiations drag out in time). The market spent April leaning on the USD 90/bl rest-of-year assumption; that case is diminishing by the hour. If ”early May reopening” is replaced by ”June, July or later” over the next week or two, both crude and products have meaningful room to reprice higher from here. There is a high risk being short energy and betting on any immediate political resolution(!).
Down on Friday. Up on Monday. The Brent June crude oil contract traded down 5.1% last week to a close of $90.38/b. It reached a high of $103.87/b last Monday and a low of $86.09/b on Friday as Iran announced that the Strait of Hormuz was fully open for transit. That quickly changed over the weekend as the US upheld its blockade of Iranian oil exports while Iran naturally responded by closing the SoH again. The US blew a hole in the engine room of the Iranian ship TOUSKA and took custody of the ship on Sunday. Brent crude is up 5.6% this morning to $95.4/b.
The cease-fire is expiring tomorrow. The US has said it will send a delegation for a second round of negotiations in Islamabad in Pakistan. But Iran has for now rejected a second round of talks as it views US demands as unrealistic and excessive while the US is also blocking the Strait of Hormuz.
While Brent is up 5% this morning, the financial market is still very optimistic that progress will be made. That talks will continue and that the SoH will fully open by the start of May which is consistent with a rest-of-year average Brent crude oil price of around $90/b with the market now trading that balance at around $88/b.
Financial optimism vs. physical deterioration. We have a divergence where the financial market is trading negotiations, improvements and resolution while at the same time the physical market is deteriorating day by day. Physical oil flows remain constrained by disrupted flows, longer voyage times and elevated freight and insurance costs.
Financial markets are betting that a US/Iranian resolution will save us in time from violent shortages down the road. But every day that the SoH remains closed is bringing us closer to a potentially very painful point of shortages and much higher prices.
The US blockade is also a weapon of leverage against its European and Asian allies. When Iran closed the SoH it held the world economy as a hostage against the US. The US blockade of the SoH is of course blocking Iranian oil exports. But it is also an action of disruption directed towards Europe and Asia. The US has called for the rest of the world to engaged in the war with Iran: ”If you want oil from the Persian Gulf, then go and get it”. A risk is that the US plays brinkmanship with the global oil market directed towards its European and Asian allies and maybe even towards China to force them to engage and take part. Maybe unthinkable. But unthinkable has become the norm with Trump in the White House.


Sommarväder skapar prisrally på elbörsen
Oil product price pain is set to rise as the Strait of Hormuz stays closed into summer

Solkraften pressar elpriserna dagtid

Michel Gubel ger sin syn på oljemarknaden