

Analys
Market doubting demand but Saudi/Russia are holding a steady course


Brent crude has sold off hard since 28 September. Fear for the health of the global economy and thus oil demand going forward is at the heart of the sell-off. Prior to that, a clarifying message from the Saudi Energy Minister, Prince Abdulaziz bin Salman, at a conference in Calgary on 18 September to a large degree also removed the USD 100/b plus scenario. Speculators had also accumulated significant long positions in oil since a low point in late June. And the last in have probably been hurt in the sell-off and tried to get out. Lastly we have the US oil inventories published on Wednesday this week which were very bearish as they rose almost 5 m b vs an normal draw this time of year of around 2 m b. And specifically gasoline stocks which jumped 6.5 m b to above the 2015-19 level with gasoline refining margins crashing as a result. But amid all this we still have Saudi/Russia which are holding a steady course with cuts and export reductions to end of year with Saudi spicing this up with Official Selling Price of its Extra Light crude to Europe at USD 7.2/b (Premium to Dubai crude) for November which is the highest since 2002. So USD 100/b plus is not in the cards. But neither is USD 50-60-70/b as Saudi his holding a steady course. Our bet is Brent crude averaging USD 85/b in Q4-23 in a balance between what Saudi Arabia wants and needs versus what is a sensible and acceptable level for the global economy.
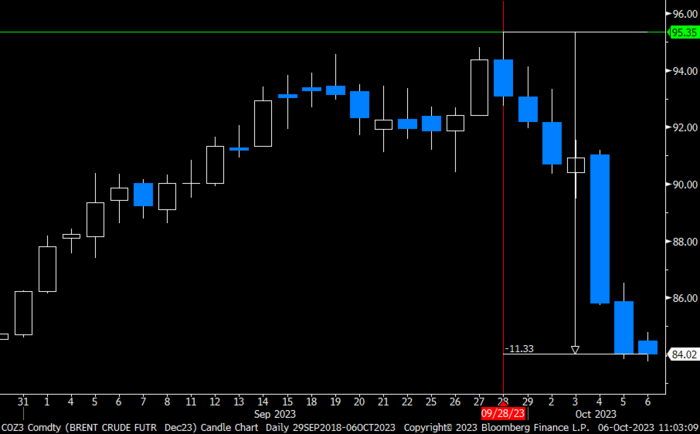
The December Brent crude oil contract has fallen from an intraday high of USD 95.35/b on 28 September to now USD 83.9/b, a loss of USD 11.4/b. At heart of this decline is concerns for the outlook for the global economy and thus oil demand.
The clear and almost unanimous message from central banks across the board towards the end of September was ”interest rates higher for longer”. Add in flows for US government bonds where China and Japan no longer are big buyers (if at all), the US Fed is a net seller of bonds (QT) rather than a buyer (QE) while the US government is selling more and more bonds. This has driven the US 10yr government bond yield higher and higher to a recent peak of 4.8% which is the highest since 2007. With no relief in sight, this ”interest rate pain” is going to hurt the global economy and thus oil demand. This is probably one key reason/trigger for why oil has sold down so hard recently.
An other reason is probably the message to the market which Saudi Arabia’s energy minister, Prince Abdulaziz bin Salman, delivered to the market at a conference in Calgary on 18 September. He made it very clear that the current cuts were not about driving the oil price to the sky, but rather that it was precautionary versus uncertain demand. Further that if demand indeed turned out to be strong then hallelujah, they would produce more. The oil market has probably been a bit confused on this point with some saying that the aim of Saudi cuts was to drive crude oil above USD 100/b. Such kind of views was pushed aside by the Saudi minister. A sustained move above USD 100/b was very unlikely after the minister’s statements.
Speculators added more than 300 million barrels of net long positions late June. These have probably taken money off the table in the recent sell-off and thus contributed to the sharpness in the sell-off.
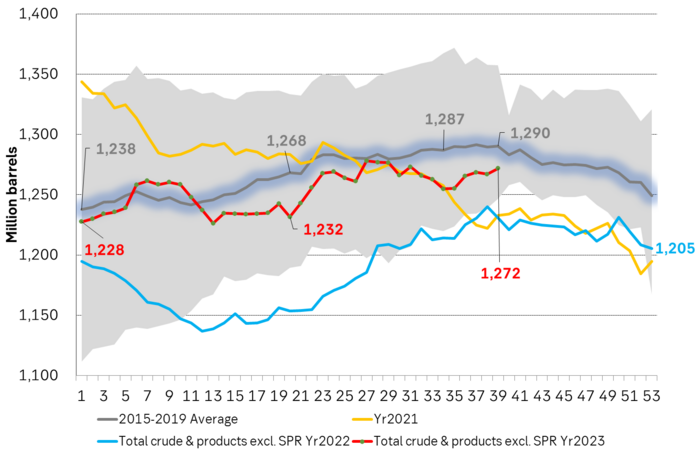
Then we have the US oil inventory data this Wednesday which gave a very bearish message to the market. Rather than a seasonal draw of around 2 m b the total US commercial crude and product stocks rose 4.6 m b. With this the US commercial oil stocks are only about 15 m b below the smoothed 2015-19 seasonal average. Gasoline stocks roes 6.5 m b to a level slightly above the 2015-19 average with implied US gasoline demand falling to the lowest level since 2008. The gasoline refining margin, the crack, has now collapsed to less than USD 6/b while it was more than USD 30/b in late August. US inventories of crude and middle distillates are still significantly below normal. In total almost 50 m b below the 2015-19 level. This is an uncomfortable situation ahead of the winter which keeps the market in a partial bullish grip.
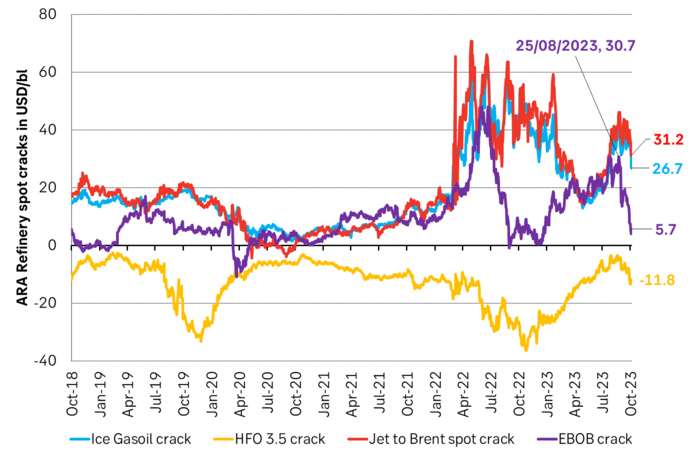
A key bullish driver for crude oil has been the stellar overall refining margins. This has give refineries incentive to buy as much crude as they could and convert it to oil products which consumers could consume. Bullish for crude oil demand. A part of this bullishness has dissipated with the collapse of the gasoline crack. The diesel and jet fuel cracks are however still unusually strong at USD 26/b and USD 31/b vs. seasonal norms of around USD 16/b. Strong mid-dist cracks and still low inventories of middle distillates ahead of the winter will induce refineries to keep processing crude and churn out oil products. As such we should expect US gasoline stocks to continue higher. Gasoline cracks could thus drop yet lower from an already very low level.
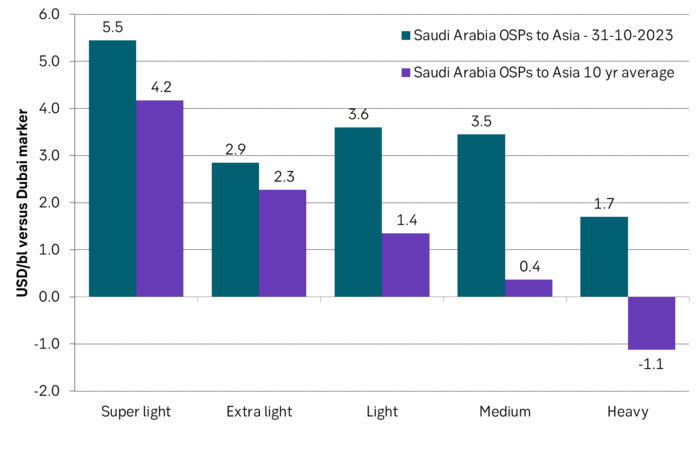
But amid all this bearishness we still have OPEC+. We still have Saudi/Russia. And they are holding a strong and steady course. They are extending existing cuts and export reductions to the end of the year. They haven’t wavered for a second. Backing up this picture of steadfastness is the fact that Saudi Arabia has lifted its Official Selling Prices (OSPs) for November. By USD 0.5/b to USD 3.4/b for its Extra Light grade to Asia vs. a 10yr average of USD 2.3/b. And to Europe it has lifted it to USD 7.2/b which is the highest since 2002. These are reference prices vs. the Dubai marker. With this Saudi Arabia is saying to the market: ”You are free to buy our crude, but it will cost you”. It is a way of making its supply less available to the market. Making it more expensive.
Yes, Brent crude can of course sell off further and test the USD 80/b line for a little while. But Saudi/Russia are holding a steady course and USD 85/b is a great price. It should be acceptable for a shaky global economy as well as for Saudi/Russia for the time being.
The December Brent crude oil contract has fallen like a rock since its intraday high of USD 95.35/b on 28 Sep. Interest rates ”high for longer” has created deep concerns for oil demand going forward.
US commercial crude and product stocks are converging to the 2015-19 average and thus easing the bullishness in the market.
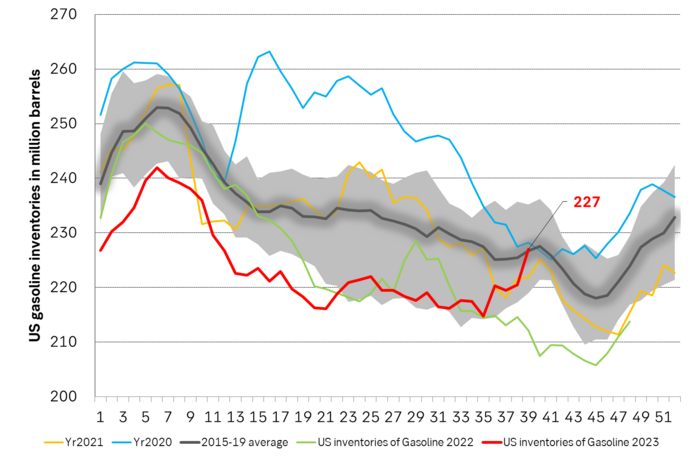
US gasoline stocks were up 6.5 m b last week and are now above the 2015-19 average. They could rise yet higher as implied demand is very weak and refineries keeps producing more gasoline because they are trying to satisfy the market’s craving for middle distillates where stocks are still low.
As a result the ARA gasoline crack has crashed to less than USD 6/b and could fall further.
But Saudi Arabia is holding a strong and steady course. It keeps its production at 9 m b/d vs. a normal of 10 m b/d to the end of the year. And to back it up it has lifted its official selling prices further to Asia and to the highest since 2002 to Europe (Extra Light).
Market is starting to take US/Iran headlines with a pinch of salt. Brent crude rose $2.8/b yesterday to an official close of $112.1/b. But after that it traded as low as $108.05/b before ending late night at around $109.7/b. Through the day it traded in a range of $106.87 – 112.72/b amid a flurry of news or rumors from Iran and the US. ”US temporary sanctions during negotiations” (falls alarm). ”We will bomb Iran” (not anyhow),… etc. While the market is still fluctuating to this kind of news flow, it is starting to take such headlines with a pinch of salt.

We’ll see. Maybe, maybe not. The Brent M1 contract is trading at $110.2/b this morning which very close to the average ticks through yesterday of $110.4/b.
Trump with bearish, verbal intervention whenever Brent trades above $110/b it seems. What seems to be a pattern is that Trump states something like ”very good negotiations going on with Iran”, ”New leaders in Iran are great,..”, ”Great progress in negotiations,…”, ”Deal in sight,..” etc whenever the Brent M1 contract trades above $110/b. An effort to cool the market. These hot air verbal interventions from Trump used to have a heavy bearish impact on prices, but they now seems to have less and less effect unless they are backed by reality.
As far as we can see there has been no real progress in the negotiations between the US and Iran with both sides still standing by their previous demands.
Iran is getting stronger while the cease fire lasts making a return to war for Trump yet harder. Iran is naturally in constant preparation for a return to war given Trump’s steady threats of bombing Iran again. Iran is naturally doing what ever is possible to prepare for a return to war. And every day the cease fire lasts it is better prepared. This naturally makes it more and more difficult and dangerous for the US to return to warring activity versus Iran as the consequences for energy infrastructure in the Persian Gulf will be more and more severe the longer the cease fire lasts. Israel seems to see it this way as well. That the war is not won and that current frozen state of a cease fire gives Iran opportunity to rebuild military and politically.
Global inventories are drawing down day by day. How much? In the meantime the Strait of Hormuz stays closed. There is varying measures and estimates of how much global inventories are drawing down. Our rough estimate, back of the envelope, is that global inventories are drawing down by at least some 10 mb/d or about 300 mb/d in a balance between loss of supply versus demand destruction. Other estimates we see are a monthly draw of 250-270 mb/d. The IEA only ’measured’ a draw in global observable stocks of 117 mb in April with oil on water rising 53 mb while on shore stocks fell 170 mb. But global stocks are hard to measure with large invisible, unmeasured stocks. As such a back of the envelope approach may be better.
Oil products is what the world is consuming. Oil product prices likely to rise while product stocks fall. Strategic Petroleum Reserves (SPR) are predominantly crude oil. Discharging oil from OECD SPR stocks, a sharp reduction in Chinese crude imports and a reduction in global refinery throughput of 6-7 mb/d has helped to keep crude oil markets satisfactorily supplied. But global inventories are drawing down none the less. And oil products is really what the world is consuming. So if global refinery throughput stays subdued, then demand will eventually have to match the supply of oil products. The likely path forward this summer is a steady draw down in jet fuel, diesel and gasoline. Higher prices for these. Then, if possible, higher refinery throughput and higher usage of crude in response to very profitable refinery margins. And lastly sharper draw in crude stocks and higher prices for these. But some 6 mb/d of oil products used to be exported through the Strait of Hormuz. And it may not be so easy to ramp up refinery activity across the world to compensate. Especially as Ukraine continues to damage Russian refineries as well as Russian crude production and export facilities.
Watch oil product stocks and prices as well as Brent calendar 2027. What to watch for this summer is thus oil product inventories falling and oil product premiums to crude rising. Another measure to watch is the Brent crude 2027 contract as it rises steadily day by day as the Strait of Hormuz stays closed and global oil inventories decline. The latter is close to the highest level since the start of the war and keeps rising.
The Brent M1 contract and the Brent 2027 prices and current price of jet fuel in Europe (ARA). All in USD/b

Our back of the envelope calculation of the global shortage created by the closure of the Strait of Hormuz. Note that 3.5 mb/d of discharge from SPR is also a draw. Note also that ’Forced demand loss’ of 2.5 mb/d is probably temporary and will fall back towards zero as logistics are sorted out leaving ’Price demand loss’ to do the job of balancing the market. Thus a shortfall of at least 9 mb/d created by the closure. More if SPR discharge is included and more if Forced demand loss recedes.

Brent is climbing higher. Front-month is at USD 106.3/bl this morning, close to a weekly high and a USD 9/bl jump from Mondays open. This is the move we flagged as a risk earlier in the week: the market shifting from ”a deal is around the corner” to ”this is going to take longer than we thought”.

Analyst Commodities, SEB
During April, rest-of-year Brent remained remarkably stable around USD 90/bl. A stability which rested on one single assumption: the SoH reopens around 1 May. That assumption is now slowly falling apart.
As we highlighted yesterday: every week of delay beyond 1 May adds (theoretically) ish USD 5/bl to the rest-of-year average, as global inventories draw 100 million barrels per week. i.e., a mid-May reopening implies rest-of-year Brent closer to USD 100/bl, and anything pushing into June or July takes us meaningfully higher.
What’s changed in the last 48 hours:
#1: The US military has formally warned that clearing suspected sea mines from SoH could take up to six months. That is a completely different timescale from what the financial market is pricing. Even a political deal tomorrow does not immediately reopen the strait.
#2: Trump has shifted his tone from urgency to ”strategic patience”. In yesterday’s press conference: ”Don’t rush me… I want a great deal.” The market is reading this as a president no longer feeling pressured by timelines, with the naval blockade running in the background.
#3: So far, the military activity is escalating, not de-escalating. Axios reports Iran is laying more mines in SoH. The US 3rd carrier strike group (USS George H.W. Bush) is arriving with two countermine vessels. Trump yesterday ordered the US Navy to destroy any Iranian boats caught laying mines. While CNN reports that the Pentagon is actively drawing up plans to strike Iranian SoH capabilities and individual Iranian military leaders if the ceasefire collapses. i.e., NOT a attitude consistent with an imminent deal!
Spot crude and product prices eased off the early-April highs on a combination of system rerouting and deal optimism. Both now weakening. Goldman estimates April Gulf output is reduced by 14.5 mbl/d, or 57% of pre-war supply, a number that keeps getting worse the longer this drags on.
Demand-side adaptation is ongoing: S. Korea has cut its Middle East crude dependence from 69% to 56% by pulling more from the Americas and Africa, and Japan is kicking off a second round of SPR releases from 1 May. But SPRs are finite.
Ref. to the negotiations, we should not bet on speed. The current Iranian leadership is dominated by genuine hardliners willing to absorb economic pain and run the clock to extract concessions. That is not a setup for a rapid resolution. US/Israeli media briefings keep framing the delay as ”internal Iranian divisions”, the reality is more complicated and points toward weeks and months, not days.
Our point is that the complexity is large, and higher prices have only just started (given a scenario where the negotiations drag out in time). The market spent April leaning on the USD 90/bl rest-of-year assumption; that case is diminishing by the hour. If ”early May reopening” is replaced by ”June, July or later” over the next week or two, both crude and products have meaningful room to reprice higher from here. There is a high risk being short energy and betting on any immediate political resolution(!).
Down on Friday. Up on Monday. The Brent June crude oil contract traded down 5.1% last week to a close of $90.38/b. It reached a high of $103.87/b last Monday and a low of $86.09/b on Friday as Iran announced that the Strait of Hormuz was fully open for transit. That quickly changed over the weekend as the US upheld its blockade of Iranian oil exports while Iran naturally responded by closing the SoH again. The US blew a hole in the engine room of the Iranian ship TOUSKA and took custody of the ship on Sunday. Brent crude is up 5.6% this morning to $95.4/b.
The cease-fire is expiring tomorrow. The US has said it will send a delegation for a second round of negotiations in Islamabad in Pakistan. But Iran has for now rejected a second round of talks as it views US demands as unrealistic and excessive while the US is also blocking the Strait of Hormuz.
While Brent is up 5% this morning, the financial market is still very optimistic that progress will be made. That talks will continue and that the SoH will fully open by the start of May which is consistent with a rest-of-year average Brent crude oil price of around $90/b with the market now trading that balance at around $88/b.
Financial optimism vs. physical deterioration. We have a divergence where the financial market is trading negotiations, improvements and resolution while at the same time the physical market is deteriorating day by day. Physical oil flows remain constrained by disrupted flows, longer voyage times and elevated freight and insurance costs.
Financial markets are betting that a US/Iranian resolution will save us in time from violent shortages down the road. But every day that the SoH remains closed is bringing us closer to a potentially very painful point of shortages and much higher prices.
The US blockade is also a weapon of leverage against its European and Asian allies. When Iran closed the SoH it held the world economy as a hostage against the US. The US blockade of the SoH is of course blocking Iranian oil exports. But it is also an action of disruption directed towards Europe and Asia. The US has called for the rest of the world to engaged in the war with Iran: ”If you want oil from the Persian Gulf, then go and get it”. A risk is that the US plays brinkmanship with the global oil market directed towards its European and Asian allies and maybe even towards China to force them to engage and take part. Maybe unthinkable. But unthinkable has become the norm with Trump in the White House.


Sommarväder skapar prisrally på elbörsen
Oil product price pain is set to rise as the Strait of Hormuz stays closed into summer

Solkraften pressar elpriserna dagtid

Michel Gubel ger sin syn på oljemarknaden