

Analys
[If demand] ”comes around as forecast, Hallelujah, we can produce more”

Saudi Arabia’s oil minister, Prince Abdulaziz bin Salman, last week stated at a conference in Calgary: ”I believe it when I see it. When reality comes around as it’s been forecast, Hallelujah, we can produce more” (Reuters, John Kemp). So Saudi Arabia wants to and will produce more once it is confident that there really is demand for additional crude. Saudi Arabia has good reason to be concerned for global oil demand. It is not the only one struggling to predict global demand amid the haze and turmoil in the global oil market following the Russian invasion of Ukraine and sanctions towards Russian crude and product stocks. Add a shaky Chinese housing market and the highest US rates since 2001. Estimates for global oil demand in Q4-23 are ranging from 100.6 m b/d to 104.7 m b/d with many estimates in between. Current crude and mid-dist inventories are low. Supply/demand is balanced to tight and clearly very tight for mid-dists (diesel, jet fuel, gasoil). But amid current speculative bullishness it is important to note that Saudi Arabia can undo the current upwards price journey just as quickly as it created the current bull-market as it drop in production from 10.5 m b/d in April to only 9.0 m b/d since July. Quickly resolving the current mid-dist crisis is beyond the powers of Saudi Arabia. But China could come to the rescue if increased oil product export quotas as it holds spare refining capacity.

The oil market is well aware that the main reasons for why oil has rallied 25% over the past months is reduced production by Saudi Arabia and Russia, global oil demand holding up better than feared together with still declining US shale oil activity. US oil drilling rig count fell by 8 rigs last week to 507 rigs which is the lowest since Feb 2022.
The big question is how strong is global oil demand and how will it hold up or even maybe increase in the coming quarters? And here the spread of estimates are still all over the place. For Q4-23 we have the following range of estimates for global oil demand in m b/d: 100.6; 101.8; 103.1; 103.2 and 104.7 from main oil market research providers. This wide spread of estimates is mindbogglingly and head-scratching both for analysts and for oil producers. It leads to a wide spread in estimates for Call-on-OPEC. Some say the current market is in a 2-3 m b/d deficit while others calculate that the global oil market today is nicely balanced.
The sanctions towards Russian crude and oil product exports with a ban on imports to the EU and UK has led to a large reshuffling of the global oil market flows which again has created a haze through which it is hard to gauge the correct state of the global oil market.
We have previously argued that there may be a significant amount of ”pent-up-demand” following the Covid-years with potential for global oil demand to surprise on the upside versus most demand forecasts. But there are also good reasons to be cautious to demand given Chinese property market woes and the highest US interest rates since 2001!
The uncertainty in global oil demand is clearly at the heart of Saudi Arabia’s production cuts since April this year. Saudi Arabia’s Energy Minister, Prince Abulaziz bin Salman, last week stated at a conference in Calgary: ”I believe it when I see it. When reality comes around as it’s been forecast, Hallelujah, we can produce more” (Reuters, John Kemp).
So if it turns out that demand is indeed stronger than Saudi Arabia fears, then we should see increased production from Saudi Arabia. Saudi could of course then argue that yes, it is stronger than expected right now, but tomorrow may be worse. Also, the continued decline in US oil drilling rig count is a home-free card for continued low production from Saudi Arabia.
Both crude stocks and mid-dist stocks (diesel, jet fuel, gasoil) are still significantly below normal and the global oil market is somewhere between balanced, mild deficit or large deficit (-2-3 m b/d). The global oil market is as such stressed due to low inventories and potentially in either mild or large deficit on top. The latter though can be undone by higher production from Saudi Arabia whenever it chooses to do so.
What is again getting center stage are the low mid-dist stocks ahead of winter. The war in Ukraine and the sanctions towards Russian crude and product stocks created chaos in the global oil product market. Refining margins went crazy last year. But they are still crazy. The global refining system got reduced maintenance in 2020 and 2021 due to Covid-19 and low staffing. Following decades of mediocre margins and losses, a lot of older refineries finally decided to close down for good during Covid as refining margins collapsed as the world stopped driving and flying. The global refining capacity contracted in 2021 for the first time in 30 years as a result. Then in 2022 refining margins exploded along with reviving global oil demand and the invasion of Ukraine. Refineries globally then ran as hard as they could, eager to make money, and reduced maintenance to a minimum for a third year in a row. Many refineries are now prone for technical failures following three years of low maintenance. This is part of the reason why mid-dist stocks struggle to rebuild. The refineries which can run however are running as hard as they can. With current refining margins they are pure money machines.
Amid all of this, Russia last week imposed an export ban for gasoline and diesel products to support domestic consumers with lower oil product prices. Russia normally exports 1.1 m b/d of diesel products and 0.2 m b/d of gasoline. The message is that it is temporary and this is also what the market expects. Russia has little oil product export storage capacity. The export ban will likely fill these up within a couple of weeks. Russia will then either have to close down refineries or restart its oil product exports.
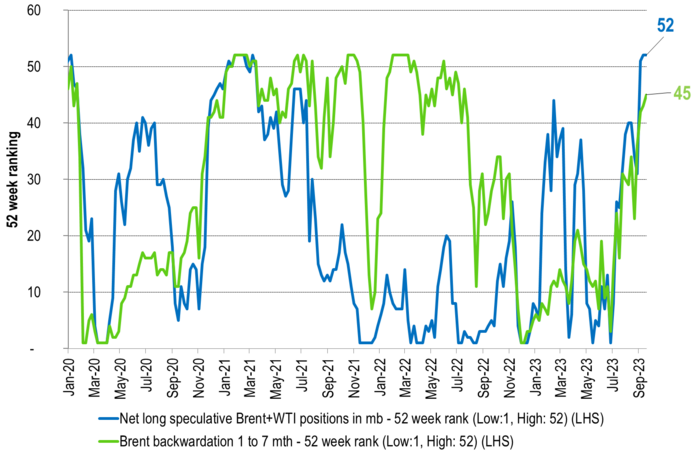
The oil market continues in a very bullish state with stress both in crude and mid-dists. Speculators continues to roll into the market with net long positions in Brent crude and WTI increasing by 29 m b over the week to last Tuesday. Since the end of June it has increased from 330 m b to now 637 m b. Net-long speculative positions are now at the highest level in 52 weeks.
The market didn’t believe Saudi Arabia this spring when it warned speculators about being too bearish on oil and that they would burn their fingers. And so they did. After having held production at 9 m b/d since July, the market finally believes in Saudi Arabia. But the market still doesn’t quite listen when Saudi says that its current production is not about driving the oil price to the sky (and beyond). It’s about concerns for global oil demand amid many macro economic challenges. It’s about being preemptive versus weakening demand. The current oil rally can thus be undone by Saudi Arabia just as it was created by Saudi Arabia. The current refinery stress is however beyond the powers of Saudi Arabia. But China could come to the rescue as it holds spare refining capacity. It could increase export quotas for oil products and thus alleviate global mid-dist shortages. The first round effect of this would however be yet stronger Chinese crude oil imports.
Brent crude and ARA diesel refining premiums/margins. It is easy to see when Russia invaded Ukraine. Diesel margins then exploded. The market is not taking the latest Russian export ban on diesel and gasoline too seriously. Not very big moves last week.
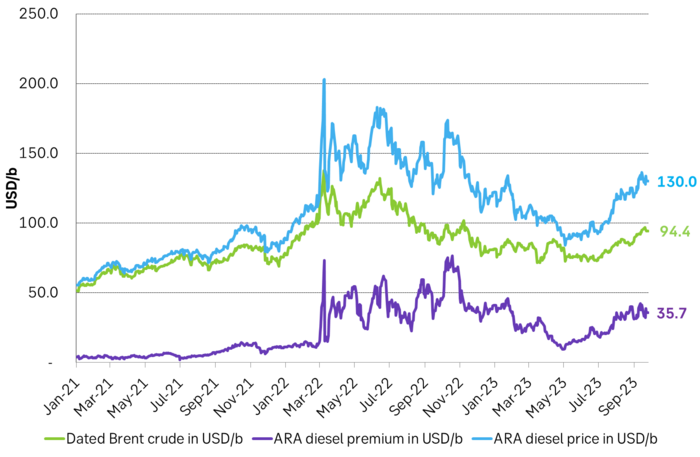
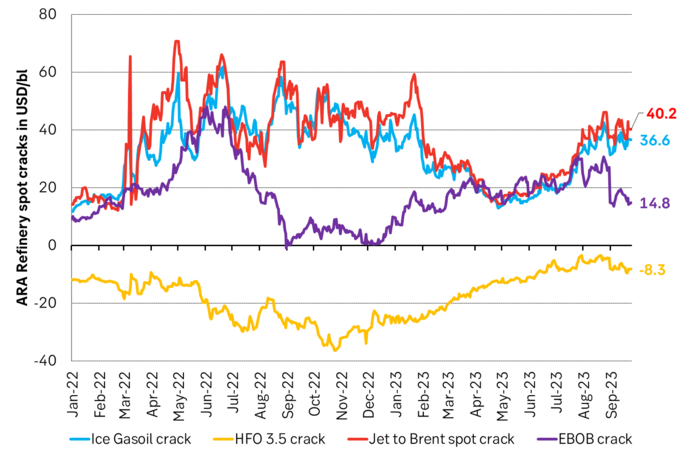
ARA mid-dist margins still exceptionally high at USD 35-40/b versus a more normal USD 12-15/b. We are now heading into the heating season, but the summer driving season is fading and so are gasoline margins.
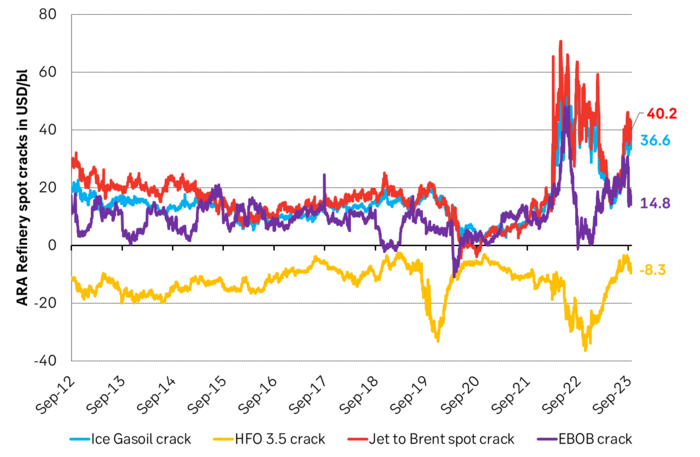
ARA mid-dist margins still exceptionally high at USD 35-40/b versus a more normal USD 12-15/b. Here same graph as above but with longer perspective to show how extreme the situation is.
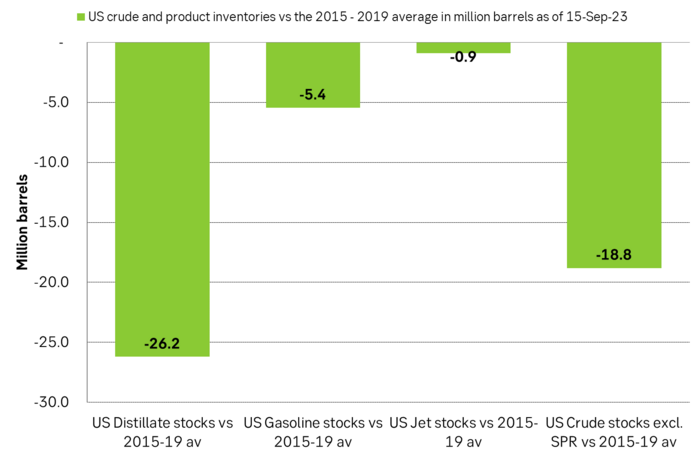
US crude and product stocks vs. the 2015-19 average. Very low mid-dist stocks.
Speculators are rolling into long positions. Now highest net long spec in 52 weeks.
Selling down on a ”deal”. Brent crude fell 6.2% last week with accelerated weakness towards the end of the week. Close of the week at $87.33/b and low of the week (and on Friday) of $85.8/b. Brent is falling another 4% this morning to $83.7/b on confirmation by Iran that a MoU text has been reached and that it will be signed on Friday this week.

So what is this ”deal” worth? Talk on the desk here this morning is that it is much like ”putting lipstick on a pig” where Trump has to sell this at home as a victory where ”the SoH has reopened”, the nuclear issue will be ironed out over the coming 60 days (or maybe 600 days?) and US consumers are getting a lower gasoline price and maybe US republicans survives the midterm elections.
The importance for Iran is that it emerges as the defacto winner of this war in the eyes of the non-US public world. That Iran now onwards is the ”ruler of the SoH” (combo of geography and new weapons systems like drones) or more softer: ”the guarantor of safe passage through the SoH”.
Iran doesn’t need nuclear weapons any more. Nuclear deterrence doesn’t work any more. Ukraine has made many attacks deep into Russia without being nuked in return. Plenty of Iranian ballistic rockets blasts over Israel but Iran wasn’t nuked in return.
There is no trust between the US and Iran. We don’t know all the details yet of the MoU. But what we do know is that there is no trust between the US and Iran what so ever. This is probably more like a descriptive text on how they can cooperate in a way where both sides keeps tactical leverage. Neither side makes irreversible concessions. Violations can be punished quickly. Cooperation produces immediate benefits.
This is a fragile structure. It can easily break down. There may be details which cannot be overcome. To be seen on Friday. The US has to show that it is willing put enough force behind managing and restraining Israel versus Hezbollah in Lebanon. We have seen that Netanyahu hasn’t listened all that much to Trump’s directives and wishes. This could be a major obstacle.
A gradual reopening is tactically preferable for Iran. A tactical leverage for Iran right now is that global oil stocks have been drawn down towards painful and increasingly dangerous levels with increasing risks for oil price spikes in mid-July to August. This together with US midterm elections on 3 November gives tactical leverage to Iran. Iran probably doesn’t want to fully give up on that leverage. A rapid, full reopening where global stocks are able to refill over the coming 60 days will significantly erode that leverage. If Iran reinstates a closure of the SoH after 60 days (if talks break down again), then the effect won’t be that impactful in terms of prices and the US midterm elections.
So a gradual and partial reopening where global markets gets the oil they need while they are unable to rebuild stocks could be a practical middle way for both parties. Trump can sell it as ”the SoH has reopened” and get affordable gasoline for US consumers. Iran can sell it as ”the SoH has fully reopened, but there is some friction” so flow is only 60-80% of normal.
Not much real demand destruction below $100/b. What we do know is that there is not much real price pain demand destruction for oil globally at an oil price below $100/b. A lot of demand-shock destruction. Fear. But demand should now come roaring back towards normal with fear for exceptionally high prices now is rapidly receding.
Sudden China demand destruction due to EVs? Bullocks. EV share of total Chinese carpool now around 13%. Share of new sales of EVs has reached 50%. This is a very gradual process. It doesn’t make oil demand fall like a rock over night. When EV new sales share reaches 100%, then the gasoline car pool will contract by some 5-10% per year. But that is only gasoline. Sudden reduction in Chinese oil demand is more about shock and risk.
Chinese crude oil imports will come roaring back. At what price? Today’s ”neutral” oil price is $70/b. That is the five year price which has steadily traded around the $70/b mark over the past 3-4 years. With still a risky picture one would think that China and the rest of the world will be big buyers of oil in the range of $70-85/b.
Global demand will likely snap back towards normal, forecasted demand and growth at such prices.
Physical reopening is a gradual process. The physical and practical reopening of the SoH will likely be gradual rather than sudden. And that probably suites Iran tactically as well.
Brent M1 price versus the Brent 5-yr (today’s ”normal” price)

Market is starting to take US/Iran headlines with a pinch of salt. Brent crude rose $2.8/b yesterday to an official close of $112.1/b. But after that it traded as low as $108.05/b before ending late night at around $109.7/b. Through the day it traded in a range of $106.87 – 112.72/b amid a flurry of news or rumors from Iran and the US. ”US temporary sanctions during negotiations” (falls alarm). ”We will bomb Iran” (not anyhow),… etc. While the market is still fluctuating to this kind of news flow, it is starting to take such headlines with a pinch of salt.
We’ll see. Maybe, maybe not. The Brent M1 contract is trading at $110.2/b this morning which very close to the average ticks through yesterday of $110.4/b.
Trump with bearish, verbal intervention whenever Brent trades above $110/b it seems. What seems to be a pattern is that Trump states something like ”very good negotiations going on with Iran”, ”New leaders in Iran are great,..”, ”Great progress in negotiations,…”, ”Deal in sight,..” etc whenever the Brent M1 contract trades above $110/b. An effort to cool the market. These hot air verbal interventions from Trump used to have a heavy bearish impact on prices, but they now seems to have less and less effect unless they are backed by reality.
As far as we can see there has been no real progress in the negotiations between the US and Iran with both sides still standing by their previous demands.
Iran is getting stronger while the cease fire lasts making a return to war for Trump yet harder. Iran is naturally in constant preparation for a return to war given Trump’s steady threats of bombing Iran again. Iran is naturally doing what ever is possible to prepare for a return to war. And every day the cease fire lasts it is better prepared. This naturally makes it more and more difficult and dangerous for the US to return to warring activity versus Iran as the consequences for energy infrastructure in the Persian Gulf will be more and more severe the longer the cease fire lasts. Israel seems to see it this way as well. That the war is not won and that current frozen state of a cease fire gives Iran opportunity to rebuild military and politically.
Global inventories are drawing down day by day. How much? In the meantime the Strait of Hormuz stays closed. There is varying measures and estimates of how much global inventories are drawing down. Our rough estimate, back of the envelope, is that global inventories are drawing down by at least some 10 mb/d or about 300 mb/d in a balance between loss of supply versus demand destruction. Other estimates we see are a monthly draw of 250-270 mb/d. The IEA only ’measured’ a draw in global observable stocks of 117 mb in April with oil on water rising 53 mb while on shore stocks fell 170 mb. But global stocks are hard to measure with large invisible, unmeasured stocks. As such a back of the envelope approach may be better.
Oil products is what the world is consuming. Oil product prices likely to rise while product stocks fall. Strategic Petroleum Reserves (SPR) are predominantly crude oil. Discharging oil from OECD SPR stocks, a sharp reduction in Chinese crude imports and a reduction in global refinery throughput of 6-7 mb/d has helped to keep crude oil markets satisfactorily supplied. But global inventories are drawing down none the less. And oil products is really what the world is consuming. So if global refinery throughput stays subdued, then demand will eventually have to match the supply of oil products. The likely path forward this summer is a steady draw down in jet fuel, diesel and gasoline. Higher prices for these. Then, if possible, higher refinery throughput and higher usage of crude in response to very profitable refinery margins. And lastly sharper draw in crude stocks and higher prices for these. But some 6 mb/d of oil products used to be exported through the Strait of Hormuz. And it may not be so easy to ramp up refinery activity across the world to compensate. Especially as Ukraine continues to damage Russian refineries as well as Russian crude production and export facilities.
Watch oil product stocks and prices as well as Brent calendar 2027. What to watch for this summer is thus oil product inventories falling and oil product premiums to crude rising. Another measure to watch is the Brent crude 2027 contract as it rises steadily day by day as the Strait of Hormuz stays closed and global oil inventories decline. The latter is close to the highest level since the start of the war and keeps rising.
The Brent M1 contract and the Brent 2027 prices and current price of jet fuel in Europe (ARA). All in USD/b

Our back of the envelope calculation of the global shortage created by the closure of the Strait of Hormuz. Note that 3.5 mb/d of discharge from SPR is also a draw. Note also that ’Forced demand loss’ of 2.5 mb/d is probably temporary and will fall back towards zero as logistics are sorted out leaving ’Price demand loss’ to do the job of balancing the market. Thus a shortfall of at least 9 mb/d created by the closure. More if SPR discharge is included and more if Forced demand loss recedes.

Brent is climbing higher. Front-month is at USD 106.3/bl this morning, close to a weekly high and a USD 9/bl jump from Mondays open. This is the move we flagged as a risk earlier in the week: the market shifting from ”a deal is around the corner” to ”this is going to take longer than we thought”.

Analyst Commodities, SEB
During April, rest-of-year Brent remained remarkably stable around USD 90/bl. A stability which rested on one single assumption: the SoH reopens around 1 May. That assumption is now slowly falling apart.
As we highlighted yesterday: every week of delay beyond 1 May adds (theoretically) ish USD 5/bl to the rest-of-year average, as global inventories draw 100 million barrels per week. i.e., a mid-May reopening implies rest-of-year Brent closer to USD 100/bl, and anything pushing into June or July takes us meaningfully higher.
What’s changed in the last 48 hours:
#1: The US military has formally warned that clearing suspected sea mines from SoH could take up to six months. That is a completely different timescale from what the financial market is pricing. Even a political deal tomorrow does not immediately reopen the strait.
#2: Trump has shifted his tone from urgency to ”strategic patience”. In yesterday’s press conference: ”Don’t rush me… I want a great deal.” The market is reading this as a president no longer feeling pressured by timelines, with the naval blockade running in the background.
#3: So far, the military activity is escalating, not de-escalating. Axios reports Iran is laying more mines in SoH. The US 3rd carrier strike group (USS George H.W. Bush) is arriving with two countermine vessels. Trump yesterday ordered the US Navy to destroy any Iranian boats caught laying mines. While CNN reports that the Pentagon is actively drawing up plans to strike Iranian SoH capabilities and individual Iranian military leaders if the ceasefire collapses. i.e., NOT a attitude consistent with an imminent deal!
Spot crude and product prices eased off the early-April highs on a combination of system rerouting and deal optimism. Both now weakening. Goldman estimates April Gulf output is reduced by 14.5 mbl/d, or 57% of pre-war supply, a number that keeps getting worse the longer this drags on.
Demand-side adaptation is ongoing: S. Korea has cut its Middle East crude dependence from 69% to 56% by pulling more from the Americas and Africa, and Japan is kicking off a second round of SPR releases from 1 May. But SPRs are finite.
Ref. to the negotiations, we should not bet on speed. The current Iranian leadership is dominated by genuine hardliners willing to absorb economic pain and run the clock to extract concessions. That is not a setup for a rapid resolution. US/Israeli media briefings keep framing the delay as ”internal Iranian divisions”, the reality is more complicated and points toward weeks and months, not days.
Our point is that the complexity is large, and higher prices have only just started (given a scenario where the negotiations drag out in time). The market spent April leaning on the USD 90/bl rest-of-year assumption; that case is diminishing by the hour. If ”early May reopening” is replaced by ”June, July or later” over the next week or two, both crude and products have meaningful room to reprice higher from here. There is a high risk being short energy and betting on any immediate political resolution(!).


Vattenfalls och Industrikrafts kärnkraftsbolag Videberg Kraft har valt Rolls-Royce SMR
Selling down on a ”deal”

Sommarväder skapar prisrally på elbörsen
Oil product price pain is set to rise as the Strait of Hormuz stays closed into summer

Solkraften pressar elpriserna dagtid
Oil product price pain is set to rise as the Strait of Hormuz stays closed into summer
Sommarväder skapar prisrally på elbörsen
Vattenfalls och Industrikrafts kärnkraftsbolag Videberg Kraft har valt Rolls-Royce SMR
Selling down on a ”deal”
-
Analys4 veckor sedan
Oil product price pain is set to rise as the Strait of Hormuz stays closed into summer
-
Nyheter2 veckor sedan
Sommarväder skapar prisrally på elbörsen
-
 Nyheter3 dagar sedan
Vattenfalls och Industrikrafts kärnkraftsbolag Videberg Kraft har valt Rolls-Royce SMR
-
Analys3 dagar sedan
Selling down on a ”deal”