Analys
Här har vete en tuff utmaning
 När vi för en månad sedan, den 21 februari, analyserade Wheat CBT var priset 647,75 USD/bu och vi stack ut med frågan om vete kanske kunde bli en bra placering under 2012, kanske till och med den bästa. Anledningen till denna fundering var att de långsiktiga indikatorerna skvallrade om fortsatta uppgångar för vete under innevarande år.
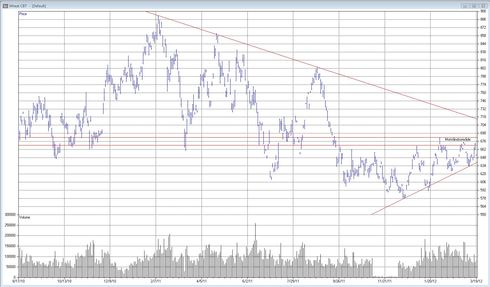
Vi räknade också med att vi redan i slutet av februari kunde få se ett uppgångsförsök där 700-730 USD/bu var extra intressant att bevaka. Här återfinns inte minst den fallande trendlinje som har sitt ursprung från toppen på 1 349,50 USD/bu för 4 år sedan.
När vi nu ser tillbaka på den senaste månadens utveckling, kan vi se att vete visserligen startade en uppgång i slutet av februari, men redan vid 675 USD/bu tog kraften slut. Detta blev toppnoteringen den 2 mars.
Även under förra veckan gjorde vetet en ny attack mot 675 USD/bu, men inte heller denna gång förmådde den att bryta igenom detta motstånd utan vände moloket ned igen. Det är dags att visa på styrka nu de närmaste veckorna. Annars kommer placerarna att tappa tålamodet med vete.
Vi har nu därför ett betydelsefullt område mellan 668-683 USD/bu. Först när vi får ett genombrott av detta, vågar vi sikta på fortsatta uppgångar. Givetvis är inte hoppet på något sätt ute men vi flyttar upp vår stopploss till 640 USD/bu för att säkra vinsten.
Skulle den långsiktigt fallande trendlinjen vid 715 USD/bu passeras i en uppgång, öppnas dörren för att fyra års nedgång ska korrigeras. Vi kan i detta läge räkna med en uppgång som i bästa fall kan nå 1 000 USD/bu under innevarande år. Detta ligger kvar som en möjlighet, men vi har flera hinder på vägen upp som kan få vetet att byta riktning.
Vi kan alltså acceptera en nedgång till 640 USD/bu men inte mer än så. Går vetet under denna nivå, bryts nämligen den stigande trend som varit gällande sedan lågpunkten den 15 december förra året på 578,50 USD/bu (se diagrammet). I bästa fall kommer då vetet att börja konsolidera, men det kan också bli så att en ny nedgångsfas påbörjas. Och tills detta är beslutat, väljer vi att stå utanför.
Du kan handla VETE med följande minifutures:
Uppgång MINILONG VETE N med en hävstång kring 5,06
Nedgång: MINISHRT VETE M med en hävstång kring 4,07
Läs mer om minifutures på RBS hemsida
[box]Denna analys publiceras på Råvarumarknaden.se med tillstånd och i samarbete med Axier Equities.[/box]
Ansvarsfriskrivning
Den tekniska analysen har producerats av Axier Equities. Informationen är rapporterad i god tro och speglar de aktuella åsikterna hos medarbetarna, dessa kan ändras utan varsel. Axier Equities tar inget ansvar för handlingar baserade på informationen.
Om Axier Equities
Axier Equities erbjuder såväl institutionella placerare som privatpersoner den erfarenhet, kompetens och analysredskap som krävs för en trygg och effektiv handel på de finansiella marknaderna. Axier Equities erbjuder ingen handel, vare sig för egen räkning eller för kunder utan arbetar endast med finansiell marknadsföring och informationshantering. Företagets kunder får dessutom ta del av deras analysprodukter som till exempel det fullständiga morgonbrevet med ytterligare kommentarer och prognoser. Varje vecka tillkommer minst 30 analyser i Axier Equities analysarkiv. För ytterligare information se Axier Equities hemsida.
Analys
OPEC+ will have to make cuts before year end to stay credible

Falling 8 out of the last 10 days with some rebound this morning. Brent crude fell 0.7% yesterday to USD 65.63/b and traded in an intraday range of USD 65.01 – 66.33/b. Brent has now declined eight out of the last ten days. It is now trading on par with USD 65/b where it on average traded from early April (after ’Liberation day’) to early June (before Israel-Iran hostilities). This morning it is rebounding a little to USD 66/b.

Russia lifting production a bit slower, but still faster than it should. News that Russia will not hike production by more than 85 kb/d per month from July to November in order to pay back its ’production debt’ due to previous production breaches is helping to stem the decline in Brent crude a little. While this kind of restraint from Russia (and also Iraq) has been widely expected, it carries more weight when Russia states it explicitly. It still amounts to a total Russian increase of 425 kb/d which would bring Russian production from 9.1 mb/d in June to 9.5 mb/d in November. To pay back its production debt it shouldn’t increase its production at all before January next year. So some kind of in-between path which probably won’t please Saudi Arabia fully. It could stir some discontent in Saudi Arabia leading it to stay the course on elevated production through the autumn with acceptance for lower prices with ’Russia getting what it is asking for’ for not properly paying down its production debt.
OPEC(+) will have to make cuts before year end to stay credible if IEA’s massive surplus unfolds. In its latest oil market report the IEA estimated a need for oil from OPEC of 27 mb/d in Q3-25, falling to 25.7 mb/d in Q4-25 and averaging 25.7 mb/d in 2026. OPEC produced 28.3 mb/d in July. With its ongoing quota unwind it will likely hit 29 mb/d later this autumn. Staying on that level would imply a running surplus of 3 mb/d or more. A massive surplus which would crush the oil price totally. Saudi Arabia has repeatedly stated that OPEC+ it may cut production again. That this is not a one way street of higher production. If IEA’s projected surplus starts to unfold, then OPEC+ in general and Saudi Arabia specifically must make cuts in order to stay credible versus what it has now repeatedly stated. Credibility is the core currency of Saudi Arabia and OPEC(+). Without credibility it can no longer properly control the oil market as it whishes.
Reactive or proactive cuts? An important question is whether OPEC(+) will be reactive or proactive with respect to likely coming production cuts. If reactive, then the oil price will crash first and then the cuts will be announced.
H2 has a historical tendency for oil price weakness. Worth remembering is that the oil price has a historical tendency of weakening in the second half of the year with OPEC(+) announcing fresh cuts towards the end of the year in order to prevent too much surplus in the first quarter.
Analys
What OPEC+ is doing, what it is saying and what we are hearing

Down 4.4% last week with more from OPEC+, a possible truce in Ukraine and weak US data. Brent crude fell 4.4% last week with a close of the week of USD 66.59/b and a range of USD 65.53-69.98/b. Three bearish drivers were at work. One was the decision by OPEC+ V8 to lift its quotas by 547 kb/d in September and thus a full unwind of the 2.2 mb/d of voluntary cuts. The second was the announcement that Trump and Putin will meet on Friday 15 August to discuss the potential for cease fire in Ukraine (without Ukraine). I.e. no immediate new sanctions towards Russia and no secondary sanctions on buyers of Russian oil to any degree that matters for the oil price. The third was the latest disappointing US macro data which indicates that Trump’s tariffs are starting to bite. Brent is down another 1% this morning trading close to USD 66/b. Hopes for a truce on the horizon in Ukraine as Putin meets with Trump in Alaska in Friday 15, is inching oil lower this morning.

Trump – Putin meets in Alaska. The potential start of a process. No disruption of Russian oil in sight. Trump has invited Putin to Alaska on 15 August to discuss Ukraine. The first such invitation since 2007. Ukraine not being present is bad news for Ukraine. Trump has already suggested ”swapping of territory”. This is not a deal which will be closed on Friday. But rather a start of a process. But Trump is very, very unlikely to slap sanctions on Russian oil while this process is ongoing. I.e. no disruption of Russian oil in sight.
What OPEC+ is doing, what it is saying and what we are hearing. OPEC+ V8 is done unwinding its 2.2 mb/d in September. It doesn’t mean production will increase equally much. Since it started the unwind and up to July (to when we have production data), the increase in quotas has gone up by 1.4 mb/d, while actual production has gone up by less than 0.7 mb/d. Some in the V8 group are unable to increase while others, like Russia and Iraq are paying down previous excess production debt. Russia and Iraq shouldn’t increase production before Jan and Mar next year respectively.
We know that OPEC+ has spare capacity which it will deploy back into the market at some point in time. And with the accelerated time-line for the redeployment of the 2.2 mb/d voluntary cuts it looks like it is happening fast. Faster than we had expected and faster than OPEC+ V8 previously announced.
As bystanders and watchers of the oil market we naturally combine our knowledge of their surplus spare capacity with their accelerated quota unwind and the combination of that is naturally bearish. Amid this we are not really able to hear or believe OPEC+ when they say that they are ready to cut again if needed. Instead we are kind of drowning our selves out in a combo of ”surplus spare capacity” and ”rapid unwind” to conclude that we are now on a highway to a bear market where OPEC+ closes its eyes to price and blindly takes back market share whatever it costs. But that is not what the group is saying. Maybe we should listen a little.
That doesn’t mean we are bullish for oil in 2026. But we may not be on a ”highway to bear market” either where OPEC+ is blind to the price.
Saudi OSPs to Asia in September at third highest since Feb 2024. Saudi Arabia lifted its official selling prices to Asia for September to the third highest since February 2024. That is not a sign that Saudi Arabia is pushing oil out the door at any cost.
Saudi Arabia OSPs to Asia in September at third highest since Feb 2024

Analys
Breaking some eggs in US shale

Lower as OPEC+ keeps fast-tracking redeployment of previous cuts. Brent closed down 1.3% yesterday to USD 68.76/b on the back of the news over the weekend that OPEC+ (V8) lifted its quota by 547 kb/d for September. Intraday it traded to a low of USD 68.0/b but then pushed higher as Trump threatened to slap sanctions on India if it continues to buy loads of Russian oil. An effort by Donald Trump to force Putin to a truce in Ukraine. This morning it is trading down 0.6% at USD 68.3/b which is just USD 1.3/b below its July average.

Only US shale can hand back the market share which OPEC+ is after. The overall picture in the oil market today and the coming 18 months is that OPEC+ is in the process of taking back market share which it lost over the past years in exchange for higher prices. There is only one source of oil supply which has sufficient reactivity and that is US shale. Average liquids production in the US is set to average 23.1 mb/d in 2025 which is up a whooping 3.4 mb/d since 2021 while it is only up 280 kb/d versus 2024.
Taking back market share is usually a messy business involving a deep trough in prices and significant economic pain for the involved parties. The original plan of OPEC+ (V8) was to tip-toe the 2.2 mb/d cuts gradually back into the market over the course to December 2026. Hoping that robust demand growth and slower non-OPEC+ supply growth would make room for the re-deployment without pushing oil prices down too much.
From tip-toing to fast-tracking. Though still not full aggression. US trade war, weaker global growth outlook and Trump insisting on a lower oil price, and persistent robust non-OPEC+ supply growth changed their minds. Now it is much more fast-track with the re-deployment of the 2.2 mb/d done already by September this year. Though with some adjustments. Lifting quotas is not immediately the same as lifting production as Russia and Iraq first have to pay down their production debt. The OPEC+ organization is also holding the door open for production cuts if need be. And the group is not blasting the market with oil. So far it has all been very orderly with limited impact on prices. Despite the fast-tracking.
The overall process is nonetheless still to take back market share. And that won’t be without pain. The good news for OPEC+ is of course that US shale now is cooling down when WTI is south of USD 65/b rather than heating up when WTI is north of USD 45/b as was the case before.
OPEC+ will have to break some eggs in the US shale oil patches to take back lost market share. The process is already in play. Global oil inventories have been building and they will build more and the oil price will be pushed lower.
A Brent average of USD 60/b in 2026 implies a low of the year of USD 45-47.5/b. Assume that an average Brent crude oil price of USD 60/b and an average WTI price of USD 57.5/b in 2026 is sufficient to drive US oil rig count down by another 100 rigs and US crude production down by 1.5 mb/d from Dec-25 to Dec-26. A Brent crude average of USD 60/b sounds like a nice price. Do remember though that over the course of a year Brent crude fluctuates +/- USD 10-15/b around the average. So if USD 60/b is the average price, then the low of the year is in the mid to the high USD 40ies/b.
US shale oil producers are likely bracing themselves for what’s in store. US shale oil producers are aware of what is in store. They can see that inventories are rising and they have been cutting rigs and drilling activity since mid-April. But significantly more is needed over the coming 18 months or so. The faster they cut the better off they will be. Cutting 5 drilling rigs per week to the end of the year, an additional total of 100 rigs, will likely drive US crude oil production down by 1.5 mb/d from Dec-25 to Dec-26 and come a long way of handing back the market share OPEC+ is after.
-

 Nyheter4 veckor sedan
USA inför 93,5 % tull på kinesisk grafit
-

 Nyheter3 veckor sedan
Fusionsföretag visar hur guld kan produceras av kvicksilver i stor skala – alkemidrömmen ska bli verklighet
-

 Nyheter4 veckor sedan
Westinghouse planerar tio nya stora kärnreaktorer i USA – byggstart senast 2030
-

 Nyheter2 veckor sedan
Kopparpriset i fritt fall i USA efter att tullregler presenterats
-

 Nyheter3 veckor sedan
Ryska militären har skjutit ihjäl minst 11 guldletare vid sin gruva i Centralafrikanska republiken
-

 Nyheter2 veckor sedan
Lundin Gold rapporterar enastående borrresultat vid Fruta del Norte
-

 Nyheter2 veckor sedan
Stargate Norway, AI-datacenter på upp till 520 MW etableras i Narvik
-

 Nyheter4 veckor sedan
Kina skärper kontrollen av sällsynta jordartsmetaller, vill stoppa olaglig export


