

Analys
Getting to zero, getting the job done


Politicians have been talking and talking for decades but with only marginal improvements in terms of emission reductions. Primarily because actually doing the job has earlier been technologically and economically almost impossible. Now suddenly renewable energy has come of age with prices set to decline yet further. And onshore transportation can soon be electrified cost efficiently. For politicians there is now a viable path. It is still a large task but now it is more and more about just getting the job done. In rough terms some € 150 – 250 bn per year to 2050 is probably needed to build EU’s new power system.

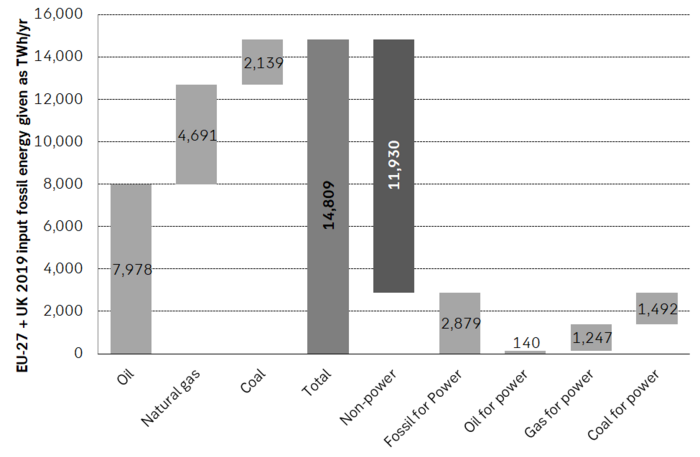
In 2019 the EU + UK consumed 15,000 worth of fossil fuels. It all needs to be gone by 2050. In 2019 the EU + UK produced 3,200 TWh of electricity of which 1,295 TWh (40%) was fossil fuel based. Thus 60% of the power supply is already non-fossil. However, if we look at the larger picture of energy we see that the region consumed nearly 15,000 TWh of raw (evaluated pre-combustion) fossil fuels that year of which only 3,000 TWh was used for power. The remaining 12,000 TWh of fossil fuel consumption was consumed for heat, transportation, petrochemical and industrial uses. I.e. the lion’s share of fossil fuel consumption in the region is non-power related.
Thus getting to zero by 2050 is far more than swapping out of the 3,000 TWh of fossil fuels (pre-combustion) used for power supply today which post combustion creates 40% and 1,295 TWh of the regions electricity supply. The challenge is also about replacing the other 12,000 TWh of fossil energy for non-power uses.
As most know the conversion of fossil fuels to useful energy and work done is highly inefficient. In cars one rarely get more than 30% of the energy converted to useful driving with the rest just lost as heat. In large, power plants the conversion ratio is usually around 35% to 55% but mostly below 50%. Gas for heating purposes is of course highly efficient as almost all of it naturally is converted to heat.
The region is now aiming to go green by 2050 and that mostly means going electric. This again means that some 15,000 TWh of fossil energy spent today needs to be replaced by non-fossil based electricity. Given the highly inefficient burn of fossil energy to useful work it is no surprise that we don’t need the same amount of electricity output to replace it but rather something like only 30% to 50% as much.
When it comes to synthetically generated “electric fuels” (power to liquids or hydrogen) we are talking about an up to 200% replacement ratio because up to 50% of the electricity is lost in the conversion of power to liquids. But for most other purposes like electrifying transportation and replacing the burning of fossil fuels for power etc. the replacement ratio is often more like 30% to 50%. When it comes to replacing gas for heating purposes it is a one-to-one replacement.
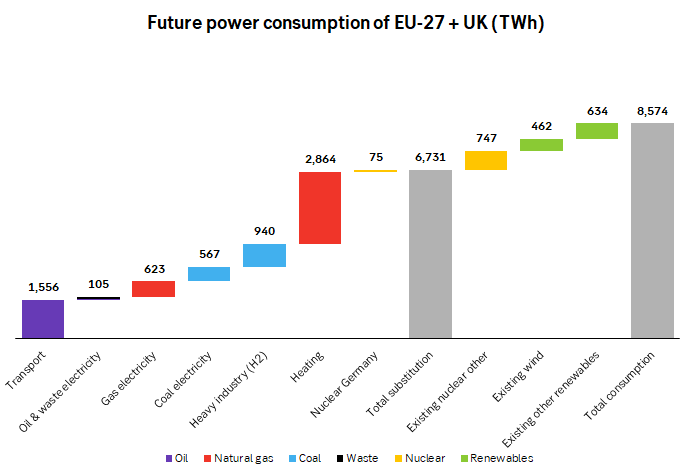
In our calculations the region is going to need 6,731 TWh of new non-fossil based electricity by 2050 in order to replace the 15,000 TWh worth (pre-combustion) of fossil energy spent today. I.e. a replacement ratio of 46%. It is thus good news that we don’t need at total of 15,000 TWh of new non-fossil based power supply by 2050 but instead “only” 6,731 TWh.
This replacement is still huge! In comparison the supply of electricity in 2019 was 3,200 TWh (including fossil based power). I.e. the region needs to build its total power supply of today more than two times over by 2050 and at that point in time reach a total power supply of 8,574 TWh.
If we equate the challenge to the number of nuclear power units needed to cover it we are talking 570 new nuclear power units each of 1,500 MW capacity. In 2013 there were 131 operational nuclear power plants and today we are probably closer to 110. Thus to do the job by nuclear we need to increase nuclear power by more than 500% by 2050.
While the job is challenging it is by no means impossible. If we take the new UK Hinkley nuclear power plant as an example in terms of capex we have the following. It will generate about 25 TWh of electricity per year and cost about € 27 bn to build. I.e. €1.1 bn for a 1 TWh/year supply rate. Multiply by the needed 6,731 TWh/year of new power supply by 2050 and we get a needed capex € 7,147 bn in total which again equates to € 238 bn/yr over the next 30 years. Nuclear power is today considered to be a quite expensive source of new electricity with renewable energy often being significantly cheaper (up to 50% cheaper) though not providing baseload supply and rather intermittent supply.
Capex spending in the EU + UK should be in the ball-park of € 150 – 250 bn per year or 1.3% of GDP. Capex spending on new power supply over the coming 30 years should probably be in the ball-park of $ 150 – 250bn/year. And then some additional investments for a lot of infrastructure adaptation. EU and UK thus needs to spend some 1.3% of its GDP per year for the energy transition (€ 238 bn/yr divided by GDP of € 18,292 bn in 2019). But that of course assumes that there is no further declines in the cost of new renewable energy which by most measures is projected to continue to fall year by year. And going electric in the transportation sector (on land) will in not too long be a pure net saving as electric cars becomes cheaper than fossil cars while electric cars are also much more energy efficient than fossil cars.
The example of nuclear energy is for simplicity purposes. It is not in the cards at all today that the region is going big-time nuclear. The direction is rather much more renewable energy.
On the table we already have a pledge of 2,100 TWh/year of offshore wind by 2050. On the drawing table we already have an announced build-out of 300 GW of new offshore wind by the EU and 100 GW of offshore wind by the UK. Both by 2050. What does that mean? At a 60% offshore wind utilization ratio this equates to 2,100 TWh/year of new power supply by 2050. Thus already today a total of 31% of the new, needed 6,731 TWh by 2050 is firmly on the drawing table.
For many decades there has been endless political discussions about climate change. As a result we have moved a little forward but not all that much. We have gotten the European emission trading scheme (EU ETS) which is good and where we now have a decent carbon price of € 42/ton which starts to matter and where abatement (carbon reductions) is happening on the margin.
We have now come to the point where it is all bout getting the job done. To actually build what needs to be replaced. However, we have now gotten to the point of crunch-time. The time to act. The time to start the real change. Now it is about figuring out how to get to zero by 2050. Now it is all about getting the job done for real. Our sense is that thousands of engineers across Europe today suddenly are mapping out detailed plans of what we actually need to do to get there. It is not easy. It does not happen by itself. But it is absolutely doable and it will require some €150 – 250/bn per year in capex spending on new non-fossil based power supply over the next 30 years. But probably less than that as the cost of renewable energy continues to decline.
The region is not going to get to zero by 2050 by marginal abatement in the EU ETS emission system. The region is going to get there by outright building the alternative and then increasingly retiring the current system. And what it looks like already is that offshore wind is going to be a major part of the solution with plans already in place to solve 30% of the challenge.
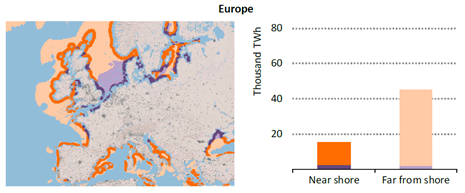
IEA estimated in a report from 2019 that technical offshore wind power resources in Europe is 60,000 TWh worth of power supply. That is almost 10 times as much as what is needed to solve EU + UK’s goal of zero emissions by 2050. And as stated above the two have already committed to build 2,100 TWh/year of offshore wind power supply by 2050. So on the drawing table we are already one third of the way.
Norway is not really on the map here yet but it could easily offer to build 2,000 TWh of offshore wind power supply if EU agreed to buy it and pay for it at an agreeable price. If so this would lead to a real offshore wind bonanza over the coming 30 years equal to the build-out of the oil and gas on the NCS.
The EU + UK needs to kick the habit of consuming close to 15,000 TWh worth of fossil fuels per year by 2050 (evaluated pre-combustion). The replacement is going to happen by building the alternative and governments will be involved big-time to get it done. The current power supply for the region needs to be build more than two times over by 2050 to get the job done.
The EU + UK produced a total of 3,200 TWh of power in 2019 of which 1,295 TWh (40%) was generated by fossil fuels. In total the EU + UK will need 6,731 TWh of new non-fossil based power supply by 2050 in order to kick 15,000 worth of fossil fuels (evaluated pre-combustion) out the door. At that point total power supply in the region needs to be 8,574 TWh/year in order for the region to go green. Of the 6,731 TWh of new non-fossil power needed we already have a pledge by the EU and the UK together of 2,100 TWh of new offshore wind power supply by 2050. Thus 31% of the power needed to go fully green by 2050 is already pledged for through offshore wind. In the following graph ”EU” is short of ”EU+UK” for the sake of abbreviation.

The following graph shows how much new non-emitting power supply the EU + UK needs for each sector to go electric and green by 2050. Today’s consumption of 15,000 TWh (pre-combustion) is mostly outside of the power sector. Some 1,900 TWh of current power supply can be kept for the future as it is non-emitting like nuclear, wind and other renewables. Total non-emitting power supply in the region needs to be 8,574 TWh by 2050 in order to go green.
Technical offshore wind potential in Europe is close to 60,000 TWh per year according to a recent report by the IEA published in November 2019. Almost 10x of what the EU + UK needs to go fully green by 2050. And much of the capacity is in the North Sea between the UK and Norway.
Hesitant today. Brent jumped to an intraday high of $66.36/b yesterday after having touched an intraday low of $60.07/b on Monday as Indian and Chinese buyers cancelled some Russian oil purchases and instead redirected their purchases towards the Middle East due to the news US sanctions. Brent is falling back 0.4% this morning to $65.8/b.

It’s our strong view that the only sensible thing is to sell this rally. In all Trump’s unpredictability he has become increasingly predictable. Again and again he has rumbled about how he is going to be tough on Putin. Punish Putin if he won’t agree to peace in Ukraine. Recent rumbling was about the Tomahawk rockets which Trump threatened on 10 October and 12 October to sell/send to Ukraine. Then on 17 October he said that ”the U.S. didn’t want to give away weapons (Tomahawks) it needs”.
All of Trump’s threats towards Putin have been hot air. So far Trump’s threats have been all hot air and threats which later have evaporated after ”great talks with Putin”. After all these repetitions it is very hard to believe that this time will be any different. The new sanctions won’t take effect before 21. November. Trump has already said that: ”he was hoping that these new sanctions would be very short-lived in any case”. Come 21. November these new sanctions will either evaporate like all the other threats Trump has thrown at Putin before fading them. Or the sanctions will be postponed by another 4 weeks or 8 weeks with the appearance that Trump is even more angry with Putin. But so far Trump has done nothing that hurt Putin/Russia. We can’t imagine that this will be different. The only way forward in our view for a propre lasting peace in Ukraine is to turn Ukraine into defensive porcupine equipped with a stinging tail if need be.
China will likely stand up to Trump if new sanctions really materialize on 21 Nov. Just one country has really stood up to Trump in his tariff trade war this year: China. China has come of age and strength. I will no longer be bullied. Trump upped tariffs. China responded in kind. Trump cut China off from high-end computer chips. China put on the breaks on rare earth metals. China won’t be bullied any more and it has the power to stand up. Some Chinese state-owned companies like Sinopec have cancelled some of their Russian purchases. But China’s Foreign Ministry spokesperson Guo Jiakun has stated that China “oppose unilateral sanctions which lack a basis in international law and authorization of the UN Security Council”. Thus no one, not even the US shall unilaterally dictate China from whom they can buy oil or not. This is yet another opportunity for China to show its new strength and stand up to Trump in a show of force. Exactly how China choses to play this remains to be seen. But China won’t be bullied by over something as important as its oil purchases. So best guess here is that China will defy Trump on this. But probably China won’t need to make a bid deal over this. Firstly because these new sanctions will either evaporate as all the other threats or be postponed once we get to 21 November. Secondly because the sanctions are explicit towards US persons and companies but only ”may” be enforced versus non-US entities.
Sanctions is not a reduction in global supply of oil. Just some added layer of friction. Anyhow, the new sanctions won’t reduce the supply of Russian crude oil to the market. It will only increase the friction in the market with yet more need for the shadow fleet and ship to ship transfer of Russian oil to dodge the sanctions. If they materialize at all.
The jump in crude oil prices is probably due to redirections of crude purchases to the Mid-East and not because all speculators are now turned bullish. Has oil rallied because all speculators now suddenly have turned bullish? We don’t think so. Brent crude has probably jumped because some Indian and Chinese oil purchasers of have redirected their purchases from Russia towards the Mid-East just in case the sanctions really materializes on 21 November.
Parts of the Brent crude curve dipping into the high $50ies/b. Brent crude fell 2.3% over the week to Friday. It closed the week at $61.29/b, a slight gain on the day, but also traded to a low of $60.14/b that same day and just barely avoided trading into the $50ies/b. This morning it is risk-on in equities which seems to help industrial metals a little higher. But no such luck for oil. It is down 0.8% at $60.8/b. This week looks set for Brent crude to dip its feet in the $50ies/b. The Brent 3mth contract actually traded into the high $50ies/b on Friday.
The front-end backwardation has been on a weakening foot and is now about to fully disappear. The lowest point of the crude oil curve has also moved steadily lower and lower and its discount to the 5yr contract is now $6.8/b. A solid contango. The Brent 3mth contract did actually dip into the $50ies/b intraday on Friday when it traded to a low point of $59.93/b.
More weakness to come as lots of oil at sea comes to ports. Mid-East OPEC countries have boosted exports along with lower post summer consumption and higher production. The result is highly visibly in oil at sea which increased by 17 mb to 1,311 mb over the week to Sunday. Up 185 mb since mid-August. On its way to discharge at a port somewhere over the coming month or two.
Don’t forget that the oil market path ahead is all down to OPEC+. Remember that what is playing out in the oil market now is all by design by OPEC+. The group has decided that the unwind of the voluntary cuts is what it wants to do. In a combination of meeting demand from consumers as well as taking back market share. But we need to remember that how this plays out going forward is all at the mercy of what OPEC+ decides to do. It will halt the unwinding at some point. It will revert to cuts instead of unwind at some point.
A few months with Brent at $55/b and 40-50 US shale oil rigs kicked out may be what is needed. We think OPEC+ needs to see the exit of another 40-50 drilling rigs in the US shale oil patches to set US shale oil production on a path to of a 1 mb/d year on year decline Dec-25 to Dec-26. We are not there yet. But a 2-3 months period with Brent crude averaging $55/b would probably do it.
Oil on water increased 17 mb over the week to Sunday while oil in transit increased by 23 mb. So less oil was standing still. More was moving.

Crude oil floating storage (stationary more than 7 days). Down 11 mb over week to Sunday

The lowest point of the Brent crude oil curve versus the 5yr contract. Weakest so far this year.

Crude oil 1mth to 3mth time-spreads. Dubai held out strongly through summer, but then that center of strength fell apart in late September and has been leading weakness in crude curves lower since then.

Rebounding along with most markets. But concerns over solidity of Gaza peace may also contribute. Brent crude fell 0.8% yesterday to $61.91/b and its lowest close since May this year. This morning it is bouncing up 0.9% to $62.5/b along with a softer USD amid positive sentiment with both equities and industrial metals moving higher. Concerns that the peace in Gaza may be less solid than what one might hope for also yields some support to Brent. Bets on tech stocks are rebounding, defying fears of trade war. Money moving back into markets. Gold continues upwards its strong trend and a softer dollar helps it higher today as well.
US crude & products probably rose 5.6 mb last week (API) versus a normal seasonal decline of 2.4 mb. The US API last night partial and thus indicative data for US oil inventories. Their data indicates that US crude stocks rose 7.4 mb last week, gasoline stocks rose 3.0 mb while Distillate stocks fell 4.8 mb. Altogether an increase in commercial crude and product stocks of 5.6 mb. Commercial US crude and product stocks normally decline by 2.4 mb this time of year. So seasonally adjusted the US inventories rose 8 mb last week according to the indicative numbers by the API. That is a lot. Also, the counter seasonal trend of rising stocks versus normally declining stocks this time of year looks on a solid pace of continuation. If the API is correct then total US crude and product stocks would stand 41 mb higher than one year ago and 6 mb higher than the 2015-19 average. And if we combine this with our knowledge of a sharp increase in production and exports by OPEC(+) and a large increase in oil at sea, then the current trend in US oil inventories looks set to continue. So higher stocks and lower crude oil prices until OPEC(+) switch to cuts. Actual US oil inventory data today at 18:00 CET.
US commercial crude and product stocks rising to 1293 mb in week 41 if last nights indicative numbers from API are correct.

Crude oil soon coming to a port near you. OPEC has lifted production sharply higher this autumn. At the same time demand for oil in the Middle-East has fallen as we have moved out of summer heat and crude oil burn for power for air-conditioning. The Middle-East oil producers have thus been able to lift exports higher on both accounts. Crude oil and condensates on water has shot up by 177 mb since mid-August. This oil is now on its way to ports around the world. And when they arrive, it will likely help to lift stocks onshore higher. That is probably when we will lose the last bit of front-end backwardation the the crude oil curves. That will help to drive the front-month Brent crude oil price down to the $60/b line and revisit the high $50ies/b. Then the eyes will be all back on OPEC+ when they meet in early November and then again in early December.
Crude oil and condensates at sea have moved straight up by 177 mb since mid-August as OPEC(+) has produced more, consumed less and exported more.


Sell the rally. Trump has become predictable in his unpredictability

Gruvbolaget Boliden överträffade analytikernas förväntningar

Australien och USA investerar 8,5 miljarder USD för försörjningskedja av kritiska mineraler
Brent crude set to dip its feet into the high $50ies/b this week

Vad guldets uppgång egentligen betyder för världen

Goldman Sachs höjer prognosen för guld, tror priset når 4900 USD

Blykalla och amerikanska Oklo inleder ett samarbete

Guld nära 4000 USD och silver 50 USD, därför kan de fortsätta stiga

Leading Edge Materials är på rätt plats i rätt tid

Nytt prisrekord, guld stiger över 4000 USD
-
 Nyheter3 veckor sedan
Goldman Sachs höjer prognosen för guld, tror priset når 4900 USD
-
 Nyheter4 veckor sedan
Blykalla och amerikanska Oklo inleder ett samarbete
-
 Nyheter4 veckor sedan
Guld nära 4000 USD och silver 50 USD, därför kan de fortsätta stiga
-
 Nyheter2 veckor sedan
Leading Edge Materials är på rätt plats i rätt tid
-
 Nyheter3 veckor sedan
Nytt prisrekord, guld stiger över 4000 USD
-

 Nyheter4 veckor sedan
Ett samtal om guld, olja, koppar och stål
-
Analys4 veckor sedan
OPEC+ will likely unwind 500 kb/d of voluntary quotas in October. But a full unwind of 1.5 mb/d in one go could be in the cards
-

 Nyheter4 veckor sedan
Neptune Energy bekräftar enorma litiumfyndigheter i Tyskland