

Analys
Det stora spannmålsrånet
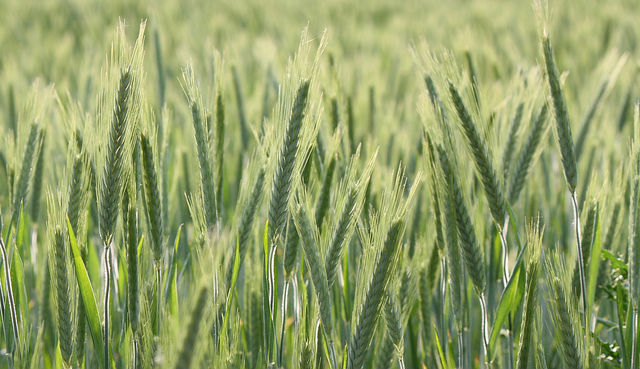
Det stora spannmålsrånet, eller The Great grain robbery, också känt som The Russian wheat deal, refererar till när det forna Sovjetunionen 1972 köpte betydande mängder spannmål, främst vete och majs men också sojabönor, av USA till låga priser. Orsaken till att Sovjetunionen köpte sådana mängder spannmål från USA berodde på att Sovjetunionen drabbats av en betydande torka som förstörde 20 procent av landets skördar.
 Egentligen hade Sovjetunionen börjat köpa amerikanskt spannmål redan innan, trots det kalla kriget som då rådde och gjorde att det i princip var omöjligt för amerikanska företag att handla med företag i Östeuropa.
De stora köpen kom under perioden juli och augusti 1972, när Sovjetunionen köpte 440 miljoner bushels vete, cirka 25 procent av USAs skörd det året, till ett pris om 700 MUSD. Från början var det endast tänkt att Sovjetunionen skulle köpa spannmål till ett värde om 150 MUSD, men i all tysthet signerade den amerikanska regeringen ett treårigt avtal med Sovjetunionen enligt vilket de styrande i det stora landet i öst förband sig att köpa stora mängder spannmål från USA.
Sovjetunionen gjorde sedan ytterligare köp från en rad olika spannmålshandlare. Sovjetunionen använde en kredit på 750 MUSD som landet hade fått från den amerikanska regeringen samt 500 MUSD av sin egen hårdvaluta för att köpa majs, vete och sojabönor. Sovjetunionen köpte när priserna var låga och i all tysthet, faktum är att det tog flera månader innan det kom ut att Sovjetunionen agerat så pass tungt på köpsidan. När detta väl läckte ut kom spannmålspriserna att explodera uppåt.
De högsta spannmålspriserna på 125 år
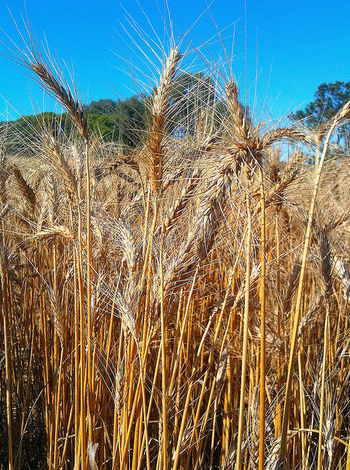
Händelsen ledde sedan till de högsta spannmålspriserna på 125 år i USA, en av de verkliga tjurmarknaderna som varade mellan 1972 och 1973. Under en femmånadersperiod 1973 handlades sojabönorna till 8 USD per bushel och noterade sedan en toppnotering på Chicago Board of Trade på 12,90 USD per bushel. Mindre än ett år tidigare hade sojabönorna handlats till 3,31 USD per bushel, en prisuppgång på 390 procent. Att priserna steg så pass kraftigt var inte enbart en effekt av Sovjetunionens köp, det sammanföll med en torka i Australien och av att Indien vid detta tillfälle kom att bli en stor aktör på de globala råvarubörserna, i detta fall som en stor köpare av spannmål.
Samtidigt kom ett antal av USAs spannmålsexportörer att göra stora vinster på denna affär, uppskattningsvis kunde de dela på 300 MUSD av de amerikanska skattebetalarnas pengar. Att händelsen kom att bli känd som The Great grain robbery är således inte så konstigt. Flera av dessa spannmålshandlare hade dessutom agerat som köpare, i syfte att hedga det spannmål de sålde till Sovjetunionen så hade de köpt vete, majs och sojabönor på råvarubörserna. När de sovjetiska spannmålsköpen blev allmän kännedom ledde det till att råvaruhandlarna gjorde enorma vinster. Det förekom också beskyllningar om att Sovjet hade köpt stora mängder terminskontrakt i syfte att göra vinster som skulle finansiera köpen av den fysiska spannmålen. Senare ledde detta till att en rad anklagelser om att insidertrading hade skett, men inga åtal väcktes och det gick inte att påvisa att det förekommit någon otillbörlig marknadspåverkan trots senatsförhör och liknande undersökningar. Det enda signifikanta resultatet av detta var att konsumenterna drabbades av högre priser på spannmålsprodukter.
Neil Sanders, Londonbaserad detaljhandelsanalytiker, sade att vetekrisen 1973 bidrog till att priset på en limpa bröd steg med 87 procent, från 10,1 pence, till 18,9 pence året efter. I slutet av 2011 låg priset på motsvarande limpa i England på 84 pence. Även andra livsmedel som till exempel pasta, foder och i förlängningen kyckling och kött kom också att påverkas, om än i mindre omfattning.
Vid FN:s mat och jordbruksorganisation, FAO, i Rom, säger ekonomen Abdolreza Abbassian att det är ländernas regeringar som skall ta skulden i de fall konsumenterna drabbas av spannmålskriserna. Han säger att världen blivit för fokuserad på vete från Svarta havs-regionen. Skördarna i detta område är emellertid mindre pålitliga än det spannmål som odlas i stabilare regioner som Kanada och USA. Enligt Abbassian måste det vidtas åtgärder för att mildra effekter av händelser som torka eller skyfall.
Ryska spioner avlyssnade råvaruhandlarnas telefoner
The Great grain robbery var en lysande insats som bland annat inbegrep den före detta spionorganisationen KGB som avlyssnade råvaruhandlarnas telefoner. Målet med detta var att de ryska spannmålshandlarna skulle kunna hitta de lägsta priserna och kunna köpa spannmålet där det var billigast utan att driva upp priset. På detta sätt kom Sovjet åt 300 MUSD av de amerikanska skattebetalarnas pengar i form av exportsubventioner, i en tid då den amerikanska regeringen var ute efter att lindra de kroniskt låga spannmålspriser genom att uppmuntra spannmålsexport.
Efterdyningar
The Great grain robbery var en av de ekonomiska händelser som kom att ändra världen för alltid. Det stora spannmålsrånet ledde till nya, stränga rapporteringsregler för de amerikanska råvaruhandlarna, regler som gäller än i dag. Det stora spannmålsrånet kom också att leda till en massiv ökning av råvarupriserna i allmänhet, och bidrog till att driva den amerikanska ekonomin till både recession och stagflation. Detta resulterade sedan i vad som kom att kallas för Reaganomics.
President Nixon införde ett exportförbud av sojabönor för att bromsa ytterligare prishöjningar på sojabönor. Detta partiella embargo ledde till kritik från utlandet eftersom det ledde till att amerikanska kontrakt upphävdes.
En bomullskris uppstod 1973 och 1974 där priset på bomull nästan fördubblats under en sexmånadersperiod. Ungefär 500 stämningar lämnades in avseende bomullskontrakt som hade baserats på lägre priser. Samtidigt steg priset på majs kraftigt. Matpriserna världen över steg med cirka 50 procent under de första sex månaderna av 1973. Livsmedelspriserna exploderade igen 1974.
U.S. General Accounting Office släppte en rapport i juli 1973 som säger att försäljningen hade misskötts och bidrog till att pressa upp livsmedelspriserna. Spannmålsförsäljningen ledde dessutom till att de amerikanska skattebetalarna tvingades till att betala onödiga subventioner. GAO sade att Ryssland borde ha betalat högre priser för det spannmål landet köpte vilket skulle ha minska subventionerna till spannmålsföretagen, och att jordbrukarna inte drog någon nytta av veteaffären, utan att det endast var de exporterande spannmålsföretagen som gjorde vinster på detta.
”The Big Grain Robbery” är ett perfekt exempel på vad som händer när utbud och efterfrågan kullkastas på spannmålsmarknaderna.
1987 kom Sovjetunionen tillbaka till spannmålsbörserna
1987 kom sedan Sovjetunionen tillbaka till de globala spannmålsmarknaderna och genomförde tillsammans med Reaganadministrationen en ny affär i amerikanskt vete. Sovjetunionen köpte då fyra miljoner ton motsvarande 147 miljoner bushels, av det amerikanska vetet. Detta vete motsvarade cirka åtta procent av det amerikanska veteöverskottet på 1,88 miljarder bushels vete.
Hur kunde detta ske?
Under hela det kalla kriget, hade de ryska bönderna utmaningar i form av det ryska klimatet och de tvivelaktiga sovjetiska jordbruksmetoderna, något som gjorde missväxt till ett regelbundet förekommande inslag i Sovjetunionen. Detta gjorde också förekomsten av sovjetiska spannmålshandlare på råvarumarknaderna till något vanligt förekommande. De sovjetiska spannmålshandlarna agerade då oftast som köpare eftersom den sovjetiska ledningen alltid haft svårt att tillhandahålla tillräckliga mängder baslivsmedel till sin befolkning.
Händelserna som kom att utmynna i det som kallades The Great grain robbery inträffade inom loppet av några veckor, och de amerikanska myndigheterna hade ingen aning, eller någon annan heller för den delen, att Sovjet hade drabbats av en akut livsmedelskris som en följd av situationen i landets jordbruksindustri. Det var inte heller allmänt känt att de sovjetiska spannmålshandlarna genomförde små, men tillsammans omfattande inköp av spannmål på råvarubörserna. Hur kunde detta hända? I dag finns det ett stort antal satelliter som cirkulerar runt jorden som fotograferar de områden där spannmål odlas, men på 1970-talet var det få råvaruhandlare som hade direktkontakt med de sovjetiska jordbrukarna. Den tidens satelliter kunde inte heller visa de skador som förorsakats av torka, insekter eller sjukdomar.


Some rebound but not much. Brent crude rebounded 1.5% yesterday to $65.47/b. This morning it is inching 0.2% up to $65.6/b. The lowest close last week was on Thursday at $64.11/b.

The curve structure is almost as week as it was before the weekend. The rebound we now have gotten post the message from OPEC+ over the weekend is to a large degree a rebound along the curve rather than much strengthening at the front-end of the curve. That part of the curve structure is almost as weak as it was last Thursday.
We are still on a weakening path. The message from OPEC+ over the weekend was we are still on a weakening path with rising supply from the group. It is just not as rapidly weakening as was feared ahead of the weekend when a quota hike of 500 kb/d/mth for November was discussed.
The Brent curve is on its way to full contango with Brent dipping into the $50ies/b. Thus the ongoing weakening we have had in the crude curve since the start of the year, and especially since early June, will continue until the Brent crude oil forward curve is in full contango along with visibly rising US and OECD oil inventories. The front-month Brent contract will then flip down towards the $60/b-line and below into the $50ies/b.
At what point will OPEC+ turn to cuts? The big question then becomes: When will OPEC+ turn around to make some cuts? At what (price) point will they choose to stabilize the market? Because for sure they will. Higher oil inventories, some more shedding of drilling rigs in US shale and Brent into the 50ies somewhere is probably where the group will step in.
There is nothing we have seen from the group so far which indicates that they will close their eyes, let the world drown in oil and the oil price crash to $40/b or below.
The message from OPEC+ is also about balance and stability. The world won’t drown in oil in 2026. The message from the group as far as we manage to interpret it is twofold: 1) Taking back market share which requires a lower price for non-OPEC+ to back off a bit, and 2) Oil market stability and balance. It is not just about 1. Thus fretting about how we are all going to drown in oil in 2026 is totally off the mark by just focusing on point 1.
When to buy cal 2026? Before Christmas when Brent hits $55/b and before OPEC+ holds its last meeting of the year which is likely to be in early December.
Brent crude oil prices have rebounded a bit along the forward curve. Not much strengthening in the structure of the curve. The front-end backwardation is not much stronger today than on its weakest level so far this year which was on Thursday last week.

The front-end backwardation fell to its weakest level so far this year on Thursday last week. A slight pickup yesterday and today, but still very close to the weakest year to date. More oil from OPEC+ in the coming months and softer demand and rising inventories. We are heading for yet softer levels.

Down to the lowest since early May. Brent crude has fallen sharply the latest four days. It closed at USD 64.11/b yesterday which is the lowest since early May. It is staging a 1.3% rebound this morning along with gains in both equities and industrial metals with an added touch of support from a softer USD on top.
What stands out the most to us this week is the collapse in the Dubai one to three months time-spread.
Dubai is medium sour crude. OPEC+ is in general medium sour crude production. Asian refineries are predominantly designed to process medium sour crude. So Dubai is the real measure of the balance between OPEC+ holding back or not versus Asian oil demand for consumption and stock building.
A sharp weakening of the front-end of the Dubai curve. The front-end of the Dubai crude curve has been holding out very solidly throughout this summer while the front-end of the Brent and WTI curves have been steadily softening. But the strength in the Dubai curve in our view was carrying the crude oil market in general. A source of strength in the crude oil market. The core of the strength.
The now finally sharp decline of the front-end of the Dubai crude curve is thus a strong shift. Weakness in the Dubai crude marker is weakness in the core of the oil market. The core which has helped to hold the oil market elevated.
Facts supports the weakening. Add in facts of Iraq lifting production from Kurdistan through Turkey. Saudi Arabia lifting production to 10 mb/d in September (normal production level) and lifting exports as well as domestic demand for oil for power for air con is fading along with summer heat. Add also in counter seasonal rise in US crude and product stocks last week. US oil stocks usually decline by 1.3 mb/week this time of year. Last week they instead rose 6.4 mb/week (+7.2 mb if including SPR). Total US commercial oil stocks are now only 2.1 mb below the 2015-19 seasonal average. US oil stocks normally decline from now to Christmas. If they instead continue to rise, then it will be strongly counter seasonal rise and will create a very strong bearish pressure on oil prices.
Will OPEC+ lift its voluntary quotas by zero, 137 kb/d, 500 kb/d or 1.5 mb/d? On Sunday of course OPEC+ will decide on how much to unwind of the remaining 1.5 mb/d of voluntary quotas for November. Will it be 137 kb/d yet again as for October? Will it be 500 kb/d as was talked about earlier this week? Or will it be a full unwind in one go of 1.5 mb/d? We think most likely now it will be at least 500 kb/d and possibly a full unwind. We discussed this in a not earlier this week: ”500 kb/d of voluntary quotas in October. But a full unwind of 1.5 mb/d”
The strength in the front-end of the Dubai curve held out through summer while Brent and WTI curve structures weakened steadily. That core strength helped to keep flat crude oil prices elevated close to the 70-line. Now also the Dubai curve has given in.

Brent crude oil forward curves

Total US commercial stocks now close to normal. Counter seasonal rise last week. Rest of year?

Total US crude and product stocks on a steady trend higher.

Analys
OPEC+ will likely unwind 500 kb/d of voluntary quotas in October. But a full unwind of 1.5 mb/d in one go could be in the cards
Down to mid-60ies as Iraq lifts production while Saudi may be tired of voluntary cut frugality. The Brent December contract dropped 1.6% yesterday to USD 66.03/b. This morning it is down another 0.3% to USD 65.8/b. The drop in the price came on the back of the combined news that Iraq has resumed 190 kb/d of production in Kurdistan with exports through Turkey while OPEC+ delegates send signals that the group will unwind the remaining 1.65 mb/d (less the 137 kb/d in October) of voluntary cuts at a pace of 500 kb/d per month pace.
Signals of accelerated unwind and Iraqi increase may be connected. Russia, Kazakhstan and Iraq were main offenders versus the voluntary quotas they had agreed to follow. Russia had a production ’debt’ (cumulative overproduction versus quota) of close to 90 mb in March this year while Kazakhstan had a ’debt’ of about 60 mb and the same for Iraq. This apparently made Saudi Arabia angry this spring. Why should Saudi Arabia hold back if the other voluntary cutters were just freeriding? Thus the sudden rapid unwinding of voluntary cuts. That is at least one angle of explanations for the accelerated unwinding.
If the offenders with production debts then refrained from lifting production as the voluntary cuts were rapidly unwinded, then they could ’pay back’ their ’debts’ as they would under-produce versus the new and steadily higher quotas.
Forget about Kazakhstan. Its production was just too far above the quotas with no hope that the country would hold back production due to cross-ownership of oil assets by international oil companies. But Russia and Iraq should be able to do it.
Iraqi cumulative overproduction versus quotas could reach 85-90 mb in October. Iraq has however steadily continued to overproduce by 3-5 mb per month. In July its new and gradually higher quota came close to equal with a cumulative overproduction of only 0.6 mb that month. In August again however its production had an overshoot of 100 kb/d or 3.1 mb for the month. Its cumulative production debt had then risen to close to 80 mb. We don’t know for September yet. But looking at October we now know that its production will likely average close to 4.5 mb/d due to the revival of 190 kb/d of production in Kurdistan. Its quota however will only be 4.24 mb/d. Its overproduction in October will thus likely be around 250 kb/d above its quota with its production debt rising another 7-8 mb to a total of close to 90 mb.
Again, why should Saudi Arabia be frugal while Iraq is freeriding. Better to get rid of the voluntary quotas as quickly as possible and then start all over with clean sheets.
Unwinding the remaining 1.513 mb/d in one go in October? If OPEC+ unwinds the remaining 1.513 mb/d of voluntary cuts in one big go in October, then Iraq’s quota will be around 4.4 mb/d for October versus its likely production of close to 4.5 mb/d for the coming month..
OPEC+ should thus unwind the remaining 1.513 mb/d (1.65 – 0.137 mb/d) in one go for October in order for the quota of Iraq to be able to keep track with Iraq’s actual production increase.
October 5 will show how it plays out. But a quota unwind of at least 500 kb/d for Oct seems likely. An overall increase of at least 500 kb/d in the voluntary quota for October looks likely. But it could be the whole 1.513 mb/d in one go. If the increase in the quota is ’only’ 500 kb/d then Iraqi cumulative production will still rise by 5.7 mb to a total of 85 mb in October.
Iraqi production debt versus quotas will likely rise by 5.7 mb in October if OPEC+ only lifts the overall quota by 500 kb/d in October. Here assuming historical production debt did not rise in September. That Iraq lifts its production by 190 kb/d in October to 4.47 mb/d (August level + 190 kb/d) and that OPEC+ unwinds 500 kb/d of the remining quotas in October when they decide on this on 5 October.


Oljepriset faller efter ny handelskonflikt mellan USA och Kina

Christian Kopfer kommenterar guld, koppar, olja och stål, samt några råvarubolag

Silver spränger den magiska gränsen, kostar nu över 50 USD per uns

Blykalla, Evroc och Studsvik vill bygga kärnkraftsdrivna datacenter i Sverige

Toppmöte om framtidens kärnkraft runt Östersjön hölls idag

Mahvie Minerals i en guldtrend
Volatile but going nowhere. Brent crude circles USD 66 as market weighs surplus vs risk

Aktier i guldbolag laggar priset på guld

Kinas elproduktion slog nytt rekord i augusti, vilket även kolkraft gjorde

Tyskland har så höga elpriser att företag inte har råd att använda elektricitet
-
 Nyheter4 veckor sedan
Mahvie Minerals i en guldtrend
-
Analys4 veckor sedan
Volatile but going nowhere. Brent crude circles USD 66 as market weighs surplus vs risk
-
 Nyheter4 veckor sedan
Aktier i guldbolag laggar priset på guld
-
 Nyheter4 veckor sedan
Kinas elproduktion slog nytt rekord i augusti, vilket även kolkraft gjorde
-
Nyheter4 veckor sedan
Tyskland har så höga elpriser att företag inte har råd att använda elektricitet
-

 Nyheter4 veckor sedan
Guld når sin högsta nivå någonsin, nu även justerat för inflation
-

 Nyheter4 veckor sedan
Det stigande guldpriset en utmaning för smyckesköpare
-

 Nyheter3 veckor sedan
Ett samtal om guld, olja, fjärrvärme och förnybar energi