

Analys
Crude oil comment – Violent moves on the back of noisy fundamentals

 Crude oil comment – Violent moves on the back of noisy fundamentals
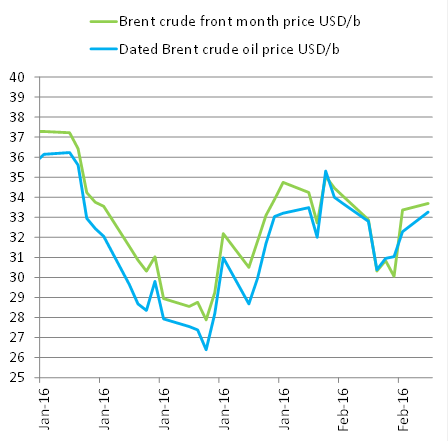
- Graph 1: Brent crude oil price did not challenge the low from January
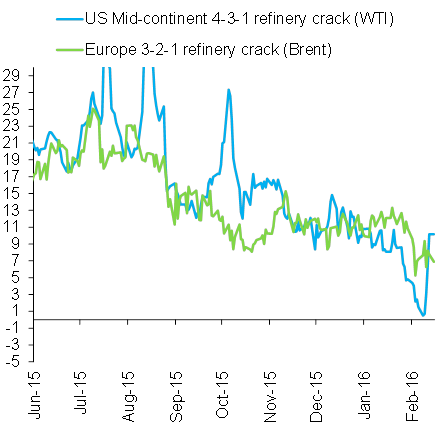
- Graph 2: US mid-Continental cracks declines to almost zero before cuts in refinery runs lifts the crack back up
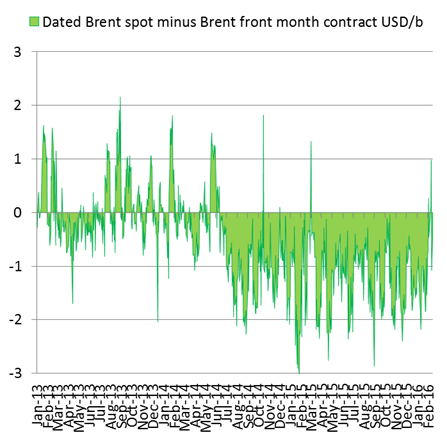
- Graph 3: Dated Brent price moved to a one dollar premium to Brent front month
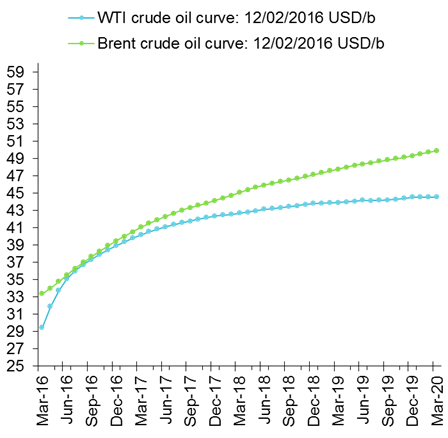
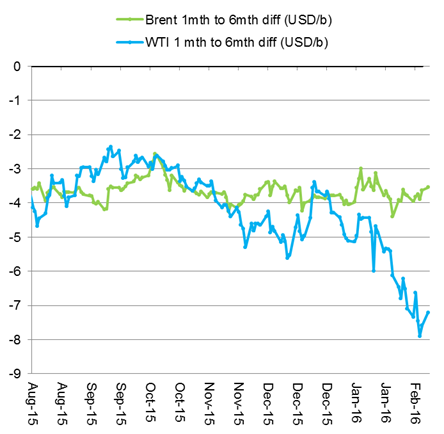
- Graph 4: Brent curve with reduced contango, but WTI curve shouts: “Store your oil somewhere else. We are full and it is expensive to store oil here”
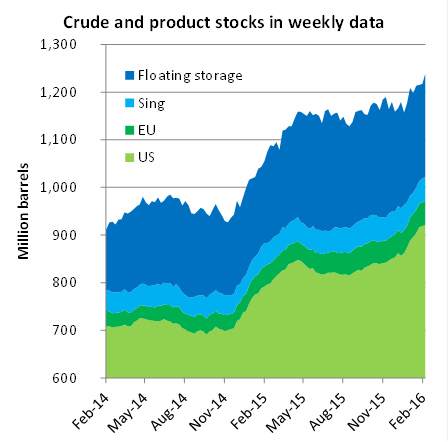
- Graph 5: Global oil inventories are still rising quite solidly
- Graph 6: Temporary softer Contango likely to deepen again in both the Brent and the WTI curve
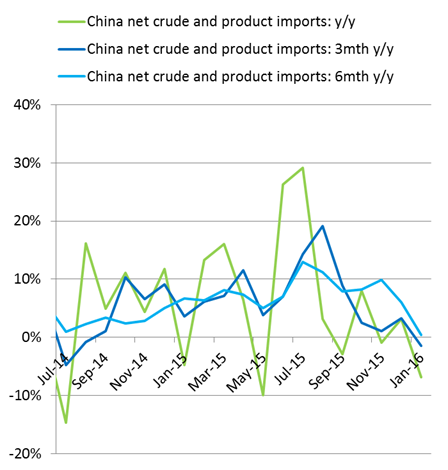
- Graph 7: Disappointing net crude and product imports to China for January (down 6.8% y/y in Jan)
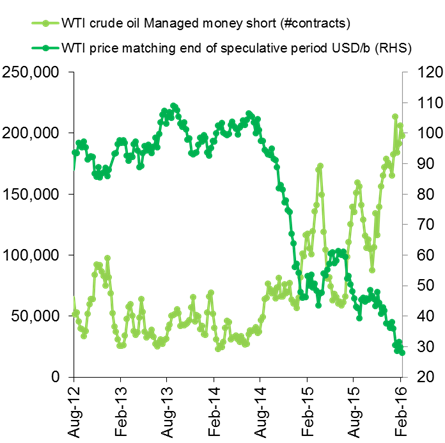
- Graph 8: Speculative short positions in WTI are close to record high – makes a setting for violent false rallies
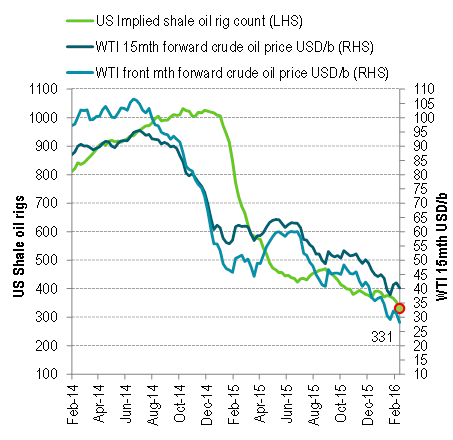
- Graph 9: US rig count is falling steeply in response to lower prices
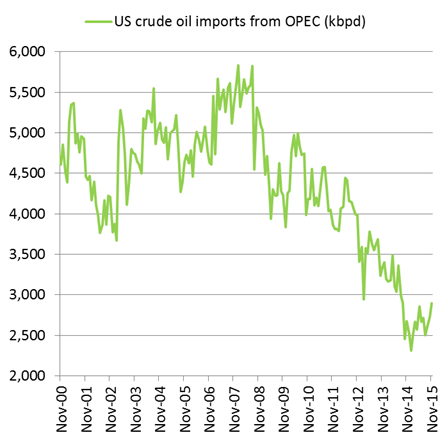
- Graph 10: US crude oil imports from OPEC on the rise
Crude oil comment – Violent moves
Brent crude oil gained 11% to $33.36/b and WTI gained 12.3% to $29.44/b on Friday. And on what? It was not all that easy to identify, but there are of course a few moving parts which can be pieced together. One bearish driving force lately has been the deteriorating refining cracks in both Europe and the US. US refining margins in the US mid-continent almost went to zero recently as crude oil surplus increasingly has been transferred to a product surplus. This steep decline signalled a reduction in refining activity both in the US and in Europe ahead which would lead to increased stock building of crude oil. This would be especially acute in the US mid-continent with already high inventories. This is especially so in Cushing Oklahoma where stocks are close to maximum capacity. After having moved almost to zero on Monday a week ago the mid-continent cracks did however move into a solid recovery lifted by stronger product prices in the US in response to reduced refining activity. This probably did give some support to crude oil prices as well.
Another element was that the Dated Brent spot price moved to a one dollar premium to the front month Brent crude oil contract in a sign of some kind of temporary tightness in the physical crude oil market in the North Sea. The spot price has been in solid discount to the Brent 1 month price all since the global crude oil market moved into surplus in mid-2014. We do think that this supportiveness in the Dated Brent price is of temporary nature due to the still robust global stock building.
The exact details for what drove Dated Brent to a premium of front month Brent last week we don’t know. Typically these events are connected to balance and trading of physical cargoes. It was the biggest mark-up for Dated over the front month contract since March 2015 and clearly gave some bullish impetus to the financially traded oil market at the end of last week. The Dated Brent price is now however back to half a dollar discount to the front month price. The average discount has however been more than one dollar since mid-2014. Also today we have this slight bend in the Brent forward curve as a reflection of some kind of physical tightness in the Brent crude oil market and the Dated price has still not moved back to its “normal” one dollar discount to the front month price which has been the norm since mid-2014.
We believe that we are still in the midst of a stock building phase with growing oil inventories and deepening contango with still some time to go. However, we are also in a rebalancing period. What drove down US crude oil imports from 2007 was declining demand to start with. Thereafter imports declined yet further as US shale oil production rallied from 2011 onwards. US oil consumption is now instead increasing while US crude oil production is declining even though not steeply. US imports of crude oil from OPEC has now probably bottomed out and the tide is gradually turning towards a rise in imports instead.
For now however, we are still amidst a global stock building situation with a solid running surplus of oil. At least that is the calculation. One always needs to be humble to the fact that one do not really know the actual oil market balance. We have partial information about the supply/demand balance as well as global oil inventories. Oil prices however we do know and they are a reflection of both financial flows as well as physical fundamentals. The price picture can however be quite deceiving due to temporary effects and financial flows. The firming Dated Brent price versus the front month price is typically something which we would witness once the market starts to firm up. As such it is important to take note of last week’s event as well as today’s also fairly small Dated discount to the front month contract. For now however we believe it is a temporary event rather than signalling the start of a rapidly tightening situation.
The big jump in crude oil prices we experienced end of last week may have been instigated by changes in refining margins or physical spot prices or rumours for potential joint production cuts by OPEC and Russia. However, the magnitude of bounce was clearly driven by financial flows and potentially short covering. Speculative short positions (as depicted by shorts by managed money) are very high. Thus price moves to the upside are likely to be violent due to short covering when they happen.
Brent crude oil price did not challenge the low from January
US mid-Continental cracks declines to almost zero before cuts in refinery runs lifts the crack back up
Dated Brent price moved to a one dollar premium to Brent front month
Probably on the back of temporary tightness on the back of physical trading of cargoes.
Brent curve with reduced contango, but WTI curve shouts: “Store your oil somewhere else. We are full and it is expensive to store oil here”
Thus reduced US oil imports and softer stock building in the US may be the consequence.
It basically means that stock building will have to take place somewhere else.
Global oil inventories are still rising quite solidly
There is little sign of any weakening in the current ongoing stock building.
Thus the recent reduction in contango should be temporary.
Floating storage is mostly oil in transit rather than financially driven deliberate storage of oil
Temporary softer Contango likely to deepen again in both the Brent and the WTI curve
Disappointing net crude and product imports to China for January
Y/y it declined 6.8%. For 3 mth y/y it declined 1.4% and 6mth y/y only saw a growth of 0.4%
Speculative short positions in WTI are close to record high – makes a setting for violent false rallies
Thus short covering kicking in when the oil price ticks higher is likely to lead to moves in prices like we saw end of last week
US rig count is falling steeply in response to lower prices
US oil rigs have declined by 99 rigs over the last seven weeks while implied US shale oil rigs have declined by 61 rigs. This loss of 61 shale oil rigs cuts some 200 – 250 kbpd from the supply balance on a 12 mths horizon.
US crude oil imports from OPEC on the rise
Kind regards
Bjarne Schieldrop
Chief analyst, Commodities
SEB Markets
Merchant Banking
Market is starting to take US/Iran headlines with a pinch of salt. Brent crude rose $2.8/b yesterday to an official close of $112.1/b. But after that it traded as low as $108.05/b before ending late night at around $109.7/b. Through the day it traded in a range of $106.87 – 112.72/b amid a flurry of news or rumors from Iran and the US. ”US temporary sanctions during negotiations” (falls alarm). ”We will bomb Iran” (not anyhow),… etc. While the market is still fluctuating to this kind of news flow, it is starting to take such headlines with a pinch of salt.

We’ll see. Maybe, maybe not. The Brent M1 contract is trading at $110.2/b this morning which very close to the average ticks through yesterday of $110.4/b.
Trump with bearish, verbal intervention whenever Brent trades above $110/b it seems. What seems to be a pattern is that Trump states something like ”very good negotiations going on with Iran”, ”New leaders in Iran are great,..”, ”Great progress in negotiations,…”, ”Deal in sight,..” etc whenever the Brent M1 contract trades above $110/b. An effort to cool the market. These hot air verbal interventions from Trump used to have a heavy bearish impact on prices, but they now seems to have less and less effect unless they are backed by reality.
As far as we can see there has been no real progress in the negotiations between the US and Iran with both sides still standing by their previous demands.
Iran is getting stronger while the cease fire lasts making a return to war for Trump yet harder. Iran is naturally in constant preparation for a return to war given Trump’s steady threats of bombing Iran again. Iran is naturally doing what ever is possible to prepare for a return to war. And every day the cease fire lasts it is better prepared. This naturally makes it more and more difficult and dangerous for the US to return to warring activity versus Iran as the consequences for energy infrastructure in the Persian Gulf will be more and more severe the longer the cease fire lasts. Israel seems to see it this way as well. That the war is not won and that current frozen state of a cease fire gives Iran opportunity to rebuild military and politically.
Global inventories are drawing down day by day. How much? In the meantime the Strait of Hormuz stays closed. There is varying measures and estimates of how much global inventories are drawing down. Our rough estimate, back of the envelope, is that global inventories are drawing down by at least some 10 mb/d or about 300 mb/d in a balance between loss of supply versus demand destruction. Other estimates we see are a monthly draw of 250-270 mb/d. The IEA only ’measured’ a draw in global observable stocks of 117 mb in April with oil on water rising 53 mb while on shore stocks fell 170 mb. But global stocks are hard to measure with large invisible, unmeasured stocks. As such a back of the envelope approach may be better.
Oil products is what the world is consuming. Oil product prices likely to rise while product stocks fall. Strategic Petroleum Reserves (SPR) are predominantly crude oil. Discharging oil from OECD SPR stocks, a sharp reduction in Chinese crude imports and a reduction in global refinery throughput of 6-7 mb/d has helped to keep crude oil markets satisfactorily supplied. But global inventories are drawing down none the less. And oil products is really what the world is consuming. So if global refinery throughput stays subdued, then demand will eventually have to match the supply of oil products. The likely path forward this summer is a steady draw down in jet fuel, diesel and gasoline. Higher prices for these. Then, if possible, higher refinery throughput and higher usage of crude in response to very profitable refinery margins. And lastly sharper draw in crude stocks and higher prices for these. But some 6 mb/d of oil products used to be exported through the Strait of Hormuz. And it may not be so easy to ramp up refinery activity across the world to compensate. Especially as Ukraine continues to damage Russian refineries as well as Russian crude production and export facilities.
Watch oil product stocks and prices as well as Brent calendar 2027. What to watch for this summer is thus oil product inventories falling and oil product premiums to crude rising. Another measure to watch is the Brent crude 2027 contract as it rises steadily day by day as the Strait of Hormuz stays closed and global oil inventories decline. The latter is close to the highest level since the start of the war and keeps rising.
The Brent M1 contract and the Brent 2027 prices and current price of jet fuel in Europe (ARA). All in USD/b

Our back of the envelope calculation of the global shortage created by the closure of the Strait of Hormuz. Note that 3.5 mb/d of discharge from SPR is also a draw. Note also that ’Forced demand loss’ of 2.5 mb/d is probably temporary and will fall back towards zero as logistics are sorted out leaving ’Price demand loss’ to do the job of balancing the market. Thus a shortfall of at least 9 mb/d created by the closure. More if SPR discharge is included and more if Forced demand loss recedes.

Brent is climbing higher. Front-month is at USD 106.3/bl this morning, close to a weekly high and a USD 9/bl jump from Mondays open. This is the move we flagged as a risk earlier in the week: the market shifting from ”a deal is around the corner” to ”this is going to take longer than we thought”.

Analyst Commodities, SEB
During April, rest-of-year Brent remained remarkably stable around USD 90/bl. A stability which rested on one single assumption: the SoH reopens around 1 May. That assumption is now slowly falling apart.
As we highlighted yesterday: every week of delay beyond 1 May adds (theoretically) ish USD 5/bl to the rest-of-year average, as global inventories draw 100 million barrels per week. i.e., a mid-May reopening implies rest-of-year Brent closer to USD 100/bl, and anything pushing into June or July takes us meaningfully higher.
What’s changed in the last 48 hours:
#1: The US military has formally warned that clearing suspected sea mines from SoH could take up to six months. That is a completely different timescale from what the financial market is pricing. Even a political deal tomorrow does not immediately reopen the strait.
#2: Trump has shifted his tone from urgency to ”strategic patience”. In yesterday’s press conference: ”Don’t rush me… I want a great deal.” The market is reading this as a president no longer feeling pressured by timelines, with the naval blockade running in the background.
#3: So far, the military activity is escalating, not de-escalating. Axios reports Iran is laying more mines in SoH. The US 3rd carrier strike group (USS George H.W. Bush) is arriving with two countermine vessels. Trump yesterday ordered the US Navy to destroy any Iranian boats caught laying mines. While CNN reports that the Pentagon is actively drawing up plans to strike Iranian SoH capabilities and individual Iranian military leaders if the ceasefire collapses. i.e., NOT a attitude consistent with an imminent deal!
Spot crude and product prices eased off the early-April highs on a combination of system rerouting and deal optimism. Both now weakening. Goldman estimates April Gulf output is reduced by 14.5 mbl/d, or 57% of pre-war supply, a number that keeps getting worse the longer this drags on.
Demand-side adaptation is ongoing: S. Korea has cut its Middle East crude dependence from 69% to 56% by pulling more from the Americas and Africa, and Japan is kicking off a second round of SPR releases from 1 May. But SPRs are finite.
Ref. to the negotiations, we should not bet on speed. The current Iranian leadership is dominated by genuine hardliners willing to absorb economic pain and run the clock to extract concessions. That is not a setup for a rapid resolution. US/Israeli media briefings keep framing the delay as ”internal Iranian divisions”, the reality is more complicated and points toward weeks and months, not days.
Our point is that the complexity is large, and higher prices have only just started (given a scenario where the negotiations drag out in time). The market spent April leaning on the USD 90/bl rest-of-year assumption; that case is diminishing by the hour. If ”early May reopening” is replaced by ”June, July or later” over the next week or two, both crude and products have meaningful room to reprice higher from here. There is a high risk being short energy and betting on any immediate political resolution(!).
Down on Friday. Up on Monday. The Brent June crude oil contract traded down 5.1% last week to a close of $90.38/b. It reached a high of $103.87/b last Monday and a low of $86.09/b on Friday as Iran announced that the Strait of Hormuz was fully open for transit. That quickly changed over the weekend as the US upheld its blockade of Iranian oil exports while Iran naturally responded by closing the SoH again. The US blew a hole in the engine room of the Iranian ship TOUSKA and took custody of the ship on Sunday. Brent crude is up 5.6% this morning to $95.4/b.
The cease-fire is expiring tomorrow. The US has said it will send a delegation for a second round of negotiations in Islamabad in Pakistan. But Iran has for now rejected a second round of talks as it views US demands as unrealistic and excessive while the US is also blocking the Strait of Hormuz.
While Brent is up 5% this morning, the financial market is still very optimistic that progress will be made. That talks will continue and that the SoH will fully open by the start of May which is consistent with a rest-of-year average Brent crude oil price of around $90/b with the market now trading that balance at around $88/b.
Financial optimism vs. physical deterioration. We have a divergence where the financial market is trading negotiations, improvements and resolution while at the same time the physical market is deteriorating day by day. Physical oil flows remain constrained by disrupted flows, longer voyage times and elevated freight and insurance costs.
Financial markets are betting that a US/Iranian resolution will save us in time from violent shortages down the road. But every day that the SoH remains closed is bringing us closer to a potentially very painful point of shortages and much higher prices.
The US blockade is also a weapon of leverage against its European and Asian allies. When Iran closed the SoH it held the world economy as a hostage against the US. The US blockade of the SoH is of course blocking Iranian oil exports. But it is also an action of disruption directed towards Europe and Asia. The US has called for the rest of the world to engaged in the war with Iran: ”If you want oil from the Persian Gulf, then go and get it”. A risk is that the US plays brinkmanship with the global oil market directed towards its European and Asian allies and maybe even towards China to force them to engage and take part. Maybe unthinkable. But unthinkable has become the norm with Trump in the White House.


Oil product price pain is set to rise as the Strait of Hormuz stays closed into summer

Solkraften pressar elpriserna dagtid

Michel Gubel ger sin syn på oljemarknaden


