

Analys
Comfort zone for OPEC+ in 2024 as fundamentals gradually improve in its favor

Back to its sideways trade range and inching almost unnoticeable higher as the year progresses. Brent crude is up 0.2% this morning to USD 82.7/b along with copper (+0.3%) and Shanghai equities (+1.0%). Brent crude saw some bearish action at the end of last week but it recovered a good portion of that ydy (+1.1%) and then a little more again this morning. With this it has mostly returned back to its sideways trading pattern.

Brent crude averaged USD 79.1/b in January. So far in February it has averaged USD 81.5/b and at the moment it trades at USD 82.7/b. Typical market comments these days are along the theme ”looking for direction” or ”waiting for new signals on supply or demand”. But other comments are more attuned to a view that the direction is indeed sideways this year. Argus last week describe the outlook for the supply/demand balance for 2024 as ”almost perfectly aligned” and Goldman adds to this view in a note yesterday with ”oil set to extend its tight trading range”.
Cease-fire in Gaza on Monday 4 March may create a buying opportunity. News this morning is Biden expressing hopes that a cease-fire in Gaza may start as soon as Monday next week. In our view there is basically zero risk premium in the current oil price due to Middle East tensions. So if the oil price sells off on firm news of a cease-fire, then it is probably a good buying opportunity in our view.
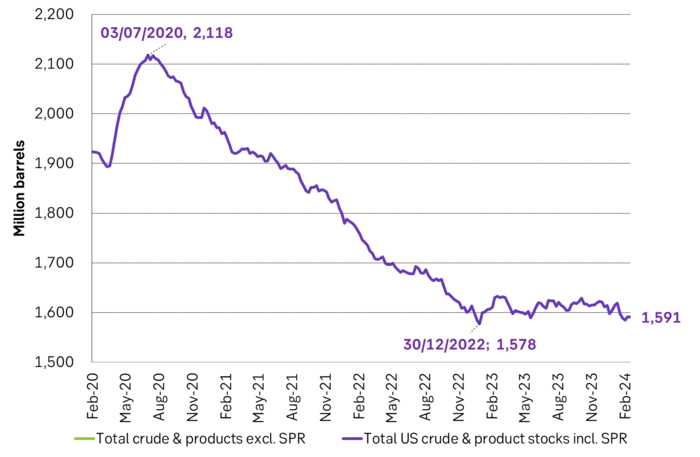
We maintain our strong view of an average Brent crude oil price of USD 85/b in 2024. Total US crude and product stocks including SPR has gone flat sideways since the end of 2022, all through 2023 and has continued to do so in 2023. US oil inventories are below where they were one year ago both when SPR is included and excluded. This is a reflection of a global oil market in balance though OPEC+ has indeed been the balancing agent.
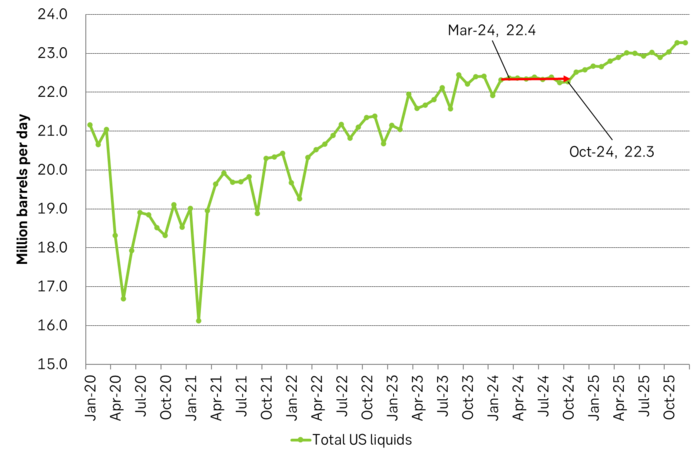
For the year to come, total US hydrocarbon liquids production is forecast by the US EIA to go flat sideways until October this year and in Q4-24 US production is forecast to be only 0.1 m b/d above Q4-23. So no damaging super-growth from the US to kill the oil party this year. In its last monthly report the US EIA actually reduced its forecast for US production by 100 k b/d to 22.3 m b/d (all liquids included). Russia’s energy minister, Nikolay Shulginov, stated in Tass news agency recently that he expects Russian oil production to decline to 530 mn ton in 2024 from 523 mn ton in 2023. That’s a decline of 1.3% YoY and would equate to a decline of 120-130 k b/d decline YoY. So neither of these oil producing giants are set to unsettle the global oil market this year with too much supply.
Demand growth looks set to be a normal 1.3 m b/d in 2024. The most bearish on oil demand growth is probably the IEA which predicts demand to grow on by 1.2 m b/d YoY in 2024. The US EIA expects demand to grow by 1.4 m b/d. But if we look closer at the numbers from the IEA it expects demand to rise by 1.6 m b/d YoY from Q4-23 to Q4-24. Together with muted supply from both the US and Russia this year this all sums up to a gradually rising need for oil from OPEC through 2024. This made us write the headline ”Better and better every day” in a crude oil comment in late January. Demand for oil from OPEC doesn’t look stellar. But it looks set to be better and better through the year and that is most definitely a great comfort zone for OPEC+.
Sideways, yes, but normal trade range around the mean is still usually +/- USD 20/b. Amid all the current calmness, let us still not forget that Brent crude usually trades in a range through the year of +/- USD 20/b around the mean as there are always some surprises along the way. We don’t think that the situation in the Middle East will spiral out of control into an all-out regional war involving Iran and resulting in large losses of oil supply to the market. And we don’t think there are much risk premium in current oil prices related to this either. But at times in 2024 it may look like it might happen. And that’s probably when you would see the high price point of the year. Maybe as high as USD 105/b. On the bearish we do not think that we’ll have a major economic slowdown or a recession in 2024. But at times in 2024 it may look like we are about to tip into a major slowdown and that would probably be when you’d see the low price point of the year. Maybe as low as USD 65/b.
Total US crude and product stocks incl. SPR has gone sideways since end of 2022, all through 2023 and so far in 2024. Currently it is only 13 m b above the low-point in late 2022!
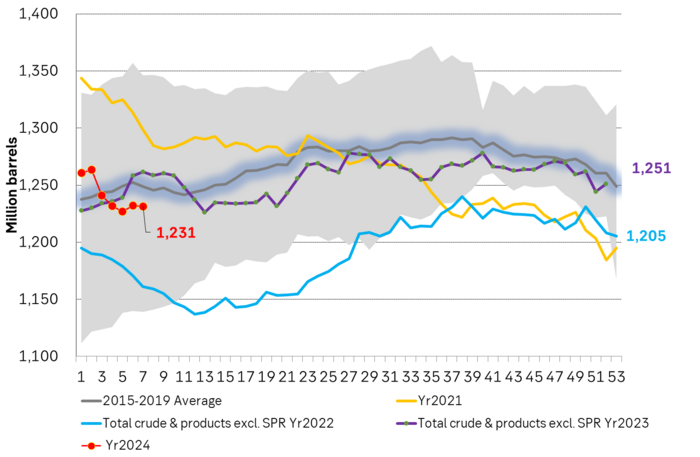
Commercial US crude and product stocks are below normal and below last year.
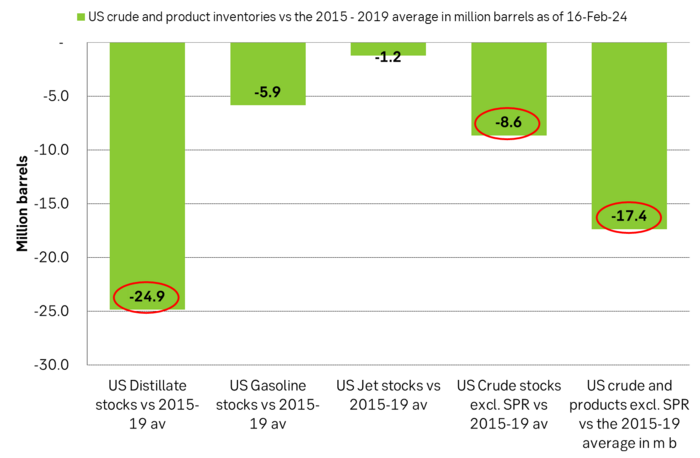
US Commercial oil inventories vs. the 2015-19 average. Still struggling with a significant deficit of middle distillates.
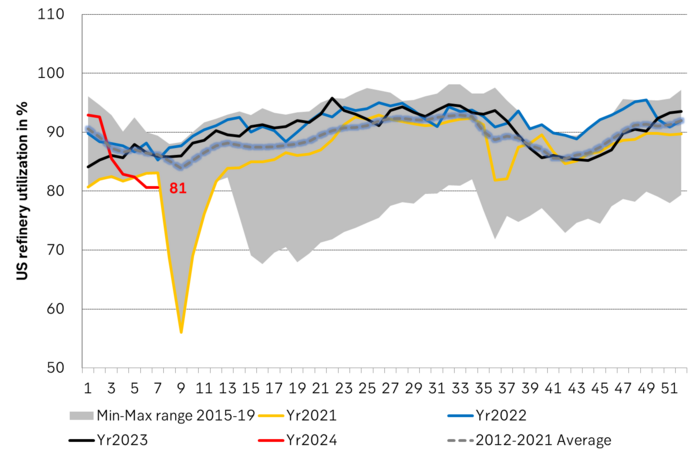
US refinery utilization at very low level vs. normal. Extensive maintenance this spring is expected. Result will be low production of oil products, falling inventories of oil products, higher refining margins but also rising crude stocks.
US EIA forecast for total US liquids production. To go sideways in 2024 to Oct-2024.
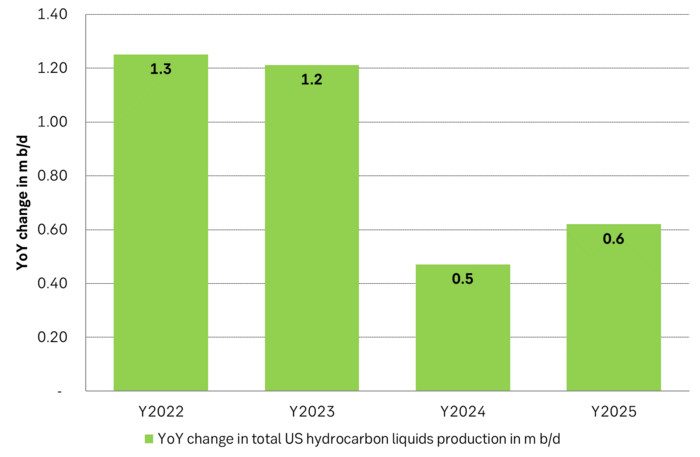
Strong growth in US supply in 2022 and 2023. But 2024 is only set to grow 0.5 m b/d YoY on average. The growth in 2024 is in part a result of production in 2023 starting low and ending high. But from Jan to Oct 2024 US production will go sideways and only rise by 0.1 m b/d YoY from Q4-23 to Q4-24.
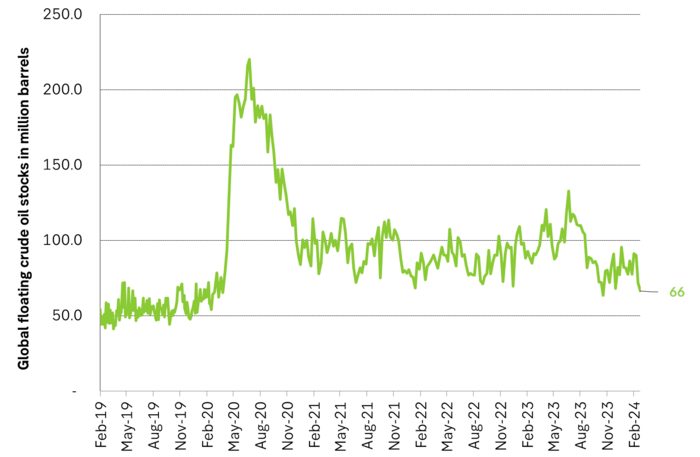
Global floating crude stocks at 66 m b and not too far above the more normal 50 m b level.
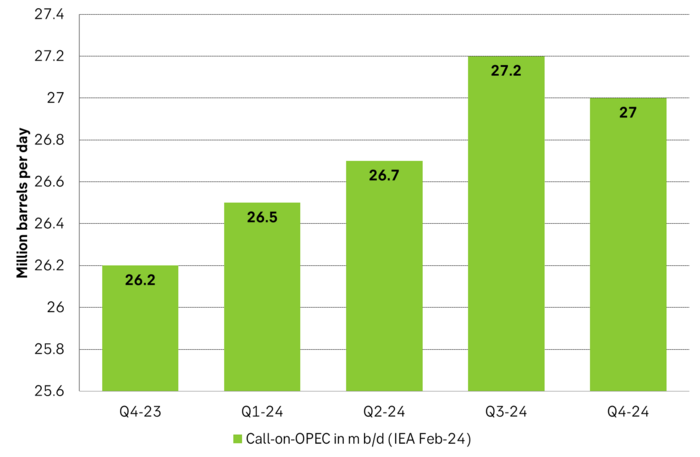
IEA Feb-2024 OMR: Call-on-OPEC is rising gradually through 2024. Better and better for OPEC every quarter to Q3-24
Brent crude has climbed roughly USD 1.5-2 per barrel since Friday, yet falling USD 0.3 per barrel this mornig and currently trading near USD 67.25/bbl after yesterday’s climb. While the rally reflects short-term geopolitical tension, price action has been choppy, and crude remains locked in a broader range – caught between supply-side pressure and spot resilience.

Prices have been supported by renewed Ukrainian drone strikes targeting Russian infrastructure. Over the weekend, falling debris triggered a fire at the 20mtpa Kirishi refinery, following last week’s attack on the key Primorsk terminal.
Argus estimates that these attacks have halted ish 300 kbl/d of Russian refining capacity in August and September. While the market impact is limited for now, the action signals Kyiv’s growing willingness to disrupt oil flows – supporting a soft geopolitical floor under prices.
The political environment is shifting: the EU is reportedly considering sanctions on Indian and Chinese firms facilitating Russian crude flows, while the U.S. has so far held back – despite Bessent warning that any action from Washington depends on broader European participation. Senator Graham has also publicly criticized NATO members like Slovakia and Hungary for continuing Russian oil imports.
It’s worth noting that China and India remain the two largest buyers of Russian barrels since the invasion of Ukraine. While New Delhi has been hit with 50% secondary tariffs, Beijing has been spared so far.
Still, the broader supply/demand balance leans bearish. Futures markets reflect this: Brent’s prompt spread (gauge of near-term tightness) has narrowed to the current USD 0.42/bl, down from USD 0.96/bl two months ago, pointing to weakening backwardation.
This aligns with expectations for a record surplus in 2026, largely driven by the faster-than-anticipated return of OPEC+ barrels to market. OPEC+ is gathering in Vienna this week to begin revising member production capacity estimates – setting the stage for new output baselines from 2027. The group aims to agree on how to define “maximum sustainable capacity,” with a proposal expected by year-end.
While the IEA pegs OPEC+ capacity at 47.9 million barrels per day, actual output in August was only 42.4 million barrels per day. Disagreements over data and quota fairness (especially from Iraq and Nigeria) have already delayed this process. Angola even quit the group last year after being assigned a lower target than expected. It also remains unclear whether Russia and Iraq can regain earlier output levels due to infrastructure constraints.
Also, macro remains another key driver this week. A 25bp Fed rate cut is widely expected tomorrow (Wednesday), and commodities in general could benefit a potential cut.
Summing up: Brent crude continues to drift sideways, finding near-term support from geopolitics and refining strength. But with surplus building and market structure softening, the upside may remain capped.
Brent crude is essentially flat on the week, but after a volatile ride. Prices started Monday near USD 65.5/bl, climbed steadily to a mid-week high of USD 67.8/bl on Wednesday evening, before falling sharply – losing about USD 2/bl during Thursday’s session.
Brent is currently trading around USD 65.8/bl, right back where it began. The volatility reflects the market’s ongoing struggle to balance growing surplus risks against persistent geopolitical uncertainty and resilient refined product margins. Thursday’s slide snapped a three-day rally and came largely in response to a string of bearish signals, most notably from the IEA’s updated short-term outlook.
The IEA now projects record global oversupply in 2026, reinforcing concerns flagged earlier by the U.S. EIA, which already sees inventories building this quarter. The forecast comes just days after OPEC+ confirmed it will continue returning idle barrels to the market in October – albeit at a slower pace of +137,000 bl/d. While modest, the move underscores a steady push to reclaim market share and adds to supply-side pressure into year-end.
Thursday’s price drop also followed geopolitical incidences: Israeli airstrikes reportedly targeted Hamas leadership in Doha, while Russian drones crossed into Polish airspace – events that initially sent crude higher as traders covered short positions.
Yet, sentiment remains broadly cautious. Strong refining margins and low inventories at key pricing hubs like Europe continue to support the downside. Chinese stockpiling of discounted Russian barrels and tightness in refined product markets – especially diesel – are also lending support.
On the demand side, the IEA revised up its 2025 global demand growth forecast by 60,000 bl/d to 740,000 bl/d YoY, while leaving 2026 unchanged at 698,000 bl/d. Interestingly, the agency also signaled that its next long-term report could show global oil demand rising through 2050.
Meanwhile, OPEC offered a contrasting view in its latest Monthly Oil Market Report, maintaining expectations for a supply deficit both this year and next, even as its members raise output. The group kept its demand growth estimates for 2025 and 2026 unchanged at 1.29 million bl/d and 1.38 million bl/d, respectively.
We continue to watch whether the bearish supply outlook will outweigh geopolitical risk, and if Brent can continue to find support above USD 65/bl – a level increasingly seen as a soft floor for OPEC+ policy.
Brent crude makes some gains as Israel’s attack on Hamas in Qatar rattles markets. Brent crude spiked to a high of USD 67.38/b yesterday as Israel made a strike on Hamas in Qatar. But it wasn’t able to hold on to that level and only closed up 0.6% in the end at USD 66.39/b. This morning it is starting on the up with a gain of 0.9% at USD 67/b. Still rattled by Israel’s attack on Hamas in Qatar yesterday. Brent is getting some help on the margin this morning with Asian equities higher and copper gaining half a percent. But the dark cloud of surplus ahead is nonetheless hanging over the market with Brent trading two dollar lower than last Tuesday.

Geopolitical risk premiums in oil rarely lasts long unless actual supply disruption kicks in. While Israel’s attack on Hamas in Qatar is shocking, the geopolitical risk lifting crude oil yesterday and this morning is unlikely to last very long as such geopolitical risk premiums usually do not last long unless real disruption kicks in.
US API data yesterday indicated a US crude and product stock build last week of 3.1 mb. The US API last evening released partial US oil inventory data indicating that US crude stocks rose 1.3 mb and middle distillates rose 1.5 mb while gasoline rose 0.3 mb. In total a bit more than 3 mb increase. US crude and product stocks usually rise around 1 mb per week this time of year. So US commercial crude and product stock rose 2 mb over the past week adjusted for the seasonal norm. Official and complete data are due today at 16:30.
A 2 mb/week seasonally adj. US stock build implies a 1 – 1.4 mb/d global surplus if it is persistent. Assume that if the global oil market is running a surplus then some 20% to 30% of that surplus ends up in US commercial inventories. A 2 mb seasonally adjusted inventory build equals 286 kb/d. Divide by 0.2 to 0.3 and we get an implied global surplus of 950 kb/d to 1430 kb/d. A 2 mb/week seasonally adjusted build in US oil inventories is close to noise unless it is a persistent pattern every week.
US IEA STEO oil report: Robust surplus ahead and Brent averaging USD 51/b in 2026. The US EIA yesterday released its monthly STEO oil report. It projected a large and persistent surplus ahead. It estimates a global surplus of 2.2 m/d from September to December this year. A 2.4 mb/d surplus in Q1-26 and an average surplus for 2026 of 1.6 mb/d resulting in an average Brent crude oil price of USD 51/b next year. And that includes an assumption where OPEC crude oil production only averages 27.8 mb/d in 2026 versus 27.0 mb/d in 2024 and 28.6 mb/d in August.
Brent will feel the bear-pressure once US/OECD stocks starts visible build. In the meanwhile the oil market sits waiting for this projected surplus to materialize in US and OECD inventories. Once they visibly starts to build on a consistent basis, then Brent crude will likely quickly lose altitude. And unless some unforeseen supply disruption kicks in, it is bound to happen.
US IEA STEO September report. In total not much different than it was in January

US IEA STEO September report. US crude oil production contracting in 2026, but NGLs still growing. Close to zero net liquids growth in total.


Tyskland har så höga elpriser att företag inte har råd att använda elektricitet
Brent crude ticks higher on tension, but market structure stays soft

Kinas elproduktion slog nytt rekord i augusti, vilket även kolkraft gjorde

Det stigande guldpriset en utmaning för smyckesköpare

Aktier i guldbolag laggar priset på guld

Meta bygger ett AI-datacenter på 5 GW och 2,25 GW gaskraftverk
Aker BP gör ett av Norges största oljefynd på ett decennium, stärker resurserna i Yggdrasilområdet
Brent sideways on sanctions and peace talks
Sommarens torka kan ge högre elpriser i höst
Brent edges higher as India–Russia oil trade draws U.S. ire and Powell takes the stage at Jackson Hole
-
 Nyheter4 veckor sedan
Meta bygger ett AI-datacenter på 5 GW och 2,25 GW gaskraftverk
-
 Nyheter4 veckor sedan
Aker BP gör ett av Norges största oljefynd på ett decennium, stärker resurserna i Yggdrasilområdet
-
Analys4 veckor sedan
Brent sideways on sanctions and peace talks
-
 Nyheter4 veckor sedan
Sommarens torka kan ge högre elpriser i höst
-
Analys4 veckor sedan
Brent edges higher as India–Russia oil trade draws U.S. ire and Powell takes the stage at Jackson Hole
-

 Nyheter3 veckor sedan
Mahvie Minerals är verksamt i guldrikt område i Finland
-
Analys3 veckor sedan
Increasing risk that OPEC+ will unwind the last 1.65 mb/d of cuts when they meet on 7 September
-
Analys2 veckor sedan
OPEC+ in a process of retaking market share