

Analys
A ”Game of Chicken”: How long do you dare to wait before buying?

The EUA market rallied 3.4% ydy and is adding another 0.5% this afternoon with EUA Dec-24 at EUR 54.2/ton. Despite the current bounce in prices we think that the ongoing sell-off in EUA prices still has another EUR 10/ton downside from here which will place the low-point of EUA Dec-24 and Dec-25 at around around EUR 45/ton. Rapidly rising natural gas inventory surplus versus normal and nat gas demand in Europe at 23% below normal will likely continue to depress nat gas prices in Europe and along with that EUA prices. The EUA price will likely struggle to break below the EUR 50/ton level, but we think it will break.

That said, our strong view is still that the deal of the year is to build strategic long positions in EUA contracts. These certificates are ”licence to operate” for all companies who are participants in the EU ETS irrespective whether it is industry, shipping, aviation or utilities. We have argued this strongly towards our corporate clients. The feedback we are getting is that many of them indeed are planning to do just that with board approvals pending. Issuance of EUAs is set to fall sharply from 2026 onward. The Market Stability Reserve (MSR) mechanism will clean out any surplus EUAs above 833 m t by 2025/26. Medium-term market outlook 2026/27 is unchanged and not impacted by current bearish market fundamentals with fair EUA price north of EUR 100/ton by then. Building strategic long position in EUAs in 2024 is not about pinpointing the low point which we think will be around EUR 45/ton, but instead all about implementing a solid strategic purchasing plan for EUAs for 2024.
The ingredients in the bottoming process will be: 1) Re-start of European industry as energy prices come down to normal, 2) Revival in nat gas demand as this happens, 3) Nat gas prices finding a floor and possibly rebounding a bit as this happens, 4) Asian nat gas demand reviving as nat gas now normally priced versus oil, 5) Strategic purchasing of EUA by market participants in the EU ETS, 6) Speculative buying of EUAs, 7) Bullish political intervention in H2-24 and 2025 as EU economies revive on cheap energy and politicians have 2024-elections behind them.
On #1 we now see calculations that aluminium smelters in Europe now are in-the-money but not restarted yet. On #2 we see that demand destruction (temp. adj.) in Europe is starting to fade a bit. On #3 we have not seen that yet. On #4 we see stronger flows of LNG to Asia. On #5 we see lots of our corporate clients planning to purchase strategically and finding current EUA prices attractive. On #6 it may be a bit early and so as well for #7.
For EU ETS participants it may be a ”Game of Chicken”: How long do you dare to wait before buying? Those who wait too long may find the carbon constrained future hard to handle.
Ydy’s short-covering rally lost some steam this morning before regaining some legs in the afternoon. The EUA Dec-24 ydy rallied 3.4% to EUR 53.97/ton in what looks like a short-covering-rally in both coal, nat gas, power and EUAs. This morning it gave almost all of the gains back again before regaining some strength in the afternoon to the point where it is now up at EUR 54.7/ton which is +1.4% vs. ydy. A weather forecast promising more seasonally normal temperatures and below normal winds could be part of the explanation.
The power market is currently the main driver and nat gas prices the most active agent. The main driver in the EUA market is the power market. When the EUA market is medium-tigh (not too loose and not too tight), then the EUA price will naturally converge towards the balancing point where the cost of coal fired electricity equals the cost of gas fired electricity. I.e. the EUA price which solves the equation: a*Coal_price + b*EUA_price = c*Gas_price + d*EUA_price where a, b, c and d are coefficients given by energy efficiency levels, emission factors and EURUSD fex forward rates. As highlighted earlier, this is not one unique EUA balancing price but a range of crosses between different efficiencies for coal power and gas power versus each other.
Coal-to-gas dynamics will eventually fade as price driver for EUAs but right now they are fully active. Eventually these dynamics will come to a halt as a price driver for the EUA price and that is when the carbon market (EU ETS) becomes so tight that all the dynamical flexibility to flex out of coal and into gas has been exhausted. At that point in time the marginal abatement cost setting the price of an EUA will move to other parts of the economy where the carbon abatement cost typically is EUR 100/ton or higher. We expect this to happen in 2026/27.
But for now it is all about the power market and the converging point where the EUA price is balancing the cost of Coal + CO2 equal to Gas + CO2 as described above. And here again it is mostly about the price of natural gas which has moved most dramatically of the pair Coal vs Gas.
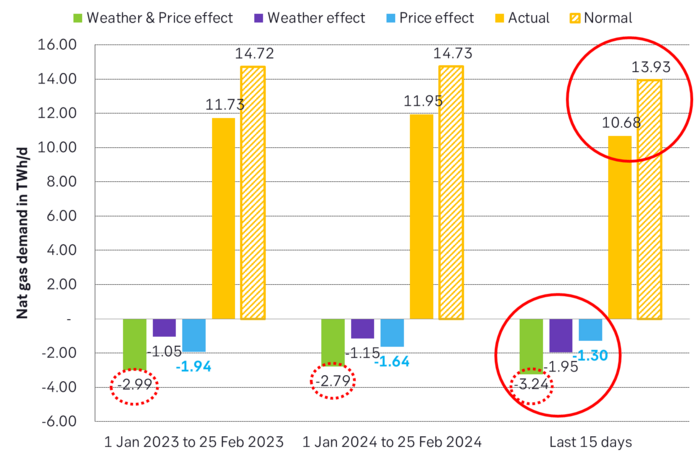
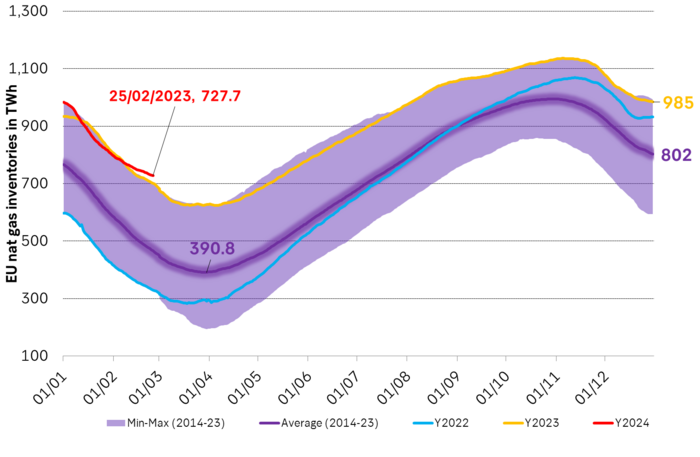
Nat gas demand in Europe is running 23% below normal and inventories are way above normal. And natural gas prices have fallen lower and lower as proper demand recovery keeps lagging the price declines. Yes, demand will eventually revive due low nat gas prices, and we can see emerging signs of that happening both in Europe and in Asia, but nat gas in Europe is still very, very weak vs. normal. But reviving demand is typically lagging in time vs price declines. Nat gas in Europe over the 15 days to 25. Feb was roughly 23% below normal this time of year in a combination of warm weather and still depressed demand. Inventories are falling much slower than normal as a result and now stand at 63.9% vs. a normal 44.4% which is 262 TWh more than normal inventories.
Bearish pressure in nat gas prices looks set to continue in the short term. Natural gas prices will naturally be under pressure to move yet lower as long as European nat gas demand revival is lagging and surplus inventory of nat gas keeps rising rapidly. And falling front-end nat gas prices typically have a guiding effect on forward nat gas prices as well.
Yet lower nat gas prices and yet lower EUA prices in the near term most likely. Nat gas prices in Europe will move yet lower regarding both spot and forwards and the effect on EUA will be continued bearish pressure on prices.
EUA’s may struggle a bit to break below the EUR 50/ton line but most likely they will. EUA prices will typically struggle a bit to cross below EUR 50/ton just because it is a significant number. But it is difficult to see that this price level won’t be broken properly as the bearish pressure continues from the nat gas side of the equation. Even if nat gas prices comes to a halt at current prices we should still see the EUA price break below the EUR 50/ton level and down towards EUR 45/ton for Dec-24 and Dec-25.
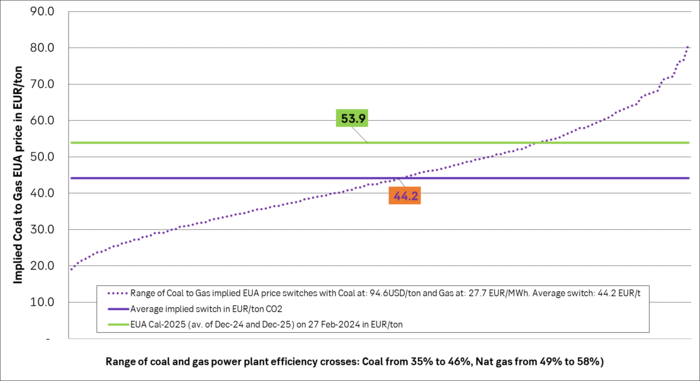
The front-year nat gas price is the most important but EUA price should move yet lower even if it TTF-2025 stays unchanged at EUR 27.7/ton. The front-year is the most important for the EUA price as that is where there is most turnover and hedging. The following attractors for the EUA forward prices is with today’s TTF forward price curve (TTF Cal-2025 = EUR 27.7/ton) and today’s forward EURUSD FX curve and with ydy’s ARA coal closing prices. What it shows is that the forward EUA attractors are down at EUR 45/ton and lower.
The front-year Coal-to-Gas differential is the most important ”attractor” for the EUA price (Cal-2025 = average of Dec-24 and Dec-25) and that is down to around EUR 45/ton with a TTF Cal-2025 price of EUR 27.7/ton. The bearish pressure on EUA prices will continue as long as the forward nat gas prices are at these price levels or lower.
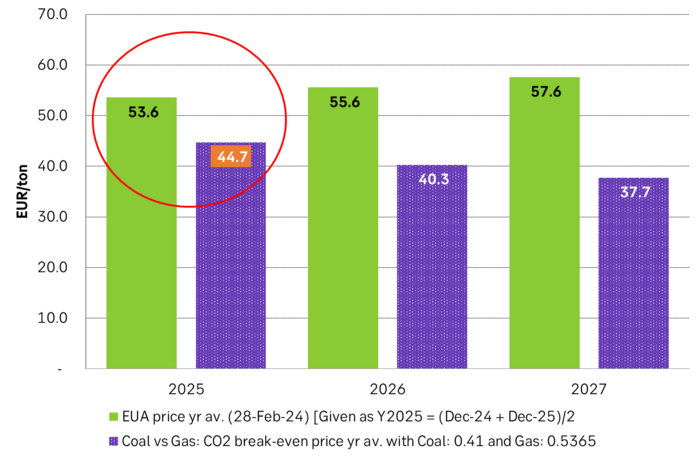
And if we take the EUA attractors from all the different energy efficiency crosses between coal and gas then we get an average attractor of EUR 44.2/ton for EUA Cal-2025 (= average of Dec-24 and Dec-25) versus a market price today of EUR 53.9/ton.
Calculating all the energy efficiency crosses between coal and gas power plants with current prices for coal and nat gas for 2025 we get an average of EUR 44.2/ton vs an EUA market price of EUR 53.9/ton. Bearish pressure on EUAs will continue as long as this is the case.
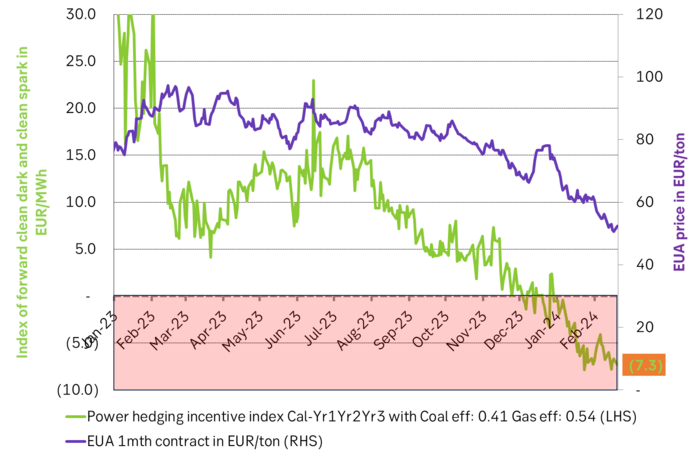
Utility hedging incentive index still deeply negative: Utilities have no incentive currently to buy coal, gas and EUAs forward and sell power forward against it as these forward margins are currently negative => very weak purchasing of EUAs from utilities for the time being.
Natural gas in Europe for different periods with diff between actual and normal decomposed into ”price effect” and ”weather effect”. Demand last 15 days were 23% below normal!
Natural gas inventories in Europe vs the 2014-2023 average. Surplus vs. normal is rising rapidly.
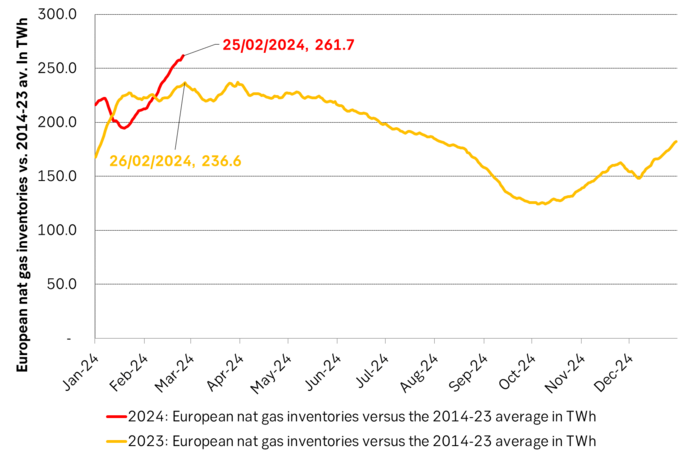
Nat gas inventories in Europe at record high for the time of year. Depressing spot prices more and more. Nat gas prices are basically shouting: ”Demand, demand, where are you?? Come and eat me!”
Brent is climbing higher. Front-month is at USD 106.3/bl this morning, close to a weekly high and a USD 9/bl jump from Mondays open. This is the move we flagged as a risk earlier in the week: the market shifting from ”a deal is around the corner” to ”this is going to take longer than we thought”.

Analyst Commodities, SEB
During April, rest-of-year Brent remained remarkably stable around USD 90/bl. A stability which rested on one single assumption: the SoH reopens around 1 May. That assumption is now slowly falling apart.
As we highlighted yesterday: every week of delay beyond 1 May adds (theoretically) ish USD 5/bl to the rest-of-year average, as global inventories draw 100 million barrels per week. i.e., a mid-May reopening implies rest-of-year Brent closer to USD 100/bl, and anything pushing into June or July takes us meaningfully higher.
What’s changed in the last 48 hours:
#1: The US military has formally warned that clearing suspected sea mines from SoH could take up to six months. That is a completely different timescale from what the financial market is pricing. Even a political deal tomorrow does not immediately reopen the strait.
#2: Trump has shifted his tone from urgency to ”strategic patience”. In yesterday’s press conference: ”Don’t rush me… I want a great deal.” The market is reading this as a president no longer feeling pressured by timelines, with the naval blockade running in the background.
#3: So far, the military activity is escalating, not de-escalating. Axios reports Iran is laying more mines in SoH. The US 3rd carrier strike group (USS George H.W. Bush) is arriving with two countermine vessels. Trump yesterday ordered the US Navy to destroy any Iranian boats caught laying mines. While CNN reports that the Pentagon is actively drawing up plans to strike Iranian SoH capabilities and individual Iranian military leaders if the ceasefire collapses. i.e., NOT a attitude consistent with an imminent deal!
Spot crude and product prices eased off the early-April highs on a combination of system rerouting and deal optimism. Both now weakening. Goldman estimates April Gulf output is reduced by 14.5 mbl/d, or 57% of pre-war supply, a number that keeps getting worse the longer this drags on.
Demand-side adaptation is ongoing: S. Korea has cut its Middle East crude dependence from 69% to 56% by pulling more from the Americas and Africa, and Japan is kicking off a second round of SPR releases from 1 May. But SPRs are finite.
Ref. to the negotiations, we should not bet on speed. The current Iranian leadership is dominated by genuine hardliners willing to absorb economic pain and run the clock to extract concessions. That is not a setup for a rapid resolution. US/Israeli media briefings keep framing the delay as ”internal Iranian divisions”, the reality is more complicated and points toward weeks and months, not days.
Our point is that the complexity is large, and higher prices have only just started (given a scenario where the negotiations drag out in time). The market spent April leaning on the USD 90/bl rest-of-year assumption; that case is diminishing by the hour. If ”early May reopening” is replaced by ”June, July or later” over the next week or two, both crude and products have meaningful room to reprice higher from here. There is a high risk being short energy and betting on any immediate political resolution(!).
Down on Friday. Up on Monday. The Brent June crude oil contract traded down 5.1% last week to a close of $90.38/b. It reached a high of $103.87/b last Monday and a low of $86.09/b on Friday as Iran announced that the Strait of Hormuz was fully open for transit. That quickly changed over the weekend as the US upheld its blockade of Iranian oil exports while Iran naturally responded by closing the SoH again. The US blew a hole in the engine room of the Iranian ship TOUSKA and took custody of the ship on Sunday. Brent crude is up 5.6% this morning to $95.4/b.

The cease-fire is expiring tomorrow. The US has said it will send a delegation for a second round of negotiations in Islamabad in Pakistan. But Iran has for now rejected a second round of talks as it views US demands as unrealistic and excessive while the US is also blocking the Strait of Hormuz.
While Brent is up 5% this morning, the financial market is still very optimistic that progress will be made. That talks will continue and that the SoH will fully open by the start of May which is consistent with a rest-of-year average Brent crude oil price of around $90/b with the market now trading that balance at around $88/b.
Financial optimism vs. physical deterioration. We have a divergence where the financial market is trading negotiations, improvements and resolution while at the same time the physical market is deteriorating day by day. Physical oil flows remain constrained by disrupted flows, longer voyage times and elevated freight and insurance costs.
Financial markets are betting that a US/Iranian resolution will save us in time from violent shortages down the road. But every day that the SoH remains closed is bringing us closer to a potentially very painful point of shortages and much higher prices.
The US blockade is also a weapon of leverage against its European and Asian allies. When Iran closed the SoH it held the world economy as a hostage against the US. The US blockade of the SoH is of course blocking Iranian oil exports. But it is also an action of disruption directed towards Europe and Asia. The US has called for the rest of the world to engaged in the war with Iran: ”If you want oil from the Persian Gulf, then go and get it”. A risk is that the US plays brinkmanship with the global oil market directed towards its European and Asian allies and maybe even towards China to force them to engage and take part. Maybe unthinkable. But unthinkable has become the norm with Trump in the White House.
Wild moves yesterday. Brent crude traded to a high of $114.43/b and a low of $96.0/b and closed at $99.94/b yesterday.
US – Iran negotiations ongoing or not? What a day. Donald Trump announced that good talks were ongoing between Iran and the US and that the 48 hour deadline before bombing Iranian power plants and energy infrastructure was postponed by five days subject to success of ongoing meetings. Iranian media meanwhile stated that no meetings were ongoing at all.
Today we are scratching our heads trying to figure out what yesterday was all about.
Friends and family playing the market? Was it just Trump and his friends and family who were playing with oil and equity markets with $580m and $1.46bn in bets being placed by someone in oil and equity markets just 15 minutes before Trump’s announcement?
Was Trump pulling a TACO as he reached his political and economic pain point: Brent at $112/b, US Gas at $4/gal, SPX below 200dma and US 10yr above 4.4%?
Different Iranian factions with Trump talking with one of them? Are there real negotiations going on but with the US talking to one faction in Iran while another, the hardliners, are not involved and are denying any such negotiations going on?
Extending the ultimatum to attack and invade Kharg island next weekend? Or, is the five day delay of the deadline a tactical decision to allow US amphibious assault ships and marines to arrive in the Gulf in the upcoming weekend while US and Israeli continues to degrade Iranian military targets till then. And then next weekend a move by the US/Israel to attack and conquer for example the Kharg island?
We do not really know which it is or maybe a combination of these.
We did get some kind of TACO ydy. But markets have been waiting for some kind of TACO to happen and yesterday we got some kind of TACO. And Brent crude is now trading at $101.5/b as a result rather than at $112-114/b as it did no the high yesterday.
But what really matters in our view is the political situation on the ground in Iran. Will hardliners continue to hold power or will a more pragmatic faction gain power?
If the hardliners remain in power then oil pain should extend all the way to US midterm elections. The hardliners were apparently still in charge as of last week. Iran immediately retaliated and damaged LNG infrastructure in Qatar after Israel hit Iranian South Pars. The SoH was still closed and all messages coming out of Iran indicated defiance. Hardliners continues in power has a huge consequence for oil prices going forward. The regime has played its ’oil-weapon’ (closing or chocking the Strait of Hormuz). It is using it to achieve political goals. Deterrence: it needs to be so politically and economically expensive to attack Iran that it won’t happen again in the future. Or at least that the US/Israel thinks 10-times over before they attack again. The highest Brent crude oil closing price since the start of the war is $112.19/b last Friday. In comparison the 20-year inflation adjusted Brent price is $103/b. So Brent crude last Friday at $112.19/b isn’t a shockingly high price. And it is still far below the nominal high of $148/b from 2008 which is $220/b if inflation adjusted. So once in a lifetime Iran activates its most powerful weapon. The oil weapon. It needs to show the power of this weapon and it needs to reap political gains. Getting Brent to $112/b and intraday high of $119.5/b (9 March) isn’t a display of the power of that weapon. And it is not a deterrence against future attacks.
So if the hardliners remain in power in Iran, then the SoH will likely remain chocked all the way to US midterm elections and Brent crude will at a minimum go above the historical nominal high of $148/b from 2008.
Thus the outlook for the oil price for the rest of the year doesn’t depend all that much of whether Trump pulls a TACO or not. Stops bombing or not. It depends more on who is in charge in Iran. If it is the hardliners, then deterrence against future attacks via chocking of the SoH and high oil prices is the likely line of action. It is impacting the world but the Iranian ’oil-weapon’ is directed towards the US president and the the US midterm elections.
If a pragmatic faction gets to power in Iran, then a very prosperous future is possible. However, if power is shifting towards a more pragmatic faction in Iran then a completely different direction could evolve. Such a faction could possibly be open for cooperation with the US and the GCC and possibly put its issues versus Israel aside. Then the prosperity we have seen evolving in Dubai could be a possible future also for Iran.
So far it looks like the hardliners are fully in charge. As far as we can see, the hardliners are still fully in control in Iran. That points towards continued chocking of the SoH and oil prices ticking higher as global inventories (the oil market buffers) are drawn lower. And not just for a few more weeks, but possibly all the way to the US midterm elections.


Solkraften pressar elpriserna dagtid

Michel Gubel ger sin syn på oljemarknaden

Svag vårflod dubblar elpriserna
Brent crude up USD 9/bl on the week… ”deal around the corner” narrative fades
Market Still Betting on Timely Resolution, But Each Day Raises Shortage Risk

Christian Kopfer om läget för oljan
Market Still Betting on Timely Resolution, But Each Day Raises Shortage Risk
Brent crude up USD 9/bl on the week… ”deal around the corner” narrative fades
Michel Gubel ger sin syn på oljemarknaden
Solkraften pressar elpriserna dagtid
-
 Nyheter4 veckor sedan
Christian Kopfer om läget för oljan
-
Analys3 veckor sedan
Market Still Betting on Timely Resolution, But Each Day Raises Shortage Risk
-
Analys3 veckor sedan
Brent crude up USD 9/bl on the week… ”deal around the corner” narrative fades
-
 Nyheter2 veckor sedan
Michel Gubel ger sin syn på oljemarknaden
-
 Nyheter2 veckor sedan
Solkraften pressar elpriserna dagtid
-
Nyheter2 veckor sedan
Svag vårflod dubblar elpriserna