

Analys
Bearish momentum may return but strategic buying is starting to kick in

EUA price action: The seeds of the rally may have come from Red Sea troubles, higher freight rates and higher ARA coal prices. Add in record short positioning in EUAs, nat gas being cheap relative to oil in Asia, participants in the EU ETS purchasing EUAs strategically, rising temperature adj. nat gas demand in Europe (though absolute demand still very, very weak due to warm weather) and lastly a weather forecast pointing to more normal temperatures in North West Europe. And ”Bob’s your uncle”, the EUA Dec-24 price rallied 10.8% from EUR 52.2/ton on Feb 26 to EUR 57.84/ton ydy.

It is normal with short-covering rallies in bear markets. What puzzled us a little was the involvement of coal prices in the rally together with nat gas and EUAs. Did the upturn in coal prices come from the Chinese market with participants there maybe sniffing out some kind of imminent, large government stimulus package and front-running the market? No. There has been no rally in iron ore and the upturn in coal prices in Asia have been lagging the upturn in ARA coal prices.
Did the rally come from the Utility side in Europe where Utilities jumped in and bought Coal, Gas and EUAs and selling power against it? Probably not because forward fossil power margins are still very negative.
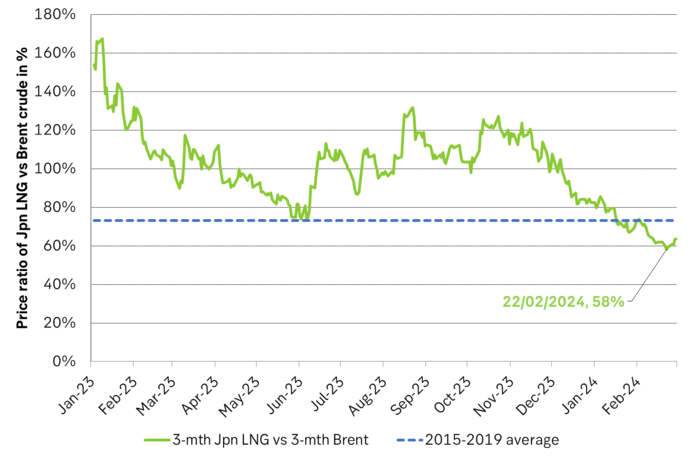
The most plausible explanation for the upturn in coal prices is thus Red Sea troubles, higher dry freight rates and higher ARA coal prices as a result. ARA coal prices bottomed out on 14 Feb and then started to move higher. The Baltic dry index started to rally already in mid-January. This may have been the seeds which a little later helped to ignite the short-covering rally in nat gas and EUAs. Add in a) Record short positioning in EUA contracts by investment funds with need for short-covering as EUA prices headed higher, b) Japanese LNG trading at only 58% versus Brent crude vs. a 2015-19 average of 73% thus nat gas was cheap vs. oil, c) Participants in the EU ETS starting to buy EUAs strategically because the price was close to EUR 50/ton, d) Gradually improving nat gas demand in Europe in temperature adjusted terms though actual.
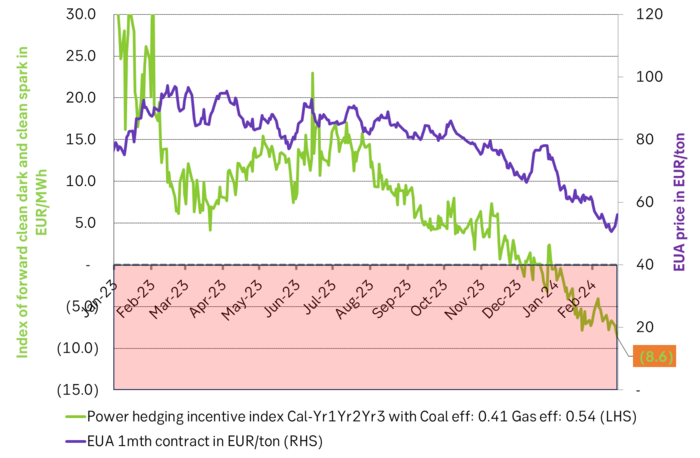
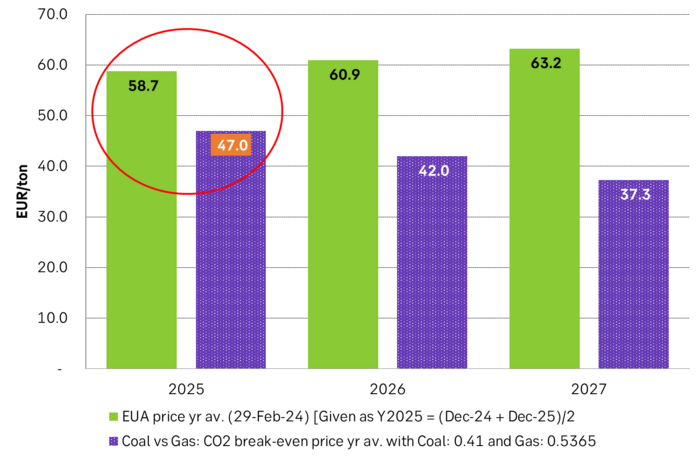
Mixed price action this morning. Bearish momentum may return but strategic buying is kicking in. Today the EUA price is falling back a little (-0.3%) along with mixed direction in nat gas prices. The coal-to-gas differential (C-t-G diff) for the front-year 2025 still looks like it is residing at around EUR 47/ton and lower for 2026 and 2027. We expect C-t-G diffs to work as attractors to the EUA price from the power market dynamics side of the equation. Thus if nat gas prices now stabilizes at current levels we should still see bearish pressure on EUAs return towards these C-t-G diff levels. The forward hedging incentive index for power utilities in Germany is still deeply negative with no incentive to lock in forward margins as these largely are negative. Thus no normal purchasing of EUAs for hedging of power margin purposes.
That said however. We do see increasing interest from corporate clients to pick up EUAs for longer-term use and strategic positioning and that will likely be a counter to current bearish power market drivers. Even utilities will likely step in a make strategic purchases of EUAs. Especially those with coal assets. Irrespective of current forward power margins. An EUA price below EUR 60/ton is cheap in our view versus a medium-term outlook 2026/27 north of EUR 100/ton and we are not alone holding the view.
The Baltic dry index (blue) bottomed in mid-Jan and rallied on Red Sea issues. European coal, ARA 1mth coal price (white) bottomed on 14 Feb and then rallied.
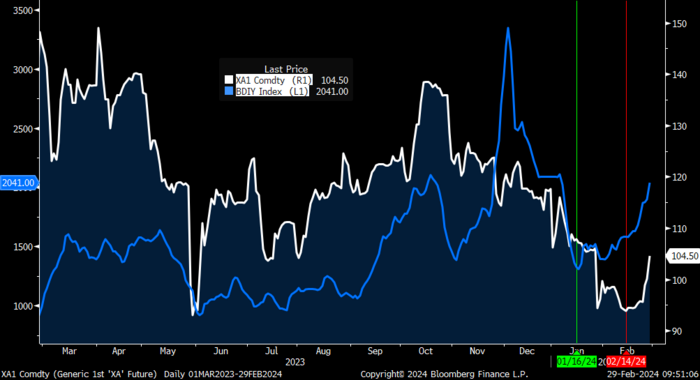
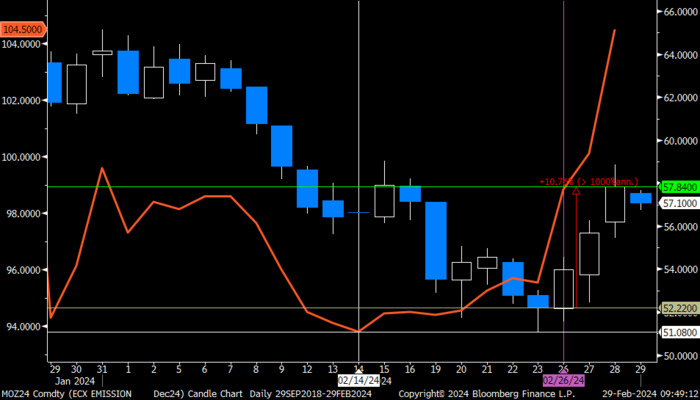
ARA 1mth coal price in orange starting to move higher from 14 Feb. EUA Dec-24 price bottomed for now on 26 Feb
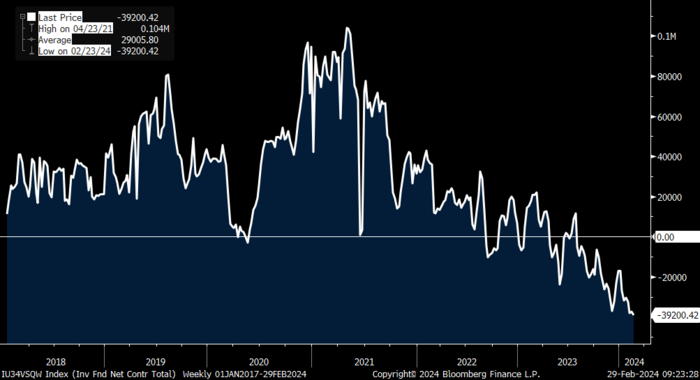
Net speculative positioning in EUAs by financial players. Record short
Price of Japanese LNG vs price of TTF nat gas as a spread in EUR/MWh. Rising price of Japanese LNG vs. TTF. But this could be coming from changes in LNG freight rates
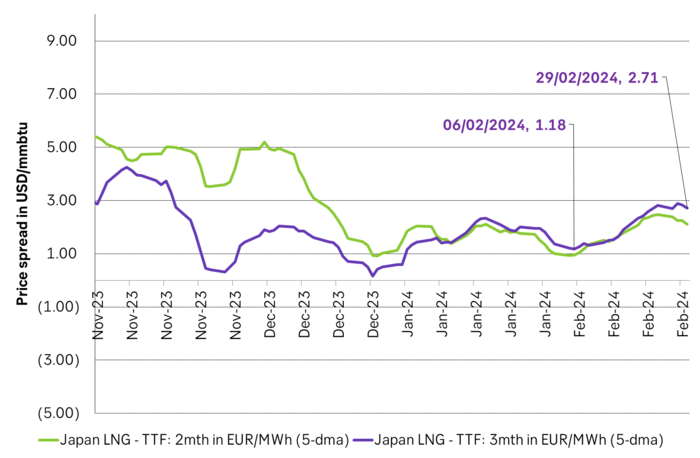
Price of Japanese LNG vs. Brent crude traded all the way down to 58% making it cheap in relative terms to oil.
The German forward hedging incentive index just getting more and more negative
Forward EUA prices in green (today’s prices) and the EUA balancing price for Coal power vs Gas power in lilac. The latter is calculated with today’s nat gas prices and closing prices for ARA coal from ydy. In a medium-tight EUA market the Coal-to-Gas differential in lilac will typically be an ”attractor” for the EUA price in terms of power market dynamics.
Brent is climbing higher. Front-month is at USD 106.3/bl this morning, close to a weekly high and a USD 9/bl jump from Mondays open. This is the move we flagged as a risk earlier in the week: the market shifting from ”a deal is around the corner” to ”this is going to take longer than we thought”.

Analyst Commodities, SEB
During April, rest-of-year Brent remained remarkably stable around USD 90/bl. A stability which rested on one single assumption: the SoH reopens around 1 May. That assumption is now slowly falling apart.
As we highlighted yesterday: every week of delay beyond 1 May adds (theoretically) ish USD 5/bl to the rest-of-year average, as global inventories draw 100 million barrels per week. i.e., a mid-May reopening implies rest-of-year Brent closer to USD 100/bl, and anything pushing into June or July takes us meaningfully higher.
What’s changed in the last 48 hours:
#1: The US military has formally warned that clearing suspected sea mines from SoH could take up to six months. That is a completely different timescale from what the financial market is pricing. Even a political deal tomorrow does not immediately reopen the strait.
#2: Trump has shifted his tone from urgency to ”strategic patience”. In yesterday’s press conference: ”Don’t rush me… I want a great deal.” The market is reading this as a president no longer feeling pressured by timelines, with the naval blockade running in the background.
#3: So far, the military activity is escalating, not de-escalating. Axios reports Iran is laying more mines in SoH. The US 3rd carrier strike group (USS George H.W. Bush) is arriving with two countermine vessels. Trump yesterday ordered the US Navy to destroy any Iranian boats caught laying mines. While CNN reports that the Pentagon is actively drawing up plans to strike Iranian SoH capabilities and individual Iranian military leaders if the ceasefire collapses. i.e., NOT a attitude consistent with an imminent deal!
Spot crude and product prices eased off the early-April highs on a combination of system rerouting and deal optimism. Both now weakening. Goldman estimates April Gulf output is reduced by 14.5 mbl/d, or 57% of pre-war supply, a number that keeps getting worse the longer this drags on.
Demand-side adaptation is ongoing: S. Korea has cut its Middle East crude dependence from 69% to 56% by pulling more from the Americas and Africa, and Japan is kicking off a second round of SPR releases from 1 May. But SPRs are finite.
Ref. to the negotiations, we should not bet on speed. The current Iranian leadership is dominated by genuine hardliners willing to absorb economic pain and run the clock to extract concessions. That is not a setup for a rapid resolution. US/Israeli media briefings keep framing the delay as ”internal Iranian divisions”, the reality is more complicated and points toward weeks and months, not days.
Our point is that the complexity is large, and higher prices have only just started (given a scenario where the negotiations drag out in time). The market spent April leaning on the USD 90/bl rest-of-year assumption; that case is diminishing by the hour. If ”early May reopening” is replaced by ”June, July or later” over the next week or two, both crude and products have meaningful room to reprice higher from here. There is a high risk being short energy and betting on any immediate political resolution(!).
Down on Friday. Up on Monday. The Brent June crude oil contract traded down 5.1% last week to a close of $90.38/b. It reached a high of $103.87/b last Monday and a low of $86.09/b on Friday as Iran announced that the Strait of Hormuz was fully open for transit. That quickly changed over the weekend as the US upheld its blockade of Iranian oil exports while Iran naturally responded by closing the SoH again. The US blew a hole in the engine room of the Iranian ship TOUSKA and took custody of the ship on Sunday. Brent crude is up 5.6% this morning to $95.4/b.

The cease-fire is expiring tomorrow. The US has said it will send a delegation for a second round of negotiations in Islamabad in Pakistan. But Iran has for now rejected a second round of talks as it views US demands as unrealistic and excessive while the US is also blocking the Strait of Hormuz.
While Brent is up 5% this morning, the financial market is still very optimistic that progress will be made. That talks will continue and that the SoH will fully open by the start of May which is consistent with a rest-of-year average Brent crude oil price of around $90/b with the market now trading that balance at around $88/b.
Financial optimism vs. physical deterioration. We have a divergence where the financial market is trading negotiations, improvements and resolution while at the same time the physical market is deteriorating day by day. Physical oil flows remain constrained by disrupted flows, longer voyage times and elevated freight and insurance costs.
Financial markets are betting that a US/Iranian resolution will save us in time from violent shortages down the road. But every day that the SoH remains closed is bringing us closer to a potentially very painful point of shortages and much higher prices.
The US blockade is also a weapon of leverage against its European and Asian allies. When Iran closed the SoH it held the world economy as a hostage against the US. The US blockade of the SoH is of course blocking Iranian oil exports. But it is also an action of disruption directed towards Europe and Asia. The US has called for the rest of the world to engaged in the war with Iran: ”If you want oil from the Persian Gulf, then go and get it”. A risk is that the US plays brinkmanship with the global oil market directed towards its European and Asian allies and maybe even towards China to force them to engage and take part. Maybe unthinkable. But unthinkable has become the norm with Trump in the White House.
Wild moves yesterday. Brent crude traded to a high of $114.43/b and a low of $96.0/b and closed at $99.94/b yesterday.
US – Iran negotiations ongoing or not? What a day. Donald Trump announced that good talks were ongoing between Iran and the US and that the 48 hour deadline before bombing Iranian power plants and energy infrastructure was postponed by five days subject to success of ongoing meetings. Iranian media meanwhile stated that no meetings were ongoing at all.
Today we are scratching our heads trying to figure out what yesterday was all about.
Friends and family playing the market? Was it just Trump and his friends and family who were playing with oil and equity markets with $580m and $1.46bn in bets being placed by someone in oil and equity markets just 15 minutes before Trump’s announcement?
Was Trump pulling a TACO as he reached his political and economic pain point: Brent at $112/b, US Gas at $4/gal, SPX below 200dma and US 10yr above 4.4%?
Different Iranian factions with Trump talking with one of them? Are there real negotiations going on but with the US talking to one faction in Iran while another, the hardliners, are not involved and are denying any such negotiations going on?
Extending the ultimatum to attack and invade Kharg island next weekend? Or, is the five day delay of the deadline a tactical decision to allow US amphibious assault ships and marines to arrive in the Gulf in the upcoming weekend while US and Israeli continues to degrade Iranian military targets till then. And then next weekend a move by the US/Israel to attack and conquer for example the Kharg island?
We do not really know which it is or maybe a combination of these.
We did get some kind of TACO ydy. But markets have been waiting for some kind of TACO to happen and yesterday we got some kind of TACO. And Brent crude is now trading at $101.5/b as a result rather than at $112-114/b as it did no the high yesterday.
But what really matters in our view is the political situation on the ground in Iran. Will hardliners continue to hold power or will a more pragmatic faction gain power?
If the hardliners remain in power then oil pain should extend all the way to US midterm elections. The hardliners were apparently still in charge as of last week. Iran immediately retaliated and damaged LNG infrastructure in Qatar after Israel hit Iranian South Pars. The SoH was still closed and all messages coming out of Iran indicated defiance. Hardliners continues in power has a huge consequence for oil prices going forward. The regime has played its ’oil-weapon’ (closing or chocking the Strait of Hormuz). It is using it to achieve political goals. Deterrence: it needs to be so politically and economically expensive to attack Iran that it won’t happen again in the future. Or at least that the US/Israel thinks 10-times over before they attack again. The highest Brent crude oil closing price since the start of the war is $112.19/b last Friday. In comparison the 20-year inflation adjusted Brent price is $103/b. So Brent crude last Friday at $112.19/b isn’t a shockingly high price. And it is still far below the nominal high of $148/b from 2008 which is $220/b if inflation adjusted. So once in a lifetime Iran activates its most powerful weapon. The oil weapon. It needs to show the power of this weapon and it needs to reap political gains. Getting Brent to $112/b and intraday high of $119.5/b (9 March) isn’t a display of the power of that weapon. And it is not a deterrence against future attacks.
So if the hardliners remain in power in Iran, then the SoH will likely remain chocked all the way to US midterm elections and Brent crude will at a minimum go above the historical nominal high of $148/b from 2008.
Thus the outlook for the oil price for the rest of the year doesn’t depend all that much of whether Trump pulls a TACO or not. Stops bombing or not. It depends more on who is in charge in Iran. If it is the hardliners, then deterrence against future attacks via chocking of the SoH and high oil prices is the likely line of action. It is impacting the world but the Iranian ’oil-weapon’ is directed towards the US president and the the US midterm elections.
If a pragmatic faction gets to power in Iran, then a very prosperous future is possible. However, if power is shifting towards a more pragmatic faction in Iran then a completely different direction could evolve. Such a faction could possibly be open for cooperation with the US and the GCC and possibly put its issues versus Israel aside. Then the prosperity we have seen evolving in Dubai could be a possible future also for Iran.
So far it looks like the hardliners are fully in charge. As far as we can see, the hardliners are still fully in control in Iran. That points towards continued chocking of the SoH and oil prices ticking higher as global inventories (the oil market buffers) are drawn lower. And not just for a few more weeks, but possibly all the way to the US midterm elections.


Solkraften pressar elpriserna dagtid

Michel Gubel ger sin syn på oljemarknaden

Svag vårflod dubblar elpriserna
Brent crude up USD 9/bl on the week… ”deal around the corner” narrative fades
Market Still Betting on Timely Resolution, But Each Day Raises Shortage Risk

Christian Kopfer om läget för oljan
Market Still Betting on Timely Resolution, But Each Day Raises Shortage Risk
Brent crude up USD 9/bl on the week… ”deal around the corner” narrative fades
Michel Gubel ger sin syn på oljemarknaden
Solkraften pressar elpriserna dagtid
-
 Nyheter4 veckor sedan
Christian Kopfer om läget för oljan
-
Analys3 veckor sedan
Market Still Betting on Timely Resolution, But Each Day Raises Shortage Risk
-
Analys3 veckor sedan
Brent crude up USD 9/bl on the week… ”deal around the corner” narrative fades
-
 Nyheter2 veckor sedan
Michel Gubel ger sin syn på oljemarknaden
-
 Nyheter2 veckor sedan
Solkraften pressar elpriserna dagtid
-
Nyheter2 veckor sedan
Svag vårflod dubblar elpriserna