

Analys
US shale oil productivity update – OPEC could choke on strongly reviving US shale oil production in 2018 if oil prices hold up in H1-17

 Note: US rig count data by Baker Hughes at 19:00 CET on Friday December 16th
Crude oil comment – US shale oil productivity update – OPEC likely to choke down the road on strongly reviving US shale oil production if oil prices hold up in H1-17
The only thing which can prevent a strong rise in US shale oil rig count going forward is muted crude oil prices. The physical crude oil production effect of an additional 25 shale oil rigs into the market per month in H1-17 won’t really hit the market before H2-17 and mostly 2018. Thus price action may stay oblivious to the coming wave of US shale oil production if it disregards a potentially continued solid rise in US shale oil rigs in H1-17 on the back of OPEC cuts and associated higher prices. At the moment we can see a marginal increase in US shale production projected for January 2017. In weekly data we can see that US crude production bottomed out in September and rose 99 kb/d w/w last week.
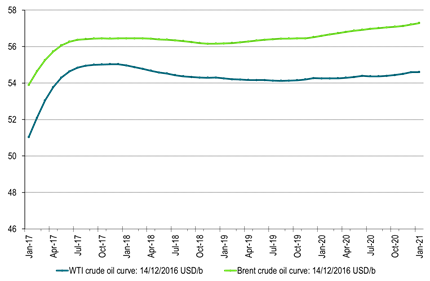
We will not see the actual realisation of US shale oil crude production in the spot market following the rig rise in H2-16 and potentially H1-17 for quite some time. I.e. not really before H2-17 and 2018. What we can see at the moment is the reflected hedging activity from the US shale oil players who hedge on the curve for 2018 and 2019 pushing it down. Shale oil players securing their investments in newly initiated activity having been burned heavily in the previous boom and bust. That is the immediate “shadow effect” hitting the market and the crude oil curve here and now as a reflection of the rising rig count which is again an effect of higher oil prices.
According to the latest US EIA’s Drilling productivity report there were 23 shale oil rigs added per month from the start of June until November. In November alone there were 34 rigs added.
The WTI 15mth price has averaged $51.6/b since the start of June. At the time of writing it trades at $54.3/b but recently traded all the way up to $56.4/b.
Note that in the below US crude oil production scenarios we have only assumed an additional 25 rigs per month for H1-17 for Ch10 and Ch11. That is not much more than the +23 added shale oil rigs per month since June observed by the US EIA in their December drilling productivity report. Thus assuming +25 rigs per month in H1-17 is not really acceleration in rig count addition versus H2-16. However, if the crude oil price was to be significantly higher, especially the WTI 15 mth crude price, then one probably should assume a substantially higher inflow of rigs in H1-17 than what we have witnessed in H2-16.
What this all tells us is that the oil price will be highly responsive to changes in the oil market balance versus OPEC cuts or whether Libyan production will average 1 mb/d in 2017 or just 0.5 mb/d or whether global oil demand growth will be much stronger or not in 2017 or whether Russia will actually be good on its pledged cuts for H1-17 etc. Then again US shale oil rig count and thereafter production will be highly responsive to oil prices again. We have shale oil boom and bust behind us. Now we have the shale oil adaptability before us. We cannot predict all the possible uncertain events which might hit the oil market supply/demand balance in 2017 and thus impact the oil price. We can however say a lot about the responsiveness for US shale oil production and thus how the oil market dynamically will behave. Thus if OPEC gives the market elevated oil prices in H1-17, then US shale oil will give the market a serious Blue Monday in H2-17 or 2018.
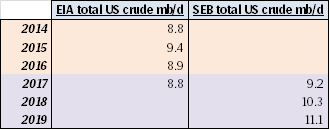
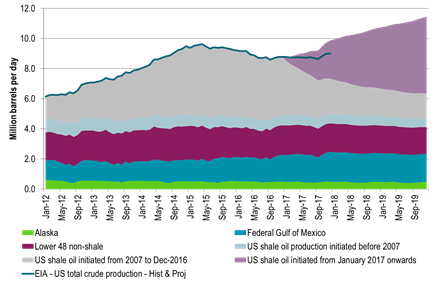
What the three US crude oil production scenarios below tells us is that US crude production in 2018 is highly impacted by how many rigs are added in H1-17. If there are no more rigs in H1-17, then US crude production is good at 9.2 mb/d in 2018. However, if we just continue on the trend from H2-16 with close to 25 extra rigs per month, then US crude production jumps to 10 mb/d in 2018. Thus the 2018 global supply/demand balance is really at play in H1-17. Our numbers are of course a model. The model still fairly well shows the magnitude of sensitivities at play.
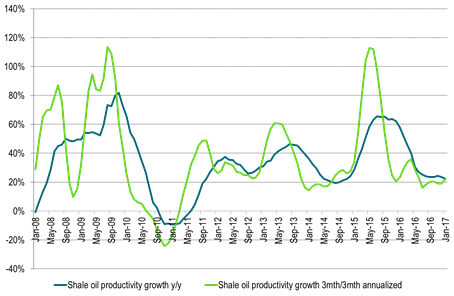
Ch1: US shale oil volume productivity growth continues to hold up at 20% per annum
Both in terms of y/y as well as 3mth/3mth annualized
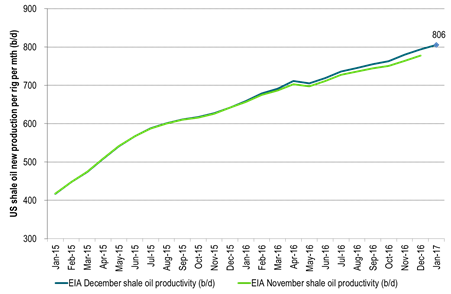
Ch2: US shale oil volume productivity set to rise to 806 b/d per rig per month in January
Calculated for the 4 main US shale oil regions: Bakken, Eagle Ford, Nibrara and Permian
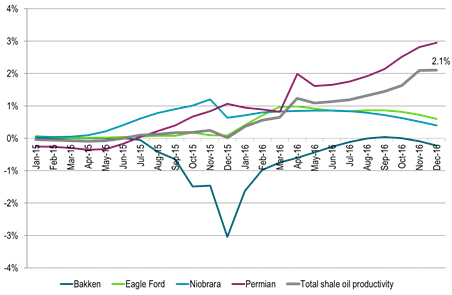
Ch3: The US EIA again revised higher historical US shale oil productivity by 2.1% for Nov and Dec
Data back to December 2015 were also on average revised higher.
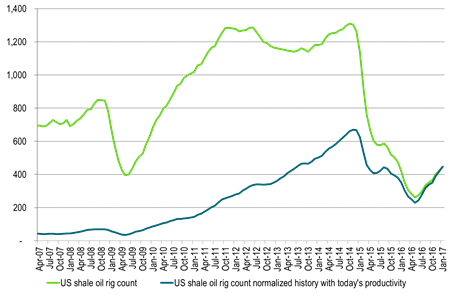
Ch4: The productive effect of today’s some 400 rigs are as strong as 1200 rigs back at the start of 2013
Dark line gives historical rig count adjusted with today’s productivity versus productivity at the time.
An additional 23 rigs are assumed added both in December and in January.
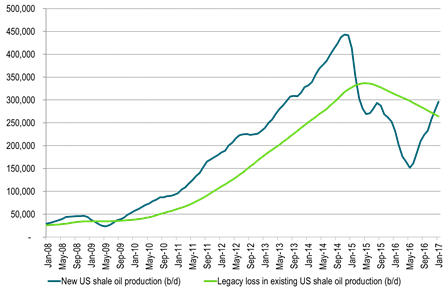
Ch5: US shale oil production is set to start to rise rapidly near term as new production cross above losses in old production
New production here given by EIA rig productivity (December report) stretching out to Jan-17 multiplied by rig count from same report but assuming an additional 23 rigs added in Dec and Jan. In reality however there is a time-lag of 2-4 months before they really cross over.
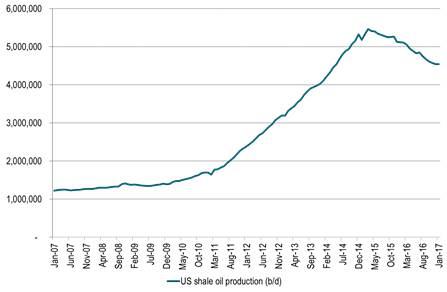
Ch6: US EIA shale oil production just about to turn higher
Data from EIA’s drilling productivity report for December
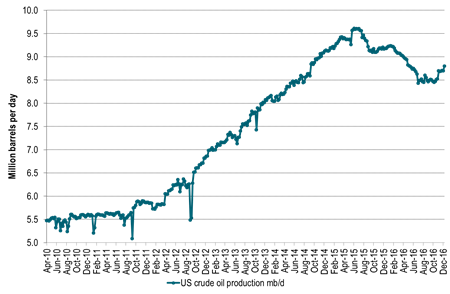
 Ch7: US crude oil production in weekly data already ticking higher (+99 kb/d w/w last week)
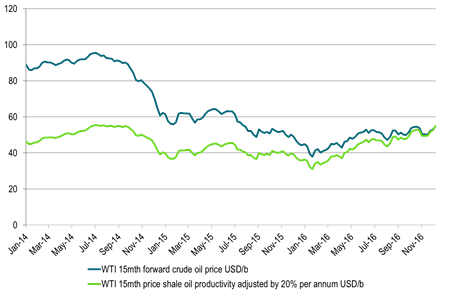
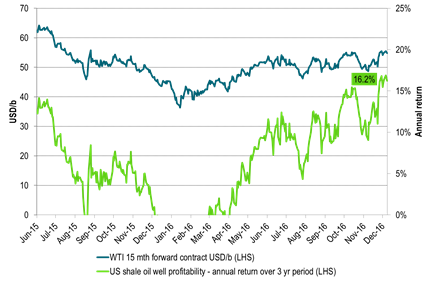
Ch8: US WTI15mth contract at most stimulative level (shale oil investment vise) since July 2015
Playing with numbers:
Green line: Adjust historical WTI15mth crude prices with the 20% pa (roughly) volume productivity growth
Then today’s WTI15 mth price is the most investment wise stimulative level since August 2014
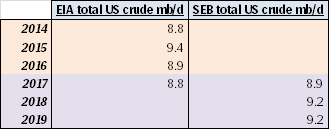
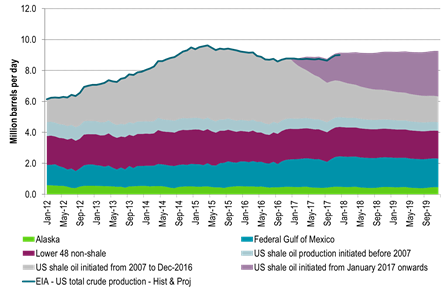
Ch9: US 2018 crude oil production at 9.2 mb/d – Assuming no added US shale oil rigs after Nov 2016 and zero productivity growth
Thus rig count is fixed at 401 from Dec-16 onwards with no productivity growth
However we have already seen 21 additional shale oil rigs into the market in December but they are not added to this scenario.
Only the rigs from the US EIA’s December drilling productivity report are included in this scenario.
Thus seen in the perspective of SEB’s US crude oil model it seems to us that the US EIA assumes NO additional activated shale oil rigs into the market after Nov-16 and no additional shale oil rigs into market in 2017.
We think that the US EIA should specify its assumptions and model projections for the US shale oil rig cont and productivity which goes into their model in its monthly STEO oil reports.
Ch10: US 2018 crude oil production at 10.0 mb/d – Assuming +25 shale oil rigs per month from December 2016 to June-2017 and zero productivity growth
Then no more rigs added after June 2017 with number of US shale oil rigs fixed at 576 rigs after that
Also zero volume productivity growth here onwards from December 2016 gives the following production projection

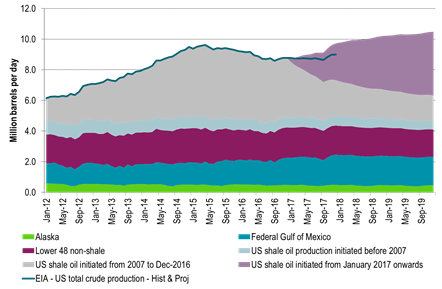
Ch11: US 2018 crude oil production at 10.3 mb/d – Assuming +25 shale oil rigs per month from December 2016 to June-2017 and 10% pa volume productivity growth
Then no more rigs added after June 2017 with number of US shale oil rigs fixed at 576 rigs after that
But assume that US shale oil volume productivity growth continues at 10% pa. instead of the historical (and current) 20% pa.
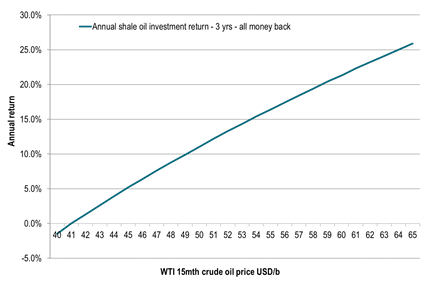
Ch12: US shale oil profitability versus WTI 15 mth crude oil prices
Annual return for a three year investment.
Three years of crude oil production from a new shale oil well.
All money back after three years.
IP 1mth: 1000 b/d. Royalty pay: 20%. Discount rate: 10%, Three yr production after royalty and discount: 330,000 barrels, Wellhead to Cushing discount: $5/b, OPEX: $12/b, Total well cost: $8million,
All production within the hedgeable part of the WTI crude oil price curve.
Thus return should be possible to lock in at the initiation of the investment
Ch13: The WTI crude oil forward curve feeling the depression from shale oil hedging in 2018 and 2019
Likely to be increasingly heavy depression if rig count continues to rise further
Ch14: As three year annual shale oil profitability hits 16% pa
Kind regards
Bjarne Schieldrop
Chief analyst, Commodities
SEB Markets
Merchant Banking
Some rebound but not much. Brent crude rebounded 1.5% yesterday to $65.47/b. This morning it is inching 0.2% up to $65.6/b. The lowest close last week was on Thursday at $64.11/b.

The curve structure is almost as week as it was before the weekend. The rebound we now have gotten post the message from OPEC+ over the weekend is to a large degree a rebound along the curve rather than much strengthening at the front-end of the curve. That part of the curve structure is almost as weak as it was last Thursday.
We are still on a weakening path. The message from OPEC+ over the weekend was we are still on a weakening path with rising supply from the group. It is just not as rapidly weakening as was feared ahead of the weekend when a quota hike of 500 kb/d/mth for November was discussed.
The Brent curve is on its way to full contango with Brent dipping into the $50ies/b. Thus the ongoing weakening we have had in the crude curve since the start of the year, and especially since early June, will continue until the Brent crude oil forward curve is in full contango along with visibly rising US and OECD oil inventories. The front-month Brent contract will then flip down towards the $60/b-line and below into the $50ies/b.
At what point will OPEC+ turn to cuts? The big question then becomes: When will OPEC+ turn around to make some cuts? At what (price) point will they choose to stabilize the market? Because for sure they will. Higher oil inventories, some more shedding of drilling rigs in US shale and Brent into the 50ies somewhere is probably where the group will step in.
There is nothing we have seen from the group so far which indicates that they will close their eyes, let the world drown in oil and the oil price crash to $40/b or below.
The message from OPEC+ is also about balance and stability. The world won’t drown in oil in 2026. The message from the group as far as we manage to interpret it is twofold: 1) Taking back market share which requires a lower price for non-OPEC+ to back off a bit, and 2) Oil market stability and balance. It is not just about 1. Thus fretting about how we are all going to drown in oil in 2026 is totally off the mark by just focusing on point 1.
When to buy cal 2026? Before Christmas when Brent hits $55/b and before OPEC+ holds its last meeting of the year which is likely to be in early December.
Brent crude oil prices have rebounded a bit along the forward curve. Not much strengthening in the structure of the curve. The front-end backwardation is not much stronger today than on its weakest level so far this year which was on Thursday last week.

The front-end backwardation fell to its weakest level so far this year on Thursday last week. A slight pickup yesterday and today, but still very close to the weakest year to date. More oil from OPEC+ in the coming months and softer demand and rising inventories. We are heading for yet softer levels.

Down to the lowest since early May. Brent crude has fallen sharply the latest four days. It closed at USD 64.11/b yesterday which is the lowest since early May. It is staging a 1.3% rebound this morning along with gains in both equities and industrial metals with an added touch of support from a softer USD on top.
What stands out the most to us this week is the collapse in the Dubai one to three months time-spread.
Dubai is medium sour crude. OPEC+ is in general medium sour crude production. Asian refineries are predominantly designed to process medium sour crude. So Dubai is the real measure of the balance between OPEC+ holding back or not versus Asian oil demand for consumption and stock building.
A sharp weakening of the front-end of the Dubai curve. The front-end of the Dubai crude curve has been holding out very solidly throughout this summer while the front-end of the Brent and WTI curves have been steadily softening. But the strength in the Dubai curve in our view was carrying the crude oil market in general. A source of strength in the crude oil market. The core of the strength.
The now finally sharp decline of the front-end of the Dubai crude curve is thus a strong shift. Weakness in the Dubai crude marker is weakness in the core of the oil market. The core which has helped to hold the oil market elevated.
Facts supports the weakening. Add in facts of Iraq lifting production from Kurdistan through Turkey. Saudi Arabia lifting production to 10 mb/d in September (normal production level) and lifting exports as well as domestic demand for oil for power for air con is fading along with summer heat. Add also in counter seasonal rise in US crude and product stocks last week. US oil stocks usually decline by 1.3 mb/week this time of year. Last week they instead rose 6.4 mb/week (+7.2 mb if including SPR). Total US commercial oil stocks are now only 2.1 mb below the 2015-19 seasonal average. US oil stocks normally decline from now to Christmas. If they instead continue to rise, then it will be strongly counter seasonal rise and will create a very strong bearish pressure on oil prices.
Will OPEC+ lift its voluntary quotas by zero, 137 kb/d, 500 kb/d or 1.5 mb/d? On Sunday of course OPEC+ will decide on how much to unwind of the remaining 1.5 mb/d of voluntary quotas for November. Will it be 137 kb/d yet again as for October? Will it be 500 kb/d as was talked about earlier this week? Or will it be a full unwind in one go of 1.5 mb/d? We think most likely now it will be at least 500 kb/d and possibly a full unwind. We discussed this in a not earlier this week: ”500 kb/d of voluntary quotas in October. But a full unwind of 1.5 mb/d”
The strength in the front-end of the Dubai curve held out through summer while Brent and WTI curve structures weakened steadily. That core strength helped to keep flat crude oil prices elevated close to the 70-line. Now also the Dubai curve has given in.

Brent crude oil forward curves

Total US commercial stocks now close to normal. Counter seasonal rise last week. Rest of year?

Total US crude and product stocks on a steady trend higher.

Analys
OPEC+ will likely unwind 500 kb/d of voluntary quotas in October. But a full unwind of 1.5 mb/d in one go could be in the cards
Down to mid-60ies as Iraq lifts production while Saudi may be tired of voluntary cut frugality. The Brent December contract dropped 1.6% yesterday to USD 66.03/b. This morning it is down another 0.3% to USD 65.8/b. The drop in the price came on the back of the combined news that Iraq has resumed 190 kb/d of production in Kurdistan with exports through Turkey while OPEC+ delegates send signals that the group will unwind the remaining 1.65 mb/d (less the 137 kb/d in October) of voluntary cuts at a pace of 500 kb/d per month pace.
Signals of accelerated unwind and Iraqi increase may be connected. Russia, Kazakhstan and Iraq were main offenders versus the voluntary quotas they had agreed to follow. Russia had a production ’debt’ (cumulative overproduction versus quota) of close to 90 mb in March this year while Kazakhstan had a ’debt’ of about 60 mb and the same for Iraq. This apparently made Saudi Arabia angry this spring. Why should Saudi Arabia hold back if the other voluntary cutters were just freeriding? Thus the sudden rapid unwinding of voluntary cuts. That is at least one angle of explanations for the accelerated unwinding.
If the offenders with production debts then refrained from lifting production as the voluntary cuts were rapidly unwinded, then they could ’pay back’ their ’debts’ as they would under-produce versus the new and steadily higher quotas.
Forget about Kazakhstan. Its production was just too far above the quotas with no hope that the country would hold back production due to cross-ownership of oil assets by international oil companies. But Russia and Iraq should be able to do it.
Iraqi cumulative overproduction versus quotas could reach 85-90 mb in October. Iraq has however steadily continued to overproduce by 3-5 mb per month. In July its new and gradually higher quota came close to equal with a cumulative overproduction of only 0.6 mb that month. In August again however its production had an overshoot of 100 kb/d or 3.1 mb for the month. Its cumulative production debt had then risen to close to 80 mb. We don’t know for September yet. But looking at October we now know that its production will likely average close to 4.5 mb/d due to the revival of 190 kb/d of production in Kurdistan. Its quota however will only be 4.24 mb/d. Its overproduction in October will thus likely be around 250 kb/d above its quota with its production debt rising another 7-8 mb to a total of close to 90 mb.
Again, why should Saudi Arabia be frugal while Iraq is freeriding. Better to get rid of the voluntary quotas as quickly as possible and then start all over with clean sheets.
Unwinding the remaining 1.513 mb/d in one go in October? If OPEC+ unwinds the remaining 1.513 mb/d of voluntary cuts in one big go in October, then Iraq’s quota will be around 4.4 mb/d for October versus its likely production of close to 4.5 mb/d for the coming month..
OPEC+ should thus unwind the remaining 1.513 mb/d (1.65 – 0.137 mb/d) in one go for October in order for the quota of Iraq to be able to keep track with Iraq’s actual production increase.
October 5 will show how it plays out. But a quota unwind of at least 500 kb/d for Oct seems likely. An overall increase of at least 500 kb/d in the voluntary quota for October looks likely. But it could be the whole 1.513 mb/d in one go. If the increase in the quota is ’only’ 500 kb/d then Iraqi cumulative production will still rise by 5.7 mb to a total of 85 mb in October.
Iraqi production debt versus quotas will likely rise by 5.7 mb in October if OPEC+ only lifts the overall quota by 500 kb/d in October. Here assuming historical production debt did not rise in September. That Iraq lifts its production by 190 kb/d in October to 4.47 mb/d (August level + 190 kb/d) and that OPEC+ unwinds 500 kb/d of the remining quotas in October when they decide on this on 5 October.


Samtal om sällsynta jordartsmetaller, guld och silver

Brookfield köper bränsleceller för 5 miljarder USD av Bloom Energy för att driva AI-datacenter

Teck Resources kan förse Nordamerika och kanske hela G7 med all germanium som behövs

Leading Edge Materials är på rätt plats i rätt tid

Oljepriset faller efter ny handelskonflikt mellan USA och Kina

Kinas elproduktion slog nytt rekord i augusti, vilket även kolkraft gjorde

Tyskland har så höga elpriser att företag inte har råd att använda elektricitet

OPEC+ missar produktionsmål, stöder oljepriserna

Ett samtal om guld, olja, fjärrvärme och förnybar energi
Brent crude ticks higher on tension, but market structure stays soft
-
 Nyheter4 veckor sedan
Kinas elproduktion slog nytt rekord i augusti, vilket även kolkraft gjorde
-
Nyheter4 veckor sedan
Tyskland har så höga elpriser att företag inte har råd att använda elektricitet
-
 Nyheter3 veckor sedan
OPEC+ missar produktionsmål, stöder oljepriserna
-
 Nyheter3 veckor sedan
Ett samtal om guld, olja, fjärrvärme och förnybar energi
-
Analys4 veckor sedan
Brent crude ticks higher on tension, but market structure stays soft
-
Analys3 veckor sedan
Are Ukraine’s attacks on Russian energy infrastructure working?
-

 Nyheter2 veckor sedan
Guld nära 4000 USD och silver 50 USD, därför kan de fortsätta stiga
-

 Nyheter3 veckor sedan
Guldpriset uppe på nya höjder, nu 3750 USD