

Analys
Agricultural commodities could offer a hedge against inflation


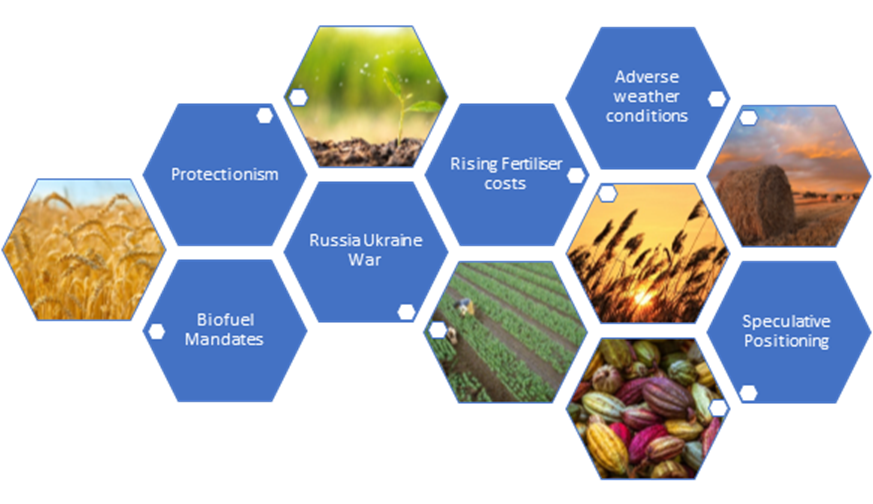
Agricultural commodity prices have been buoyed higher by rising grain and oilseed prices. At a time, when global equities have sold off by nearly 13.88% amidst soaring inflation and tightening liquidity conditions, agricultural commodities are up 26.8%. There are a plethora of supply side issues emanating from the war that are likely to continue to drive prices higher – the rise of protectionism, higher fertiliser costs, changing biofuel mandates and adverse weather conditions to name a few. The Russia-Ukraine war has had ripple effects from disrupting supply chains to raising fertiliser costs.
Rising protectionism buoys agricultural commodities higher
The war-related disruptions have also given rise to protectionism. To cite a few examples in 2022– India, the world’s third largest wheat producer, announced it would restrict wheat exports to manage domestic supplies of the grain, which led to a sharp rise in wheat prices. Indonesia also announced an export ban on palm oil on April 28, but the ban was lifted on May 19 after hundreds of farmers rallied to protest the move. In a tight oil-seeds markets, the initial announcement led soybean oil, an alternative to palm oil, sharply higher.
Higher biofuel blending mandates to bolster demand for corn and soybean oil
Changes in the biofuel blending mandates are also poised to increase demand for agricultural commodities. The US is home to the world’s largest biofuel market. The Biden administration is ordering refiners to boost the use of biofuels such as corn-based ethanol. The US Environmental Protection Agency (EPA) is requiring refiners to mix 20.63 billion gallons of renewable fuels into gasoline and diesel this year, marking a 9.5% increase over last year’s target. This will put pressure on refiners to blend more biofuel into their gasoline production this year, resulting in a net positive impact on the biofuels industry. Grains such as corn stand to benefit owing to their high starch content and relatively easy conversion to ethanol. Amidst waning stockpiles of diesel, Brazil is also considering increasing the biodiesel blend to 15% from 10% (i.e. the amount of soybean oil blended into trucking fuel). This has the potential to bolster demand for soybeans at a time when soybeans are already in short supply due to droughts in South America and US plantings trail last year’s pace.
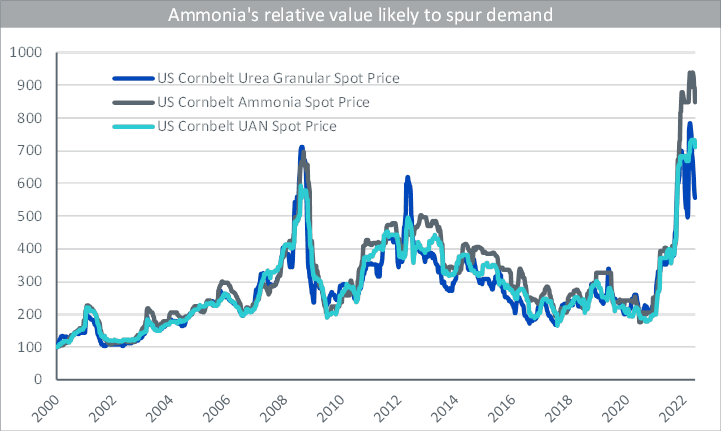
Rising fertiliser costs are weakening demand, in turn lowering yields
The Russia-Ukraine conflict has caused disruptions in fertiliser production and material price increases, which has put farmer margins and agricultural yields at risk elsewhere, driving the prices of most agricultural commodities higher. Russia and Ukraine account for a significant share of the global fertiliser trade. Russia produces 9% of global nitrogen fertiliser, 10% of global phosphate fertiliser, and 20% of global potash fertiliser. It exports more than two thirds of its production of each product. Belarus produces an additional 17% of global potash and exports most of it.
Owing to its high soil quality, Argentina tends to use less fertilisers, but Brazil (the world’s largest importer of fertilisers) of which 85% of its needs are imported, is likely to feel the impact more. Russia alone accounts for 25% of Brazil’s total fertiliser imports. Farmers can also plant more soybeans, which require less fertilisers than corn. The US and global corn balance are set to continue to tighten, which suggests that the current high price environment is set to linger. The high prices and low availability of fertilisers is making farmers reduce usage and is also resulting in lower fertiliser prices similar to the trend witnessed back in 2008.
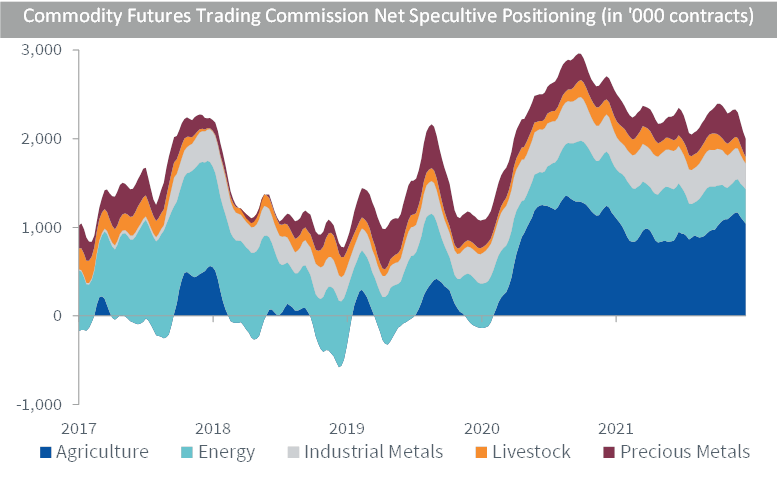
Speculative positioning garnering momentum among agricultural commodities
According to data from the Commodity Futures Trading Commission (CFTC), net speculative positioning in agricultural commodities has risen considerably since the covid pandemic. Tighter supply coupled with stockpiling by national governments concerned about food security has led to a rise in agricultural commodity prices. Not only has net speculative positioning on agricultural commodities risen versus its own history but also in comparison to other commodity subsectors, as illustrated in the chart below:
Adverse weather conditions impact agricultural commodities
El Niño and La Niña are the warm and cool phases of a recurring climate pattern across the tropical Pacific—the El Niño-Southern Oscillation, or “ENSO” for short. The pattern shifts back and forth irregularly every two to seven years, and each phase triggers predictable disruptions of temperature, precipitation. The current La Niña has been around since October 2021. It has been responsible for the South American droughts, milder weather in Southern parts of US and heavy rainfalls across the Pacific Northwest. There is a 51% chance La Niña could continue into the December to February period, with those odds down from last month’s forecast of 58% according to the US climate prediction centre. The waters across the equatorial Pacific Ocean are expected to stay cool or be close to normal between June and September, which means the influence on weather patterns won’t be enough to disrupt tropical storms and hurricanes in the Atlantic.
Conclusion
Agricultural commodities have posted a strong performance in 2022. Yet there remain plenty of factors that could drive the performance of this commodity subsector even higher. Agricultural commodities are unique owing to their high dependence on weather conditions that make them volatile but also offer diversification benefits.
Aneeka Gupta, Director, Macroeconomic Research, WisdomTree

Parts of the Brent crude curve dipping into the high $50ies/b. Brent crude fell 2.3% over the week to Friday. It closed the week at $61.29/b, a slight gain on the day, but also traded to a low of $60.14/b that same day and just barely avoided trading into the $50ies/b. This morning it is risk-on in equities which seems to help industrial metals a little higher. But no such luck for oil. It is down 0.8% at $60.8/b. This week looks set for Brent crude to dip its feet in the $50ies/b. The Brent 3mth contract actually traded into the high $50ies/b on Friday.

The front-end backwardation has been on a weakening foot and is now about to fully disappear. The lowest point of the crude oil curve has also moved steadily lower and lower and its discount to the 5yr contract is now $6.8/b. A solid contango. The Brent 3mth contract did actually dip into the $50ies/b intraday on Friday when it traded to a low point of $59.93/b.
More weakness to come as lots of oil at sea comes to ports. Mid-East OPEC countries have boosted exports along with lower post summer consumption and higher production. The result is highly visibly in oil at sea which increased by 17 mb to 1,311 mb over the week to Sunday. Up 185 mb since mid-August. On its way to discharge at a port somewhere over the coming month or two.
Don’t forget that the oil market path ahead is all down to OPEC+. Remember that what is playing out in the oil market now is all by design by OPEC+. The group has decided that the unwind of the voluntary cuts is what it wants to do. In a combination of meeting demand from consumers as well as taking back market share. But we need to remember that how this plays out going forward is all at the mercy of what OPEC+ decides to do. It will halt the unwinding at some point. It will revert to cuts instead of unwind at some point.
A few months with Brent at $55/b and 40-50 US shale oil rigs kicked out may be what is needed. We think OPEC+ needs to see the exit of another 40-50 drilling rigs in the US shale oil patches to set US shale oil production on a path to of a 1 mb/d year on year decline Dec-25 to Dec-26. We are not there yet. But a 2-3 months period with Brent crude averaging $55/b would probably do it.
Oil on water increased 17 mb over the week to Sunday while oil in transit increased by 23 mb. So less oil was standing still. More was moving.

Crude oil floating storage (stationary more than 7 days). Down 11 mb over week to Sunday

The lowest point of the Brent crude oil curve versus the 5yr contract. Weakest so far this year.

Crude oil 1mth to 3mth time-spreads. Dubai held out strongly through summer, but then that center of strength fell apart in late September and has been leading weakness in crude curves lower since then.

Rebounding along with most markets. But concerns over solidity of Gaza peace may also contribute. Brent crude fell 0.8% yesterday to $61.91/b and its lowest close since May this year. This morning it is bouncing up 0.9% to $62.5/b along with a softer USD amid positive sentiment with both equities and industrial metals moving higher. Concerns that the peace in Gaza may be less solid than what one might hope for also yields some support to Brent. Bets on tech stocks are rebounding, defying fears of trade war. Money moving back into markets. Gold continues upwards its strong trend and a softer dollar helps it higher today as well.
US crude & products probably rose 5.6 mb last week (API) versus a normal seasonal decline of 2.4 mb. The US API last night partial and thus indicative data for US oil inventories. Their data indicates that US crude stocks rose 7.4 mb last week, gasoline stocks rose 3.0 mb while Distillate stocks fell 4.8 mb. Altogether an increase in commercial crude and product stocks of 5.6 mb. Commercial US crude and product stocks normally decline by 2.4 mb this time of year. So seasonally adjusted the US inventories rose 8 mb last week according to the indicative numbers by the API. That is a lot. Also, the counter seasonal trend of rising stocks versus normally declining stocks this time of year looks on a solid pace of continuation. If the API is correct then total US crude and product stocks would stand 41 mb higher than one year ago and 6 mb higher than the 2015-19 average. And if we combine this with our knowledge of a sharp increase in production and exports by OPEC(+) and a large increase in oil at sea, then the current trend in US oil inventories looks set to continue. So higher stocks and lower crude oil prices until OPEC(+) switch to cuts. Actual US oil inventory data today at 18:00 CET.
US commercial crude and product stocks rising to 1293 mb in week 41 if last nights indicative numbers from API are correct.

Crude oil soon coming to a port near you. OPEC has lifted production sharply higher this autumn. At the same time demand for oil in the Middle-East has fallen as we have moved out of summer heat and crude oil burn for power for air-conditioning. The Middle-East oil producers have thus been able to lift exports higher on both accounts. Crude oil and condensates on water has shot up by 177 mb since mid-August. This oil is now on its way to ports around the world. And when they arrive, it will likely help to lift stocks onshore higher. That is probably when we will lose the last bit of front-end backwardation the the crude oil curves. That will help to drive the front-month Brent crude oil price down to the $60/b line and revisit the high $50ies/b. Then the eyes will be all back on OPEC+ when they meet in early November and then again in early December.
Crude oil and condensates at sea have moved straight up by 177 mb since mid-August as OPEC(+) has produced more, consumed less and exported more.

When it starts to move lower it moves rather quickly. Gaza, China, IEA. Brent crude is down 2.1% today to $62/b after having traded as high as $66.58/b last Thursday and above $70/b in late September. The sell-off follows the truce/peace in Gaze, a flareup in US-China trade and yet another bearish oil outlook from the IEA.
A lasting peace in Gaze could drive crude oil at sea to onshore stocks. A lasting peace in Gaza would probably calm down the Houthis and thus allow more normal shipments of crude oil to sail through the Suez Canal, the Red Sea and out through the Bab-el-Mandeb Strait. Crude oil at sea has risen from 48 mb in April to now 91 mb versus a pre-Covid normal of about 50-60 mb. The rise to 91 mb is probably the result of crude sailing around Africa to be shot to pieces by the Houthis. If sailings were to normalize through the Suez Canal, then it could free up some 40 mb in transit at sea moving onshore into stocks.
The US-China trade conflict is of course bearish for demand if it continues.
Bearish IEA yet again. Getting closer to 2026. Credibility rises. We expect OPEC to cut end of 2025. The bearish monthly report from the IEA is what it is, but the closer we get to 2026, the more likely the IEA is of being ball-park right in its outlook. In its monthly report today the IEA estimates that the need for crude oil from OPEC in 2026 will be 25.4 mb/d versus production by the group in September of 29.1 mb/d. The group thus needs to do some serious cutting at the end of 2025 if it wants to keep the market balanced and avoid inventories from skyrocketing. Given that IEA is correct that is. We do however expect OPEC to implement cuts to avoid a large increase in inventories in Q1-26. The group will probably revert to cuts either at its early December meeting when they discuss production for January or in early January when they discuss production for February. The oil price will likely head yet lower until the group reverts to cuts.
Dubai: The Mid-East anchor dragging crude oil lower. Surplus emerging in Mid-East pricing. Crude oil prices held surprisingly strong all through the summer. A sign and a key source of that strength came from the strength in the front-end backwardation of the Dubai crude oil curve. It held out strong from mid-June and all until late September with an average 1-3mth time-spread premium of $1.8/b from mid-June to end of September. The 1-3mth time-spreads for Brent and WTI however were in steady deterioration from late June while their flat prices probably were held up by the strength coming from the Persian Gulf. Then in late September the strength in the Dubai curve suddenly collapsed. Since the start of October it has been weaker than both the Brent and the WTI curves. The Dubai 1-3mth time-spread now only stands at $0.25/b. The Middle East is now exporting more as it is producing more and also consuming less following elevated summer crude burn for power (Aircon) etc.
The only bear-element missing is a sudden and solid rise in OECD stocks. The only thing that is missing for the bear-case everyone have been waiting for is a solid, visible rise in OECD stocks in general and US oil stocks specifically. So watch out for US API indications tomorrow and official US oil inventories on Thursday.
No sign of any kind of fire-sale of oil from Saudi Arabia yet. To what we can see, Saudi Arabia is not at all struggling to sell its oil. It only lowered its Official Selling Prices (OSPs) to Asia marginally for November. A surplus market + Saudi determination to sell its oil to the market would normally lead to a sharp lowering of Saudi OSPs to Asia. Not yet at least and not for November.
The 5yr contract close to fixed at $68/b. Of importance with respect to how far down oil can/will go. When the oil market moves into a surplus then the spot price starts to trade in a large discount to the 5yr contract. Typically $10-15/b below the 5yr contract on average in bear-years (2009, 2015, 2016, 2020). But the 5yr contract is usually pulled lower as well thus making this approach a moving target. But the 5yr contract price has now been rock solidly been pegged to $68/b since 2022. And in the 2022 bull-year (Brent spot average $99/b), the 5yr contract only went to $72/b on average. If we assume that the same goes for the downside and that 2026 is a bear-year then the 5yr goes to $64/b while the spot is trading at a $10-15/b discount to that. That would imply an average spot price next year of $49-54/b. But that is if OPEC doesn’t revert to cuts and instead keeps production flowing. We think OPEC(+) will trim/cut production as needed into 2026 to prevent a huge build-up in global oil stocks and a crash in prices. But for now we are still heading lower. Into the $50ies/b.


Gruvbolaget Boliden överträffade analytikernas förväntningar

Australien och USA investerar 8,5 miljarder USD för försörjningskedja av kritiska mineraler
Brent crude set to dip its feet into the high $50ies/b this week

Vad guldets uppgång egentligen betyder för världen

Spotpriset på guld över 4300 USD och silver över 54 USD

OPEC+ missar produktionsmål, stöder oljepriserna

Goldman Sachs höjer prognosen för guld, tror priset når 4900 USD

Ett samtal om guld, olja, fjärrvärme och förnybar energi

Blykalla och amerikanska Oklo inleder ett samarbete
Guld nära 4000 USD och silver 50 USD, därför kan de fortsätta stiga
-
 Nyheter4 veckor sedan
OPEC+ missar produktionsmål, stöder oljepriserna
-
 Nyheter2 veckor sedan
Goldman Sachs höjer prognosen för guld, tror priset når 4900 USD
-
 Nyheter4 veckor sedan
Ett samtal om guld, olja, fjärrvärme och förnybar energi
-
 Nyheter3 veckor sedan
Blykalla och amerikanska Oklo inleder ett samarbete
-
 Nyheter3 veckor sedan
Guld nära 4000 USD och silver 50 USD, därför kan de fortsätta stiga
-
Analys4 veckor sedan
Are Ukraine’s attacks on Russian energy infrastructure working?
-
Nyheter3 veckor sedan
Ett samtal om guld, olja, koppar och stål
-

 Nyheter2 veckor sedan
Nytt prisrekord, guld stiger över 4000 USD