

Analys
Agricultural commodities could offer a hedge against inflation


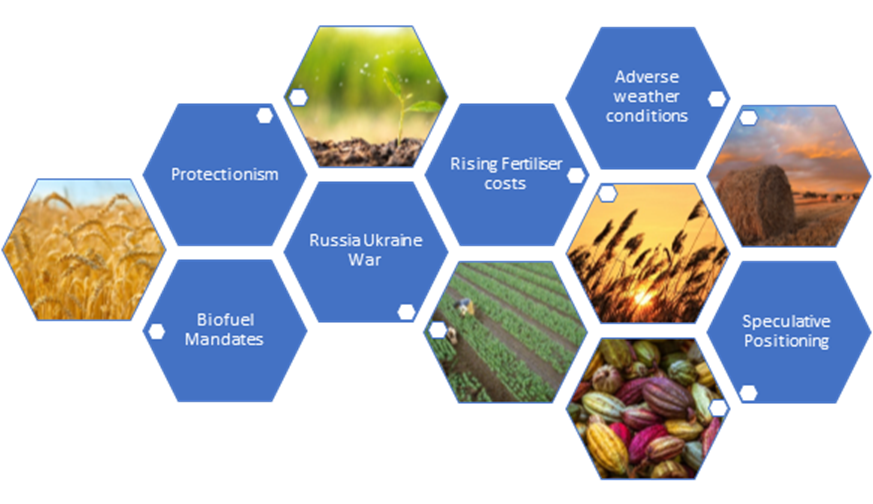
Agricultural commodity prices have been buoyed higher by rising grain and oilseed prices. At a time, when global equities have sold off by nearly 13.88% amidst soaring inflation and tightening liquidity conditions, agricultural commodities are up 26.8%. There are a plethora of supply side issues emanating from the war that are likely to continue to drive prices higher – the rise of protectionism, higher fertiliser costs, changing biofuel mandates and adverse weather conditions to name a few. The Russia-Ukraine war has had ripple effects from disrupting supply chains to raising fertiliser costs.
Rising protectionism buoys agricultural commodities higher
The war-related disruptions have also given rise to protectionism. To cite a few examples in 2022– India, the world’s third largest wheat producer, announced it would restrict wheat exports to manage domestic supplies of the grain, which led to a sharp rise in wheat prices. Indonesia also announced an export ban on palm oil on April 28, but the ban was lifted on May 19 after hundreds of farmers rallied to protest the move. In a tight oil-seeds markets, the initial announcement led soybean oil, an alternative to palm oil, sharply higher.
Higher biofuel blending mandates to bolster demand for corn and soybean oil
Changes in the biofuel blending mandates are also poised to increase demand for agricultural commodities. The US is home to the world’s largest biofuel market. The Biden administration is ordering refiners to boost the use of biofuels such as corn-based ethanol. The US Environmental Protection Agency (EPA) is requiring refiners to mix 20.63 billion gallons of renewable fuels into gasoline and diesel this year, marking a 9.5% increase over last year’s target. This will put pressure on refiners to blend more biofuel into their gasoline production this year, resulting in a net positive impact on the biofuels industry. Grains such as corn stand to benefit owing to their high starch content and relatively easy conversion to ethanol. Amidst waning stockpiles of diesel, Brazil is also considering increasing the biodiesel blend to 15% from 10% (i.e. the amount of soybean oil blended into trucking fuel). This has the potential to bolster demand for soybeans at a time when soybeans are already in short supply due to droughts in South America and US plantings trail last year’s pace.
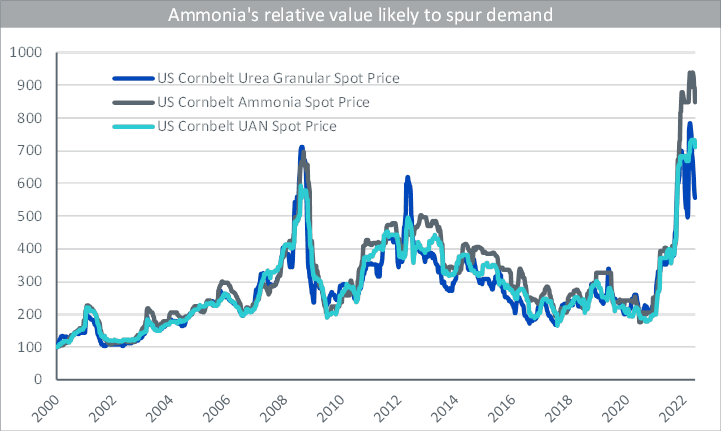
Rising fertiliser costs are weakening demand, in turn lowering yields
The Russia-Ukraine conflict has caused disruptions in fertiliser production and material price increases, which has put farmer margins and agricultural yields at risk elsewhere, driving the prices of most agricultural commodities higher. Russia and Ukraine account for a significant share of the global fertiliser trade. Russia produces 9% of global nitrogen fertiliser, 10% of global phosphate fertiliser, and 20% of global potash fertiliser. It exports more than two thirds of its production of each product. Belarus produces an additional 17% of global potash and exports most of it.
Owing to its high soil quality, Argentina tends to use less fertilisers, but Brazil (the world’s largest importer of fertilisers) of which 85% of its needs are imported, is likely to feel the impact more. Russia alone accounts for 25% of Brazil’s total fertiliser imports. Farmers can also plant more soybeans, which require less fertilisers than corn. The US and global corn balance are set to continue to tighten, which suggests that the current high price environment is set to linger. The high prices and low availability of fertilisers is making farmers reduce usage and is also resulting in lower fertiliser prices similar to the trend witnessed back in 2008.
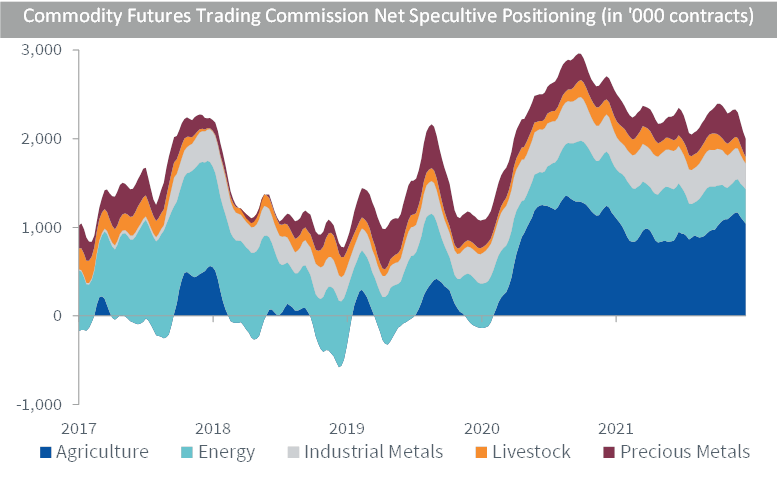
Speculative positioning garnering momentum among agricultural commodities
According to data from the Commodity Futures Trading Commission (CFTC), net speculative positioning in agricultural commodities has risen considerably since the covid pandemic. Tighter supply coupled with stockpiling by national governments concerned about food security has led to a rise in agricultural commodity prices. Not only has net speculative positioning on agricultural commodities risen versus its own history but also in comparison to other commodity subsectors, as illustrated in the chart below:
Adverse weather conditions impact agricultural commodities
El Niño and La Niña are the warm and cool phases of a recurring climate pattern across the tropical Pacific—the El Niño-Southern Oscillation, or “ENSO” for short. The pattern shifts back and forth irregularly every two to seven years, and each phase triggers predictable disruptions of temperature, precipitation. The current La Niña has been around since October 2021. It has been responsible for the South American droughts, milder weather in Southern parts of US and heavy rainfalls across the Pacific Northwest. There is a 51% chance La Niña could continue into the December to February period, with those odds down from last month’s forecast of 58% according to the US climate prediction centre. The waters across the equatorial Pacific Ocean are expected to stay cool or be close to normal between June and September, which means the influence on weather patterns won’t be enough to disrupt tropical storms and hurricanes in the Atlantic.
Conclusion
Agricultural commodities have posted a strong performance in 2022. Yet there remain plenty of factors that could drive the performance of this commodity subsector even higher. Agricultural commodities are unique owing to their high dependence on weather conditions that make them volatile but also offer diversification benefits.
Aneeka Gupta, Director, Macroeconomic Research, WisdomTree

Some rebound but not much. Brent crude rebounded 1.5% yesterday to $65.47/b. This morning it is inching 0.2% up to $65.6/b. The lowest close last week was on Thursday at $64.11/b.

The curve structure is almost as week as it was before the weekend. The rebound we now have gotten post the message from OPEC+ over the weekend is to a large degree a rebound along the curve rather than much strengthening at the front-end of the curve. That part of the curve structure is almost as weak as it was last Thursday.
We are still on a weakening path. The message from OPEC+ over the weekend was we are still on a weakening path with rising supply from the group. It is just not as rapidly weakening as was feared ahead of the weekend when a quota hike of 500 kb/d/mth for November was discussed.
The Brent curve is on its way to full contango with Brent dipping into the $50ies/b. Thus the ongoing weakening we have had in the crude curve since the start of the year, and especially since early June, will continue until the Brent crude oil forward curve is in full contango along with visibly rising US and OECD oil inventories. The front-month Brent contract will then flip down towards the $60/b-line and below into the $50ies/b.
At what point will OPEC+ turn to cuts? The big question then becomes: When will OPEC+ turn around to make some cuts? At what (price) point will they choose to stabilize the market? Because for sure they will. Higher oil inventories, some more shedding of drilling rigs in US shale and Brent into the 50ies somewhere is probably where the group will step in.
There is nothing we have seen from the group so far which indicates that they will close their eyes, let the world drown in oil and the oil price crash to $40/b or below.
The message from OPEC+ is also about balance and stability. The world won’t drown in oil in 2026. The message from the group as far as we manage to interpret it is twofold: 1) Taking back market share which requires a lower price for non-OPEC+ to back off a bit, and 2) Oil market stability and balance. It is not just about 1. Thus fretting about how we are all going to drown in oil in 2026 is totally off the mark by just focusing on point 1.
When to buy cal 2026? Before Christmas when Brent hits $55/b and before OPEC+ holds its last meeting of the year which is likely to be in early December.
Brent crude oil prices have rebounded a bit along the forward curve. Not much strengthening in the structure of the curve. The front-end backwardation is not much stronger today than on its weakest level so far this year which was on Thursday last week.

The front-end backwardation fell to its weakest level so far this year on Thursday last week. A slight pickup yesterday and today, but still very close to the weakest year to date. More oil from OPEC+ in the coming months and softer demand and rising inventories. We are heading for yet softer levels.

Down to the lowest since early May. Brent crude has fallen sharply the latest four days. It closed at USD 64.11/b yesterday which is the lowest since early May. It is staging a 1.3% rebound this morning along with gains in both equities and industrial metals with an added touch of support from a softer USD on top.
What stands out the most to us this week is the collapse in the Dubai one to three months time-spread.
Dubai is medium sour crude. OPEC+ is in general medium sour crude production. Asian refineries are predominantly designed to process medium sour crude. So Dubai is the real measure of the balance between OPEC+ holding back or not versus Asian oil demand for consumption and stock building.
A sharp weakening of the front-end of the Dubai curve. The front-end of the Dubai crude curve has been holding out very solidly throughout this summer while the front-end of the Brent and WTI curves have been steadily softening. But the strength in the Dubai curve in our view was carrying the crude oil market in general. A source of strength in the crude oil market. The core of the strength.
The now finally sharp decline of the front-end of the Dubai crude curve is thus a strong shift. Weakness in the Dubai crude marker is weakness in the core of the oil market. The core which has helped to hold the oil market elevated.
Facts supports the weakening. Add in facts of Iraq lifting production from Kurdistan through Turkey. Saudi Arabia lifting production to 10 mb/d in September (normal production level) and lifting exports as well as domestic demand for oil for power for air con is fading along with summer heat. Add also in counter seasonal rise in US crude and product stocks last week. US oil stocks usually decline by 1.3 mb/week this time of year. Last week they instead rose 6.4 mb/week (+7.2 mb if including SPR). Total US commercial oil stocks are now only 2.1 mb below the 2015-19 seasonal average. US oil stocks normally decline from now to Christmas. If they instead continue to rise, then it will be strongly counter seasonal rise and will create a very strong bearish pressure on oil prices.
Will OPEC+ lift its voluntary quotas by zero, 137 kb/d, 500 kb/d or 1.5 mb/d? On Sunday of course OPEC+ will decide on how much to unwind of the remaining 1.5 mb/d of voluntary quotas for November. Will it be 137 kb/d yet again as for October? Will it be 500 kb/d as was talked about earlier this week? Or will it be a full unwind in one go of 1.5 mb/d? We think most likely now it will be at least 500 kb/d and possibly a full unwind. We discussed this in a not earlier this week: ”500 kb/d of voluntary quotas in October. But a full unwind of 1.5 mb/d”
The strength in the front-end of the Dubai curve held out through summer while Brent and WTI curve structures weakened steadily. That core strength helped to keep flat crude oil prices elevated close to the 70-line. Now also the Dubai curve has given in.

Brent crude oil forward curves

Total US commercial stocks now close to normal. Counter seasonal rise last week. Rest of year?

Total US crude and product stocks on a steady trend higher.

Analys
OPEC+ will likely unwind 500 kb/d of voluntary quotas in October. But a full unwind of 1.5 mb/d in one go could be in the cards
Down to mid-60ies as Iraq lifts production while Saudi may be tired of voluntary cut frugality. The Brent December contract dropped 1.6% yesterday to USD 66.03/b. This morning it is down another 0.3% to USD 65.8/b. The drop in the price came on the back of the combined news that Iraq has resumed 190 kb/d of production in Kurdistan with exports through Turkey while OPEC+ delegates send signals that the group will unwind the remaining 1.65 mb/d (less the 137 kb/d in October) of voluntary cuts at a pace of 500 kb/d per month pace.
Signals of accelerated unwind and Iraqi increase may be connected. Russia, Kazakhstan and Iraq were main offenders versus the voluntary quotas they had agreed to follow. Russia had a production ’debt’ (cumulative overproduction versus quota) of close to 90 mb in March this year while Kazakhstan had a ’debt’ of about 60 mb and the same for Iraq. This apparently made Saudi Arabia angry this spring. Why should Saudi Arabia hold back if the other voluntary cutters were just freeriding? Thus the sudden rapid unwinding of voluntary cuts. That is at least one angle of explanations for the accelerated unwinding.
If the offenders with production debts then refrained from lifting production as the voluntary cuts were rapidly unwinded, then they could ’pay back’ their ’debts’ as they would under-produce versus the new and steadily higher quotas.
Forget about Kazakhstan. Its production was just too far above the quotas with no hope that the country would hold back production due to cross-ownership of oil assets by international oil companies. But Russia and Iraq should be able to do it.
Iraqi cumulative overproduction versus quotas could reach 85-90 mb in October. Iraq has however steadily continued to overproduce by 3-5 mb per month. In July its new and gradually higher quota came close to equal with a cumulative overproduction of only 0.6 mb that month. In August again however its production had an overshoot of 100 kb/d or 3.1 mb for the month. Its cumulative production debt had then risen to close to 80 mb. We don’t know for September yet. But looking at October we now know that its production will likely average close to 4.5 mb/d due to the revival of 190 kb/d of production in Kurdistan. Its quota however will only be 4.24 mb/d. Its overproduction in October will thus likely be around 250 kb/d above its quota with its production debt rising another 7-8 mb to a total of close to 90 mb.
Again, why should Saudi Arabia be frugal while Iraq is freeriding. Better to get rid of the voluntary quotas as quickly as possible and then start all over with clean sheets.
Unwinding the remaining 1.513 mb/d in one go in October? If OPEC+ unwinds the remaining 1.513 mb/d of voluntary cuts in one big go in October, then Iraq’s quota will be around 4.4 mb/d for October versus its likely production of close to 4.5 mb/d for the coming month..
OPEC+ should thus unwind the remaining 1.513 mb/d (1.65 – 0.137 mb/d) in one go for October in order for the quota of Iraq to be able to keep track with Iraq’s actual production increase.
October 5 will show how it plays out. But a quota unwind of at least 500 kb/d for Oct seems likely. An overall increase of at least 500 kb/d in the voluntary quota for October looks likely. But it could be the whole 1.513 mb/d in one go. If the increase in the quota is ’only’ 500 kb/d then Iraqi cumulative production will still rise by 5.7 mb to a total of 85 mb in October.
Iraqi production debt versus quotas will likely rise by 5.7 mb in October if OPEC+ only lifts the overall quota by 500 kb/d in October. Here assuming historical production debt did not rise in September. That Iraq lifts its production by 190 kb/d in October to 4.47 mb/d (August level + 190 kb/d) and that OPEC+ unwinds 500 kb/d of the remining quotas in October when they decide on this on 5 October.


Silver spränger den magiska gränsen, kostar nu över 50 USD per uns

Blykalla, Evroc och Studsvik vill bygga kärnkraftsdrivna datacenter i Sverige

Toppmöte om framtidens kärnkraft runt Östersjön hölls idag

Nytt prisrekord, guld stiger över 4000 USD

Goldman Sachs höjer prognosen för guld, tror priset når 4900 USD

Mahvie Minerals i en guldtrend
Volatile but going nowhere. Brent crude circles USD 66 as market weighs surplus vs risk

Aktier i guldbolag laggar priset på guld

Kinas elproduktion slog nytt rekord i augusti, vilket även kolkraft gjorde

Tyskland har så höga elpriser att företag inte har råd att använda elektricitet
-
 Nyheter4 veckor sedan
Mahvie Minerals i en guldtrend
-
Analys4 veckor sedan
Volatile but going nowhere. Brent crude circles USD 66 as market weighs surplus vs risk
-
 Nyheter4 veckor sedan
Aktier i guldbolag laggar priset på guld
-
 Nyheter3 veckor sedan
Kinas elproduktion slog nytt rekord i augusti, vilket även kolkraft gjorde
-
Nyheter3 veckor sedan
Tyskland har så höga elpriser att företag inte har råd att använda elektricitet
-

 Nyheter4 veckor sedan
Guld når sin högsta nivå någonsin, nu även justerat för inflation
-

 Nyheter4 veckor sedan
Det stigande guldpriset en utmaning för smyckesköpare
-
Analys4 veckor sedan
Waiting for the surplus while we worry about Israel and Qatar