

Analys
USD weakness, inventory draws and a pinch of Venezuela concerns

 Last week Brent crude gained 9.3% w/w with a close of $52.52/b on Friday. WTI gained comparably much (+8.6%) with a close of $49.71/b. The main gains were in the front end of the crude curves leading to a substantial flattening of the forward curves. Brent crude Dec 2020 only gained 2.6% with a close of $54.72/b and thus a way smaller gain than in the front end of the forward curves. For WTI the front end contract now only sits $0.34/b below the 18 mth forward WTI contracts which closed the week at $50.05/b.
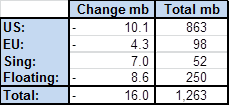
Continued inventory draws last week underpinned the crude oil price rally and the flattening of the forward crude curves. Weekly inventory data last week saw draws of 16 mb of which 10 mb were in the US while a reduction of 8.6 mb in floating storage also took a solid bite. Over the past 5 weeks inventories have drawn down some 70 mb in weekly data. Thus inventory draws kicked in and accelerated almost on the clock as we entered stronger seasonal consumption in Q3-17. Since mid-March weekly data indicate an inventory draw of 104 mb of which 76 mb took place in the US while 18 mb were drawn in floating storage. Refineries are rapidly coming back online with increased crude oil consumption as a result. There are still more refineries to come back online both in Asia and LatAm while Europe and Africa are mostly all up and running. We expect continued draws in H2-17.
Saudi Arabia of course added some extra fuel on the fire last week as they promised exports of no more than 6.6 mb/d in August. That would be their lowest monthly export since early 2011 (not including oil products). From Jan-May Saudi Arabia exported 7.17 kb/d. If it sticks to 6.6 mb/d exports in August it will be a reduction of 705 kb/d y/y versus its pledged production cut of 490 kb/d. The lower export pledged in August of course coincide with high domestic summer demand in Saudi Arabia. As such it remains to be seen whether the export cap of 6.6 mb/d remains in place after August. What it shows more than anything is determination by the Saudi energy minister Al-Falih. Determination to draw inventories down and the time to do it is H2-17 before US shale oil revival extends too far in 2018. It is thus possible that Saudi Arabia maintains its export cap beyond August.
The softening in the US dollar has definitely underpinned the whole crude oil rally. It has underpinned a rally in the whole commodity complex. Over the past 5 weeks Bloomberg’s commodity index has gained 8.3% with 11.9% in Energy, 8.3% in Agri, 7% in Industrial metals and 1% in precious. The USD index has declined a substantial 4.1% over the period with half of the overall commodity index gain being a nominal impact from a softer dollar. IMF’s upgrade last week of growth in Europe, Japan and China while downgrading US growth from 2.3% to 2.1% (little hope for promised tax cuts) is the example in case which drives the dollar lower. US growth has been ahead of the curve for a long time and now the rest of the world is catching up. If the dollar weakness continues it will undoubtedly drive commodity prices in general and oil prices specifically higher in nominal terms. With the 4.1% USD Index decline over the past 5 weeks the Brent crude Dec 2020 contract has gained 5.5%. Thus almost all of this can be attributed to the dollar effect.
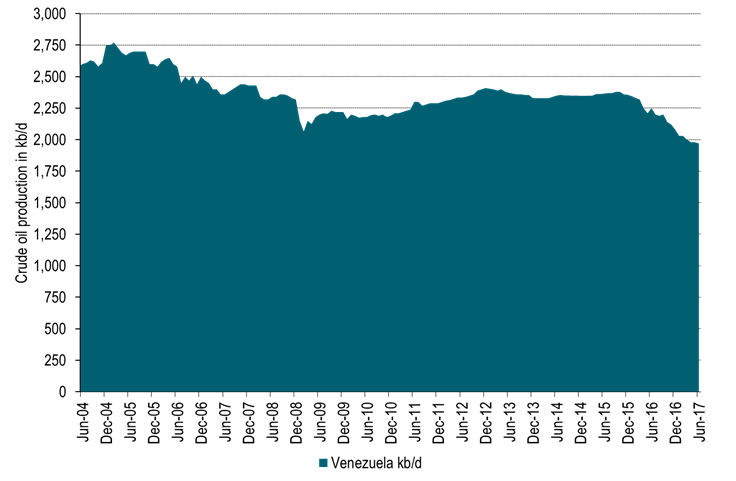
The deteriorating situation in Venezuela probably adds some support to oil prices as well. A national election was held this weekend to vote for members of a National Constituent Assembly. This Assembly will have no fixed term, it will have powers to rewrite the constitution. It will supersede the National Assembly and hand Nicolas Maduro close to dictatorial power and end close to six decades of democracy. At least 10 people were killed in clashes during the election this weekend and some 120 people have been killed in uprisings since April. Venezuela probably holds the world’s largest oil reserves (297 billion barrels) and produced 1.97 mb/d in June (Blberg) which is close to exactly equal to the production cap under the current OPEC production agreement. Its production has however deteriorated steadily due to lack of investments with production standing at 2.37 mb/d back in July 2015. The main concern in the oil market following the election is possible sanctions by Donald Trump. The US buys a third of Venezuela’s oil exports. Extensive US sanctions could make it almost impossible for international oil companies to work in Venezuela. For now the market is awaiting reactions from Donald Trump.
Today equities are up across the board, industrial metals are up 1% and Brent crude traded as much as 0.8% higher before now trading flat at $52.5/b. Thus so far this morning crude oil is lagging behind the gains in industrial metals. Crude oil is trading cautiously following five consecutive days of solid gains. A slight negative this morning is the USD Index which gains 0.3%. We expect to see further oil inventory draws also this week. If the USD Index also continues on its softening trend the two drivers are likely to push crude oil prices yet higher also this week. Money managers have added net long positions for 4 weeks in a row now but probably have room to add more. Producers are likely to sell into the forward crude prices. This is likely to hold back gains for medium term crude prices while inventory draws and investor appetite continues to push upwards in the front leading to a yet flatter crude curve. Potentially shifting the curves into backwardation.
The crude oil inventory draws taking place at the moment are of course real and they will draw down more during H2-17. Still it is important to remember that they are artificially managed by a 1.8 mb/d cut by OPEC and some non-OPEC members. Currently they help to draw down invnetories and to flatten curude curves. When needed however, the volumes will be put back into the market some time in 2018 or 2019.
Ch 1: Inventories in global weekly data drew 16 mb last week.
Over the past 5 weeks inventories have drawn down 70 mb in weekly data
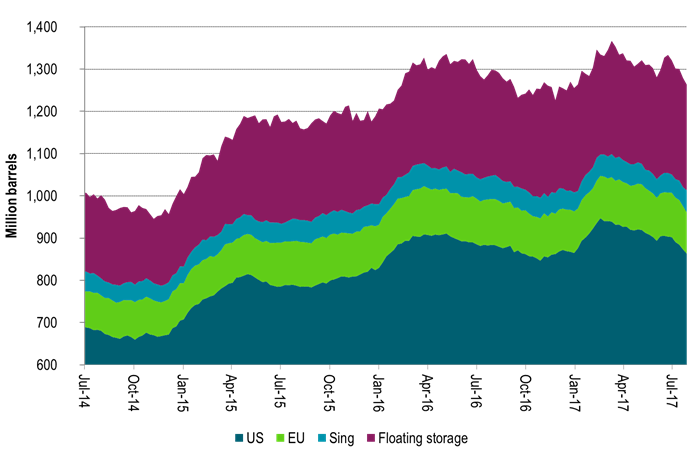
Ch2: US crude and product stocks now well below last year
And down y/y first time since 2014
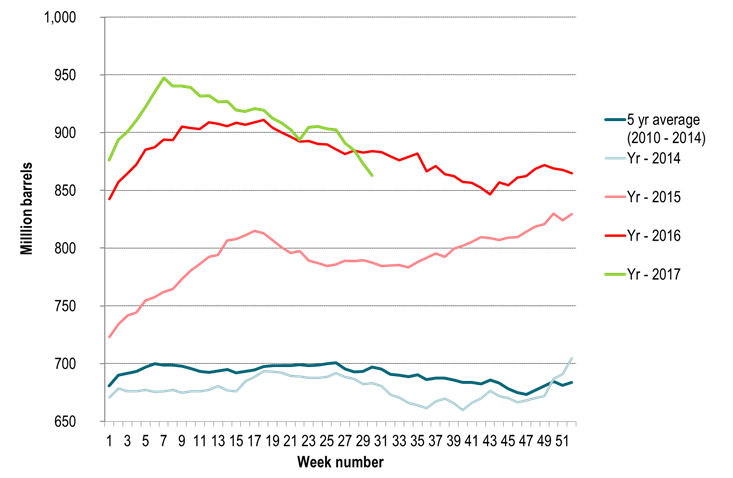
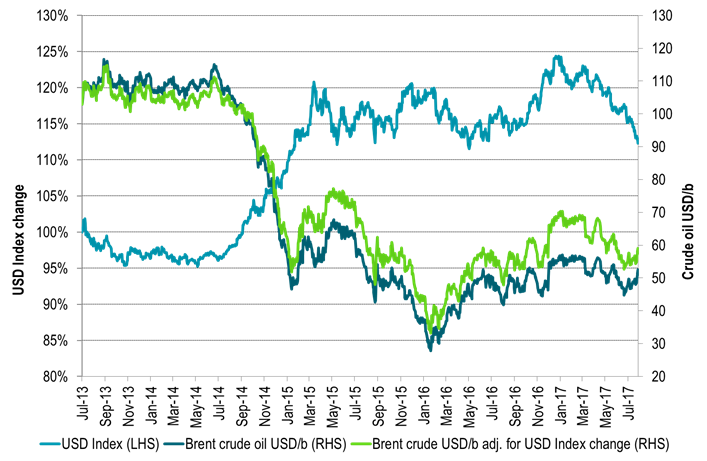
Ch3: The USD Index has moved down 9.6% since the start of the year
More specifically it has moved down 4.2% since crude oil prices bottomed out in June 21st.
It is now the weakest since a brief sell-off in February 2016.
However, it needs to decline another 15% to get down the the weakness it had in 2014.
Ch4: If we had had USD weakness as in 2014 we should nominally have had an oil price of close to $60/b
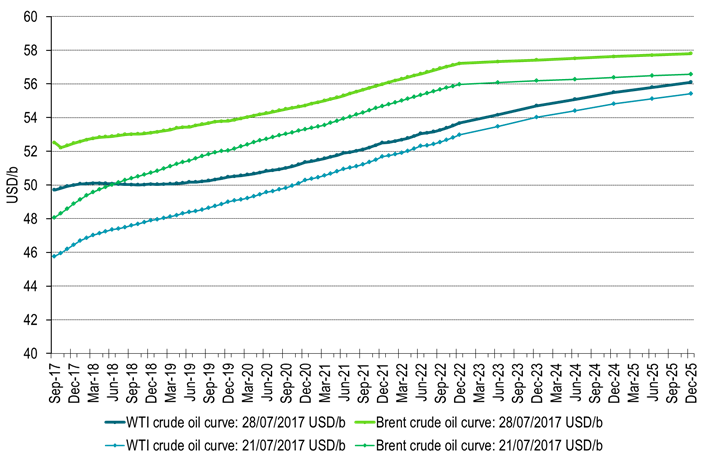
Ch5: Crude oil forward curves flattened substantially last week
As investors and refineries bought the front while producers probably sold into the rally out on the curve
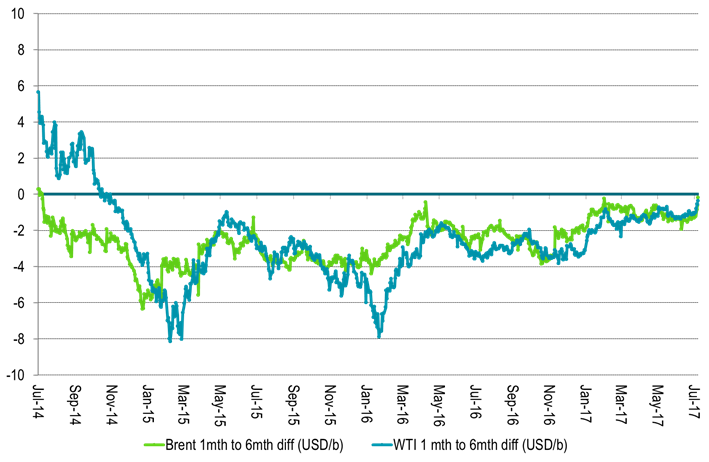
Ch6: The 1 to 6mth crude time spreads got close to zero
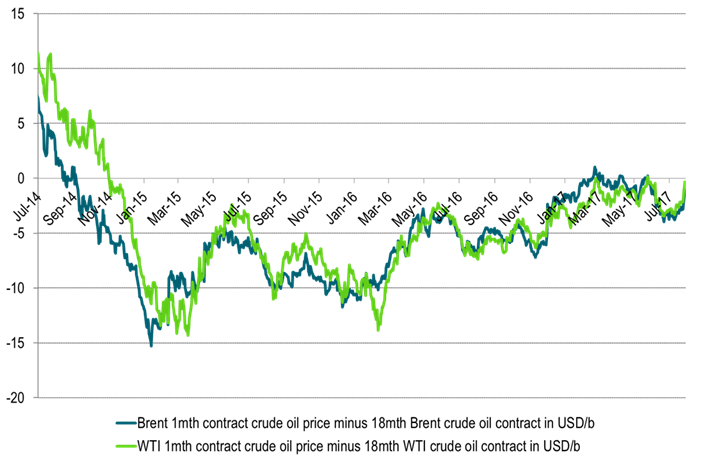
Ch7: And crude time spreads of 1mth to 18mth were not far away either
With WTI 1mth closing just $0.34/b below the 18mth on Friday and trading just $0.19/b below today
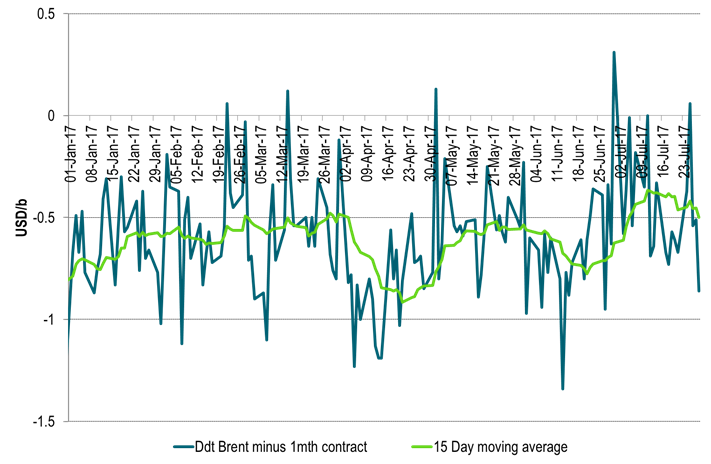
Ch8: A word of caution though. The tightness is not so evident in the Brent crude oil spot market
Dated Brent still trades at a $0.5/b discount to the 1mth contract in a sign that deficit of crude oil is still not quite yet here
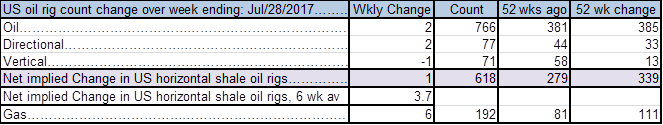
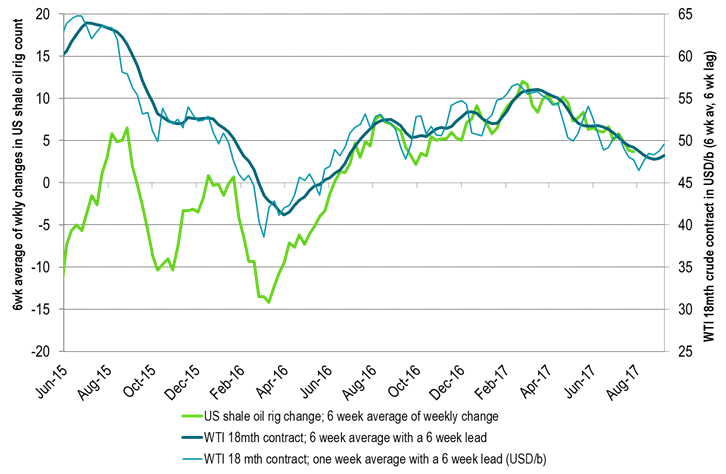
Ch9: US oil players added 2 rigs last week
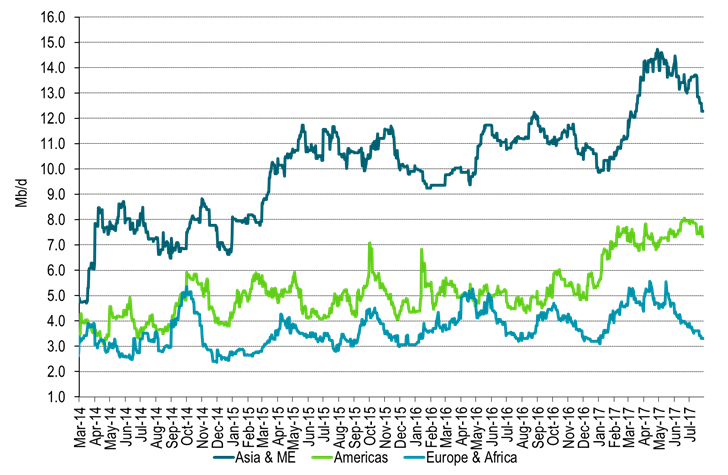
Ch10: Global refineries are rapidly getting back on line consuming more crude oil
More to come in Asia, ME and LatAm
Ch11: Deteriorating crude production in Venezuela
Production could be hit hard by possible US sanctions
Ch12: Net long managed money probably has room to add more length
Even though length has been added 4 weeks in a row now

Kind regards
Bjarne Schieldrop
Chief analyst, Commodities
SEB Markets
Merchant Banking
Market is starting to take US/Iran headlines with a pinch of salt. Brent crude rose $2.8/b yesterday to an official close of $112.1/b. But after that it traded as low as $108.05/b before ending late night at around $109.7/b. Through the day it traded in a range of $106.87 – 112.72/b amid a flurry of news or rumors from Iran and the US. ”US temporary sanctions during negotiations” (falls alarm). ”We will bomb Iran” (not anyhow),… etc. While the market is still fluctuating to this kind of news flow, it is starting to take such headlines with a pinch of salt.

We’ll see. Maybe, maybe not. The Brent M1 contract is trading at $110.2/b this morning which very close to the average ticks through yesterday of $110.4/b.
Trump with bearish, verbal intervention whenever Brent trades above $110/b it seems. What seems to be a pattern is that Trump states something like ”very good negotiations going on with Iran”, ”New leaders in Iran are great,..”, ”Great progress in negotiations,…”, ”Deal in sight,..” etc whenever the Brent M1 contract trades above $110/b. An effort to cool the market. These hot air verbal interventions from Trump used to have a heavy bearish impact on prices, but they now seems to have less and less effect unless they are backed by reality.
As far as we can see there has been no real progress in the negotiations between the US and Iran with both sides still standing by their previous demands.
Iran is getting stronger while the cease fire lasts making a return to war for Trump yet harder. Iran is naturally in constant preparation for a return to war given Trump’s steady threats of bombing Iran again. Iran is naturally doing what ever is possible to prepare for a return to war. And every day the cease fire lasts it is better prepared. This naturally makes it more and more difficult and dangerous for the US to return to warring activity versus Iran as the consequences for energy infrastructure in the Persian Gulf will be more and more severe the longer the cease fire lasts. Israel seems to see it this way as well. That the war is not won and that current frozen state of a cease fire gives Iran opportunity to rebuild military and politically.
Global inventories are drawing down day by day. How much? In the meantime the Strait of Hormuz stays closed. There is varying measures and estimates of how much global inventories are drawing down. Our rough estimate, back of the envelope, is that global inventories are drawing down by at least some 10 mb/d or about 300 mb/d in a balance between loss of supply versus demand destruction. Other estimates we see are a monthly draw of 250-270 mb/d. The IEA only ’measured’ a draw in global observable stocks of 117 mb in April with oil on water rising 53 mb while on shore stocks fell 170 mb. But global stocks are hard to measure with large invisible, unmeasured stocks. As such a back of the envelope approach may be better.
Oil products is what the world is consuming. Oil product prices likely to rise while product stocks fall. Strategic Petroleum Reserves (SPR) are predominantly crude oil. Discharging oil from OECD SPR stocks, a sharp reduction in Chinese crude imports and a reduction in global refinery throughput of 6-7 mb/d has helped to keep crude oil markets satisfactorily supplied. But global inventories are drawing down none the less. And oil products is really what the world is consuming. So if global refinery throughput stays subdued, then demand will eventually have to match the supply of oil products. The likely path forward this summer is a steady draw down in jet fuel, diesel and gasoline. Higher prices for these. Then, if possible, higher refinery throughput and higher usage of crude in response to very profitable refinery margins. And lastly sharper draw in crude stocks and higher prices for these. But some 6 mb/d of oil products used to be exported through the Strait of Hormuz. And it may not be so easy to ramp up refinery activity across the world to compensate. Especially as Ukraine continues to damage Russian refineries as well as Russian crude production and export facilities.
Watch oil product stocks and prices as well as Brent calendar 2027. What to watch for this summer is thus oil product inventories falling and oil product premiums to crude rising. Another measure to watch is the Brent crude 2027 contract as it rises steadily day by day as the Strait of Hormuz stays closed and global oil inventories decline. The latter is close to the highest level since the start of the war and keeps rising.
The Brent M1 contract and the Brent 2027 prices and current price of jet fuel in Europe (ARA). All in USD/b

Our back of the envelope calculation of the global shortage created by the closure of the Strait of Hormuz. Note that 3.5 mb/d of discharge from SPR is also a draw. Note also that ’Forced demand loss’ of 2.5 mb/d is probably temporary and will fall back towards zero as logistics are sorted out leaving ’Price demand loss’ to do the job of balancing the market. Thus a shortfall of at least 9 mb/d created by the closure. More if SPR discharge is included and more if Forced demand loss recedes.

Brent is climbing higher. Front-month is at USD 106.3/bl this morning, close to a weekly high and a USD 9/bl jump from Mondays open. This is the move we flagged as a risk earlier in the week: the market shifting from ”a deal is around the corner” to ”this is going to take longer than we thought”.

Analyst Commodities, SEB
During April, rest-of-year Brent remained remarkably stable around USD 90/bl. A stability which rested on one single assumption: the SoH reopens around 1 May. That assumption is now slowly falling apart.
As we highlighted yesterday: every week of delay beyond 1 May adds (theoretically) ish USD 5/bl to the rest-of-year average, as global inventories draw 100 million barrels per week. i.e., a mid-May reopening implies rest-of-year Brent closer to USD 100/bl, and anything pushing into June or July takes us meaningfully higher.
What’s changed in the last 48 hours:
#1: The US military has formally warned that clearing suspected sea mines from SoH could take up to six months. That is a completely different timescale from what the financial market is pricing. Even a political deal tomorrow does not immediately reopen the strait.
#2: Trump has shifted his tone from urgency to ”strategic patience”. In yesterday’s press conference: ”Don’t rush me… I want a great deal.” The market is reading this as a president no longer feeling pressured by timelines, with the naval blockade running in the background.
#3: So far, the military activity is escalating, not de-escalating. Axios reports Iran is laying more mines in SoH. The US 3rd carrier strike group (USS George H.W. Bush) is arriving with two countermine vessels. Trump yesterday ordered the US Navy to destroy any Iranian boats caught laying mines. While CNN reports that the Pentagon is actively drawing up plans to strike Iranian SoH capabilities and individual Iranian military leaders if the ceasefire collapses. i.e., NOT a attitude consistent with an imminent deal!
Spot crude and product prices eased off the early-April highs on a combination of system rerouting and deal optimism. Both now weakening. Goldman estimates April Gulf output is reduced by 14.5 mbl/d, or 57% of pre-war supply, a number that keeps getting worse the longer this drags on.
Demand-side adaptation is ongoing: S. Korea has cut its Middle East crude dependence from 69% to 56% by pulling more from the Americas and Africa, and Japan is kicking off a second round of SPR releases from 1 May. But SPRs are finite.
Ref. to the negotiations, we should not bet on speed. The current Iranian leadership is dominated by genuine hardliners willing to absorb economic pain and run the clock to extract concessions. That is not a setup for a rapid resolution. US/Israeli media briefings keep framing the delay as ”internal Iranian divisions”, the reality is more complicated and points toward weeks and months, not days.
Our point is that the complexity is large, and higher prices have only just started (given a scenario where the negotiations drag out in time). The market spent April leaning on the USD 90/bl rest-of-year assumption; that case is diminishing by the hour. If ”early May reopening” is replaced by ”June, July or later” over the next week or two, both crude and products have meaningful room to reprice higher from here. There is a high risk being short energy and betting on any immediate political resolution(!).
Down on Friday. Up on Monday. The Brent June crude oil contract traded down 5.1% last week to a close of $90.38/b. It reached a high of $103.87/b last Monday and a low of $86.09/b on Friday as Iran announced that the Strait of Hormuz was fully open for transit. That quickly changed over the weekend as the US upheld its blockade of Iranian oil exports while Iran naturally responded by closing the SoH again. The US blew a hole in the engine room of the Iranian ship TOUSKA and took custody of the ship on Sunday. Brent crude is up 5.6% this morning to $95.4/b.
The cease-fire is expiring tomorrow. The US has said it will send a delegation for a second round of negotiations in Islamabad in Pakistan. But Iran has for now rejected a second round of talks as it views US demands as unrealistic and excessive while the US is also blocking the Strait of Hormuz.
While Brent is up 5% this morning, the financial market is still very optimistic that progress will be made. That talks will continue and that the SoH will fully open by the start of May which is consistent with a rest-of-year average Brent crude oil price of around $90/b with the market now trading that balance at around $88/b.
Financial optimism vs. physical deterioration. We have a divergence where the financial market is trading negotiations, improvements and resolution while at the same time the physical market is deteriorating day by day. Physical oil flows remain constrained by disrupted flows, longer voyage times and elevated freight and insurance costs.
Financial markets are betting that a US/Iranian resolution will save us in time from violent shortages down the road. But every day that the SoH remains closed is bringing us closer to a potentially very painful point of shortages and much higher prices.
The US blockade is also a weapon of leverage against its European and Asian allies. When Iran closed the SoH it held the world economy as a hostage against the US. The US blockade of the SoH is of course blocking Iranian oil exports. But it is also an action of disruption directed towards Europe and Asia. The US has called for the rest of the world to engaged in the war with Iran: ”If you want oil from the Persian Gulf, then go and get it”. A risk is that the US plays brinkmanship with the global oil market directed towards its European and Asian allies and maybe even towards China to force them to engage and take part. Maybe unthinkable. But unthinkable has become the norm with Trump in the White House.


Sommarväder skapar prisrally på elbörsen
Oil product price pain is set to rise as the Strait of Hormuz stays closed into summer

Solkraften pressar elpriserna dagtid

Michel Gubel ger sin syn på oljemarknaden