Analys
USD weakness, inventory draws and a pinch of Venezuela concerns


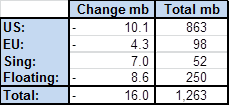
Continued inventory draws last week underpinned the crude oil price rally and the flattening of the forward crude curves. Weekly inventory data last week saw draws of 16 mb of which 10 mb were in the US while a reduction of 8.6 mb in floating storage also took a solid bite. Over the past 5 weeks inventories have drawn down some 70 mb in weekly data. Thus inventory draws kicked in and accelerated almost on the clock as we entered stronger seasonal consumption in Q3-17. Since mid-March weekly data indicate an inventory draw of 104 mb of which 76 mb took place in the US while 18 mb were drawn in floating storage. Refineries are rapidly coming back online with increased crude oil consumption as a result. There are still more refineries to come back online both in Asia and LatAm while Europe and Africa are mostly all up and running. We expect continued draws in H2-17.
Saudi Arabia of course added some extra fuel on the fire last week as they promised exports of no more than 6.6 mb/d in August. That would be their lowest monthly export since early 2011 (not including oil products). From Jan-May Saudi Arabia exported 7.17 kb/d. If it sticks to 6.6 mb/d exports in August it will be a reduction of 705 kb/d y/y versus its pledged production cut of 490 kb/d. The lower export pledged in August of course coincide with high domestic summer demand in Saudi Arabia. As such it remains to be seen whether the export cap of 6.6 mb/d remains in place after August. What it shows more than anything is determination by the Saudi energy minister Al-Falih. Determination to draw inventories down and the time to do it is H2-17 before US shale oil revival extends too far in 2018. It is thus possible that Saudi Arabia maintains its export cap beyond August.
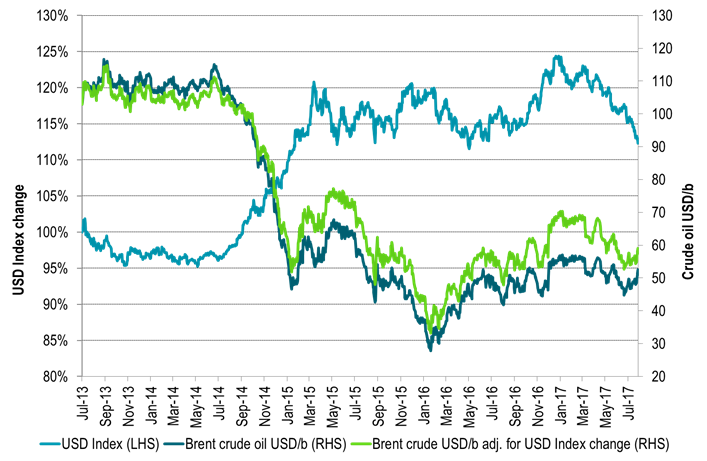
The softening in the US dollar has definitely underpinned the whole crude oil rally. It has underpinned a rally in the whole commodity complex. Over the past 5 weeks Bloomberg’s commodity index has gained 8.3% with 11.9% in Energy, 8.3% in Agri, 7% in Industrial metals and 1% in precious. The USD index has declined a substantial 4.1% over the period with half of the overall commodity index gain being a nominal impact from a softer dollar. IMF’s upgrade last week of growth in Europe, Japan and China while downgrading US growth from 2.3% to 2.1% (little hope for promised tax cuts) is the example in case which drives the dollar lower. US growth has been ahead of the curve for a long time and now the rest of the world is catching up. If the dollar weakness continues it will undoubtedly drive commodity prices in general and oil prices specifically higher in nominal terms. With the 4.1% USD Index decline over the past 5 weeks the Brent crude Dec 2020 contract has gained 5.5%. Thus almost all of this can be attributed to the dollar effect.
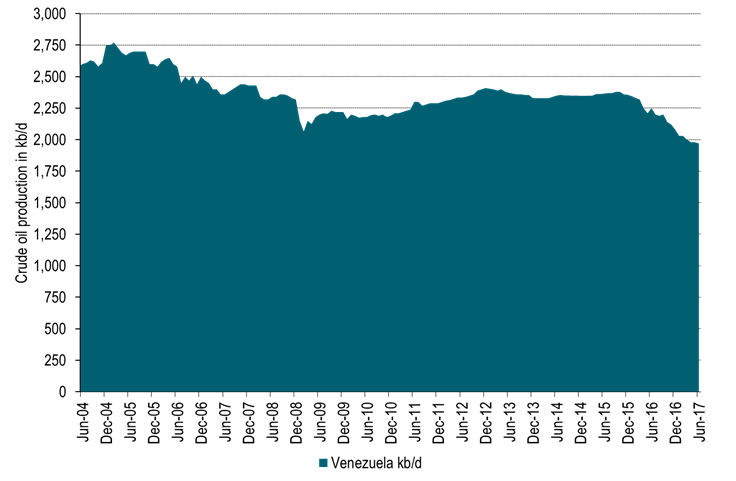
The deteriorating situation in Venezuela probably adds some support to oil prices as well. A national election was held this weekend to vote for members of a National Constituent Assembly. This Assembly will have no fixed term, it will have powers to rewrite the constitution. It will supersede the National Assembly and hand Nicolas Maduro close to dictatorial power and end close to six decades of democracy. At least 10 people were killed in clashes during the election this weekend and some 120 people have been killed in uprisings since April. Venezuela probably holds the world’s largest oil reserves (297 billion barrels) and produced 1.97 mb/d in June (Blberg) which is close to exactly equal to the production cap under the current OPEC production agreement. Its production has however deteriorated steadily due to lack of investments with production standing at 2.37 mb/d back in July 2015. The main concern in the oil market following the election is possible sanctions by Donald Trump. The US buys a third of Venezuela’s oil exports. Extensive US sanctions could make it almost impossible for international oil companies to work in Venezuela. For now the market is awaiting reactions from Donald Trump.
Today equities are up across the board, industrial metals are up 1% and Brent crude traded as much as 0.8% higher before now trading flat at $52.5/b. Thus so far this morning crude oil is lagging behind the gains in industrial metals. Crude oil is trading cautiously following five consecutive days of solid gains. A slight negative this morning is the USD Index which gains 0.3%. We expect to see further oil inventory draws also this week. If the USD Index also continues on its softening trend the two drivers are likely to push crude oil prices yet higher also this week. Money managers have added net long positions for 4 weeks in a row now but probably have room to add more. Producers are likely to sell into the forward crude prices. This is likely to hold back gains for medium term crude prices while inventory draws and investor appetite continues to push upwards in the front leading to a yet flatter crude curve. Potentially shifting the curves into backwardation.
The crude oil inventory draws taking place at the moment are of course real and they will draw down more during H2-17. Still it is important to remember that they are artificially managed by a 1.8 mb/d cut by OPEC and some non-OPEC members. Currently they help to draw down invnetories and to flatten curude curves. When needed however, the volumes will be put back into the market some time in 2018 or 2019.
Ch 1: Inventories in global weekly data drew 16 mb last week.
Over the past 5 weeks inventories have drawn down 70 mb in weekly data

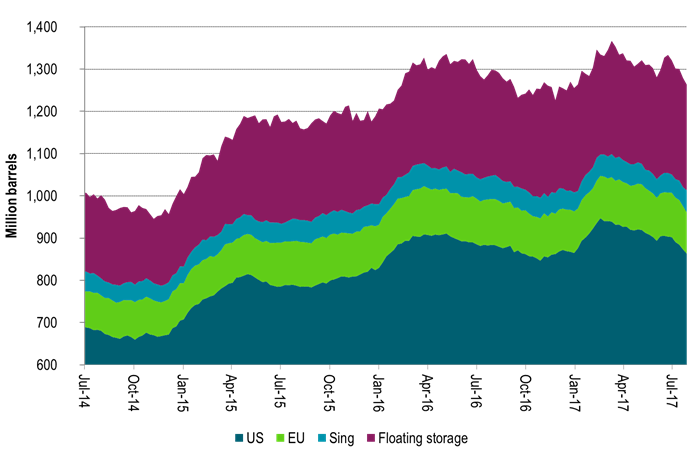

Ch2: US crude and product stocks now well below last year
And down y/y first time since 2014
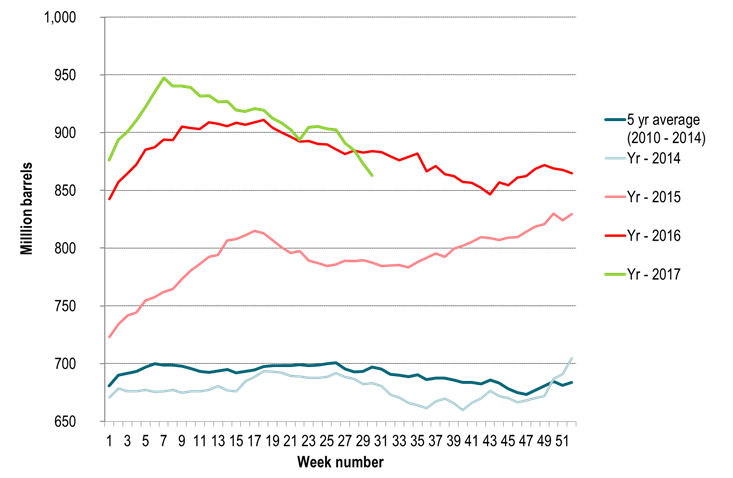

Ch3: The USD Index has moved down 9.6% since the start of the year
More specifically it has moved down 4.2% since crude oil prices bottomed out in June 21st.
It is now the weakest since a brief sell-off in February 2016.
However, it needs to decline another 15% to get down the the weakness it had in 2014.

Ch4: If we had had USD weakness as in 2014 we should nominally have had an oil price of close to $60/b

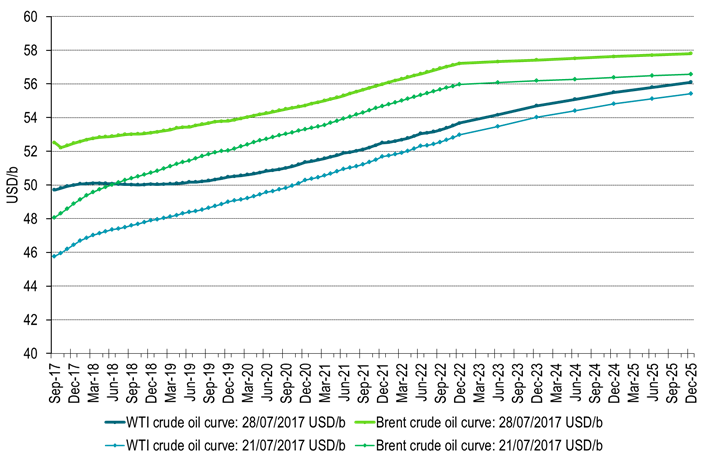
Ch5: Crude oil forward curves flattened substantially last week
As investors and refineries bought the front while producers probably sold into the rally out on the curve

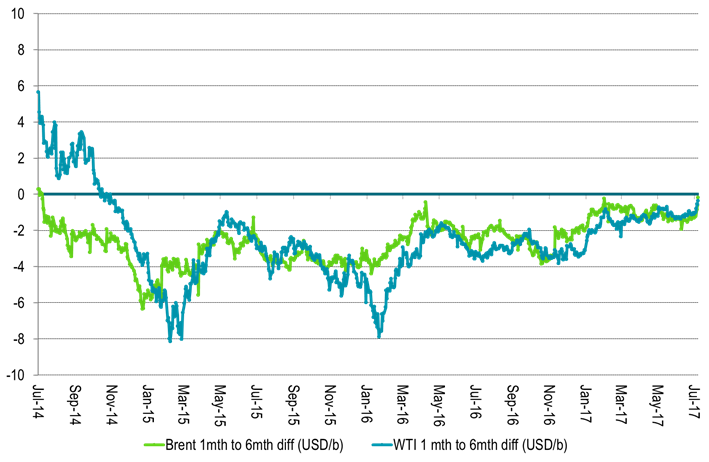
Ch6: The 1 to 6mth crude time spreads got close to zero

Ch7: And crude time spreads of 1mth to 18mth were not far away either
With WTI 1mth closing just $0.34/b below the 18mth on Friday and trading just $0.19/b below today
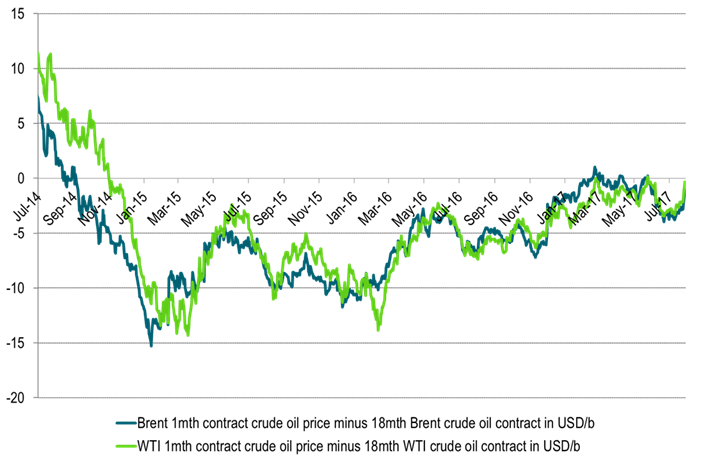

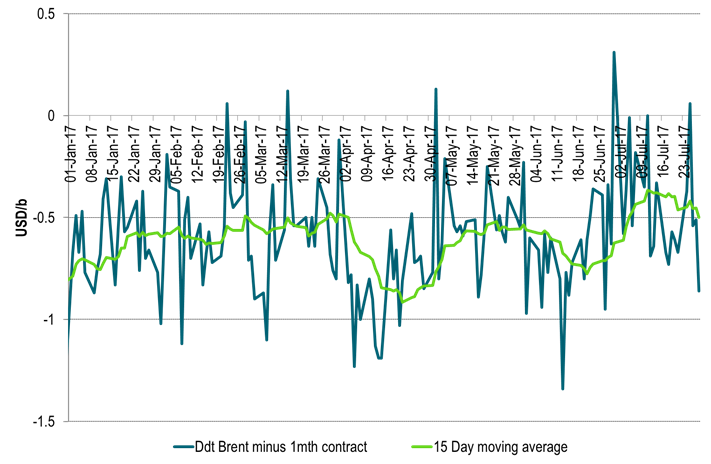
Ch8: A word of caution though. The tightness is not so evident in the Brent crude oil spot market
Dated Brent still trades at a $0.5/b discount to the 1mth contract in a sign that deficit of crude oil is still not quite yet here

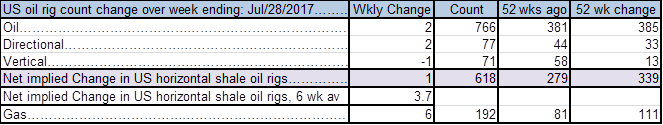
Ch9: US oil players added 2 rigs last week


Ch10: Global refineries are rapidly getting back on line consuming more crude oil
More to come in Asia, ME and LatAm

Ch11: Deteriorating crude production in Venezuela
Production could be hit hard by possible US sanctions

Ch12: Net long managed money probably has room to add more length
Even though length has been added 4 weeks in a row now


Kind regards
Bjarne Schieldrop
Chief analyst, Commodities
SEB Markets
Merchant Banking