

Analys
SEB Jordbruksprodukter, 13 maj 2013


 45 mt högre veteskörd globalt och 6 mt högre lager är USDA:s första prognos för säsongen 2013/14, som kom i fredags klockan 18:00 svensk tid. WASDE-rapporten indikerar att rätt pris för vete, sojabönor och majs är väsentligt lägre än dagens höga priser. Lantbrukare som inte prissäkrat sin skörd av spannmål eller raps borde göra det, åtminstone till en betydande del.
Vete
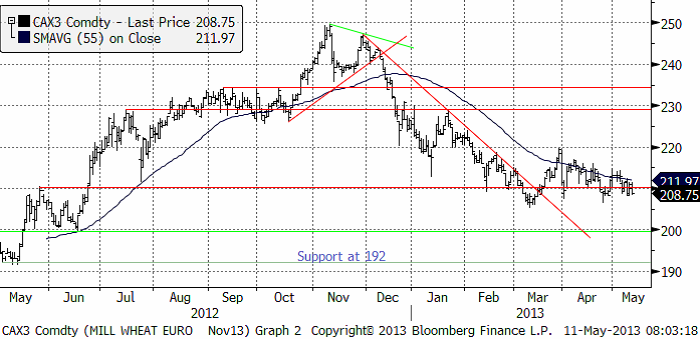
Priset på vete stängde ner på Matif på den halvtimmes handel som var möjlig efter att WASDE-rapporten publicerats i fredags. Det tekniska stödet vid 210 euro lär kunna brytas när handeln drar igång på den nya veckan.
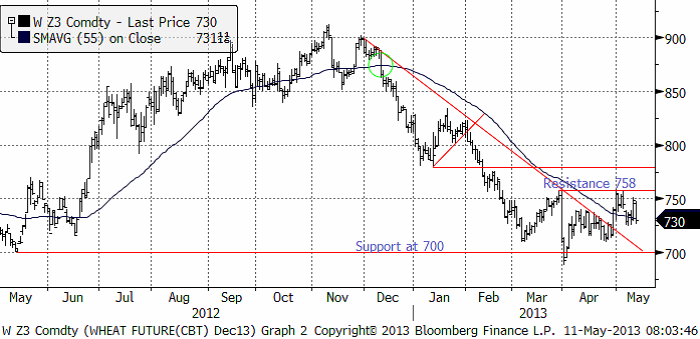
Decemberkontraktet på CBOT steg inför rapporten upp mot motståndet på 758 cent, men föll sedan tillbaka på fredagen efter USDA:s rapport.
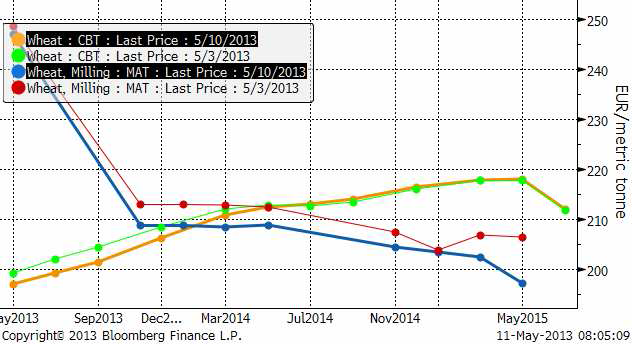
Ser vi på den senaste veckan förändring av terminskurvorna, ser vi att terminspriserna framåt i tiden gått ner ungefär lika mycket oavsett löptid i Europa. I USA, däremot har bara de kortaste terminskurvorna sjunkit. Från och med mars-leverans nästa år ligger priset högre i USA än i Europa. Som vanligt får man alltså bättre betalt om man säljer nästa års skörd via Chicago-terminerna än om man säljer Matif-terminerna.
Nedan ser vi USDA:s estimat för global produktion enligt den senaste rapporten som publicerades i fredags klockan 18 CET.
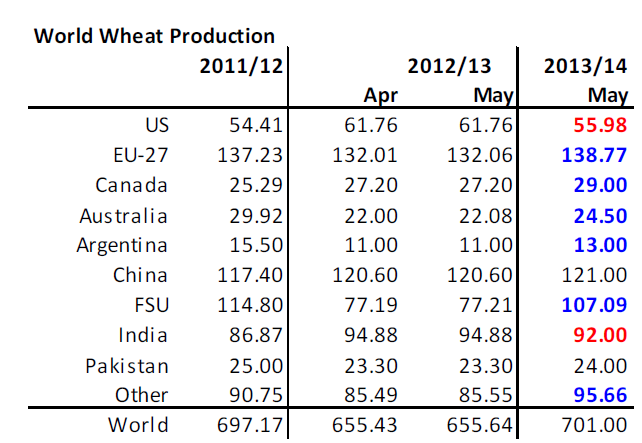
USDA gjorde inga förändringar för 2012/13, men det var första gången de gav ett estimat för 2013/14. Den visar 45 mt högre produktion än förra året och något högre än för två år sedan. Det är lite lägre skörd väntad i USA än förra året, ganska mycket högre i EU (över lokala estimat här). Fd Sovjuetunionen väntas stå för den stora ökningen, med +30 mt. Indien väntas ge lägre skörd än förra året, men mer än för två år sedan.
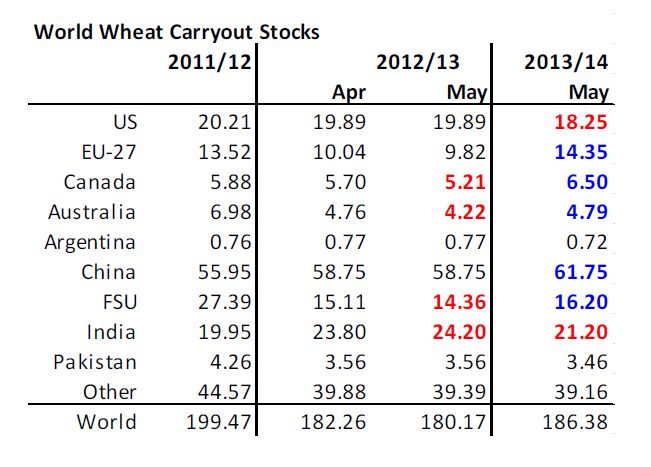
Med den här ökningen av produktionen är det inte konstigt att utgående lager ökar. Men med 45 mt högre produktion, är ökningen av lagren med 6 mt ganska låg. USDA räknar med att foderefterfrågan ökar med 7 mt. För att få en så mycket högre konsumtion av vete i världen totalt sett som USDA räknar med måste priset vara riktigt lågt. Jag tror att de har estimerat utgående lager för lågt, eller varit för optimistiska om den stora ökningen av skörden i fd Sovjetunionen och kanske i USA. Men hur som helst är detta en rapport som indikerar väsentligt lägre pris på vete framöver.
Nedan ser vi priset på decemberkontraktet på CBOT i cent, i förhållande till estimat för utgående lager.
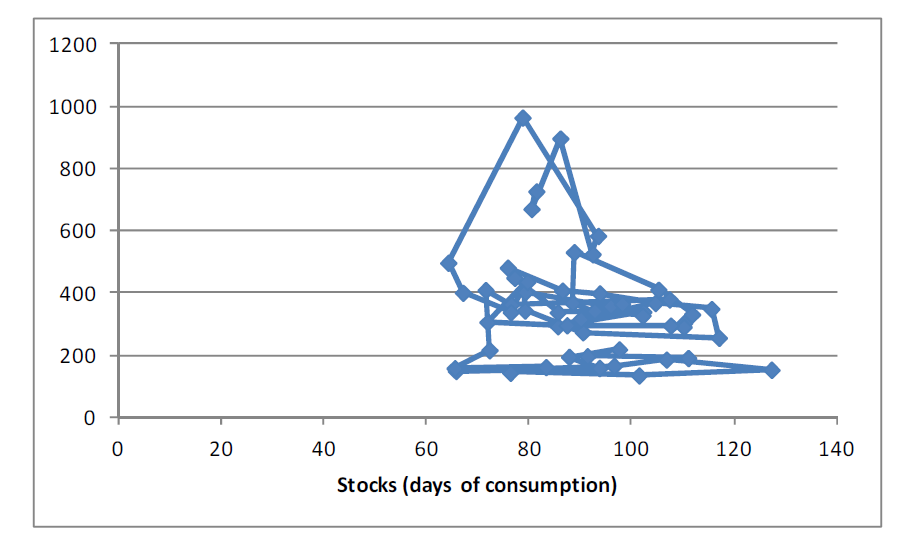
Slutsatsen är att vi behåller vår säljrekommendation på vete.
Maltkorn
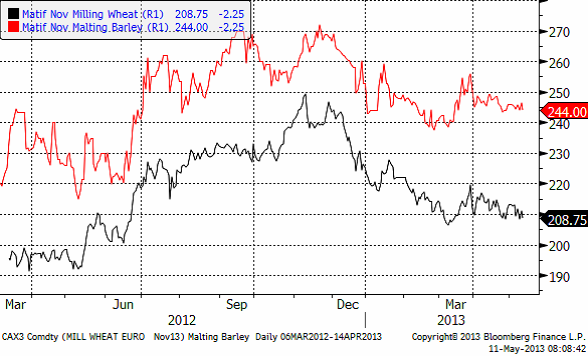
Priset på maltkorn med leverans i november har ännu en vecka fortsatt att visa mer styrka än höstvetet / kvarnvetet på Matif.
Majs
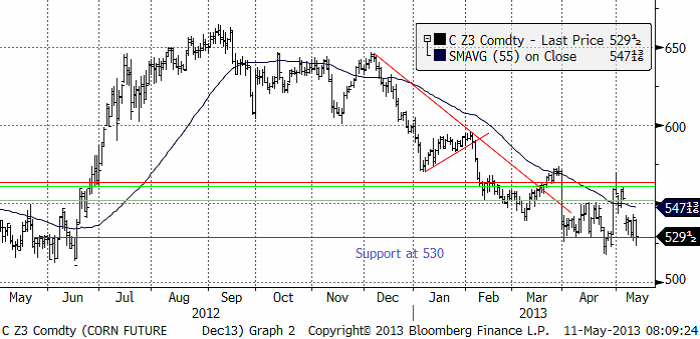
Majspriset (december 2013) som testade en trendvändning uppåt för en vecka sedan föll tillbaka när det i måndags kväll stod klart att sådden trots allt tagit ett större kliv framåt än befarat. När WASDE-rapporten så kom i fredags föll priset ytterligare. Det finns ett starkt tekniskt stöd vid 530 cent och vid den här nivån har vi också bottennoteringarna från förra året, innan torkan och prisuppgången i juli. Det är psykologiskt viktig nivå. Men icke desto mindre – om WASDE-rapporten blir verklighet borde priset ligga på en ännu lägre nivå. Kanske till och med på 400 cent per bushel.
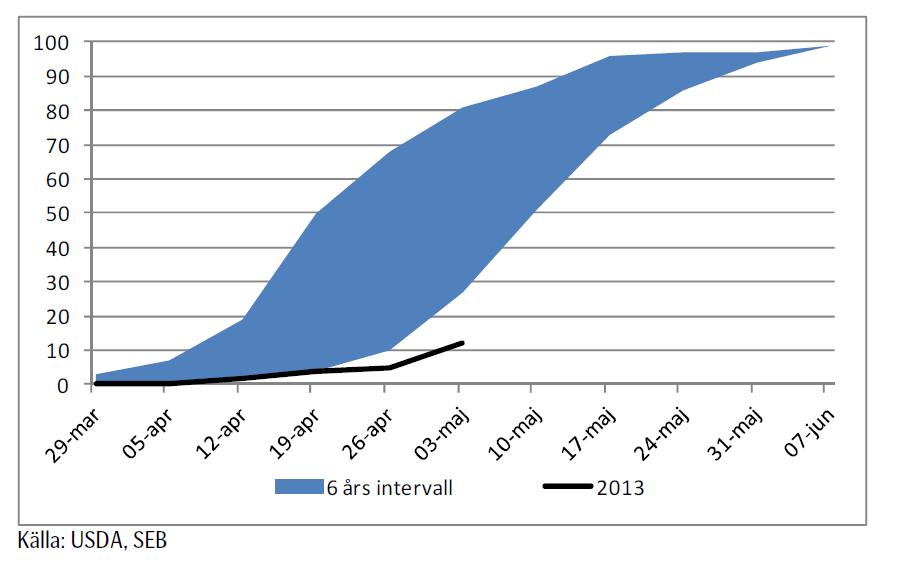
Sådden ligger kraftigt efter i USA. Nedan ser vi såddens framåtskridande i USA. 6-årsintervallet sträcker sig från 2007 till 2012. Förra helgen var 12% sått.
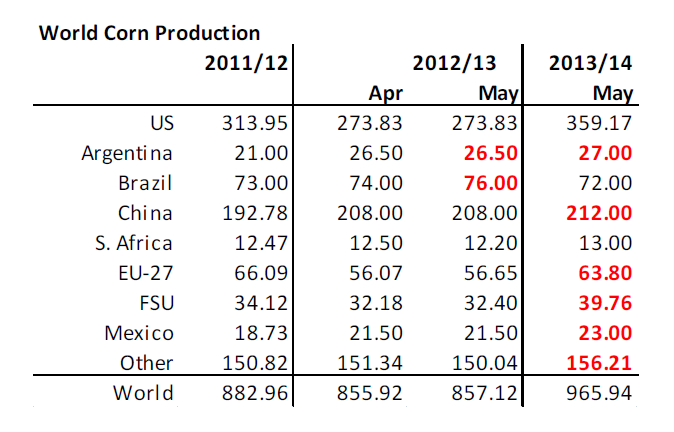
Nedan ser vi USDA:s estimat, som publicerades i fredags för majsproduktionen. För 2012/13 noterar vi de inte justerade ner Argentinas skörd, men höjde Brasiliens skörd med 2 mt. Det är också första gången som USDA rapporterar något för 2013/14. Som vi ser är det en rejäl höjning av global produktion, från 857 mt 2012/13 till 965 mt med start i höst. Vi ser att USDA väntar sig en rekordskörd i USA, 80 mt högre än förra året och större skördar både i EU och i fd Sovjetunionen.
Nedan ser vi USDA:s estimat för utgående lager.
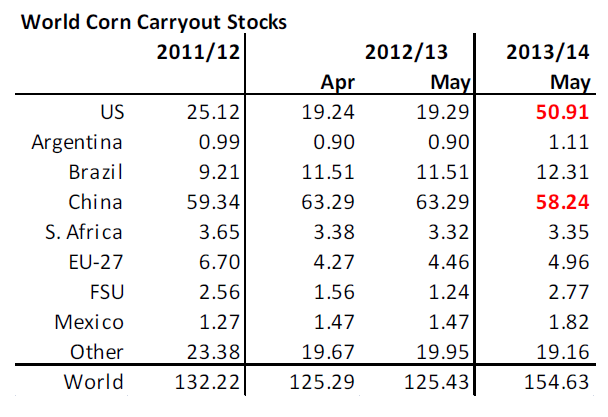
Som vi ser är det väsentligt högre lager den sista augusti nästa år i USA, som USDA förväntar sig. Trots detta väntar sig USDA att foderefterfrågan på global basis stiger med 44 mt. Lägg därtill 7 mt ökad foderkonsumtion av vete. Det är knappast rimligt att vänta sig detta, om inte priset är väsentligt mycket lägre och gör att köttefterfrågan ökar radikalt. De hot som finns är att vädret i USA drar ner skörden i USA från vad USDA väntar sig nu. Det skulle få priset att bli högre. Å andra sidan är det inte sannolikt att foderefterfrågan blir så stor som USDA nu räknar med och då ökar utgående lager, med lägre pris som följd. Utgående lager förutspås bli så stora att det är svårt att se att priset ska kunna gå upp nu. Nedanför ser vi priset i cent per bushel på decemberkontraktet på CBOT i förhållande till utgående lager.
Som vi ser kan priset mycket väl gå ner till 400 cent utan att vara ur led med tidigare års förhållande mellan lager och pris. Slutsatsen är att vi behåller vår säljrekommendation på majs.
Sojabönor
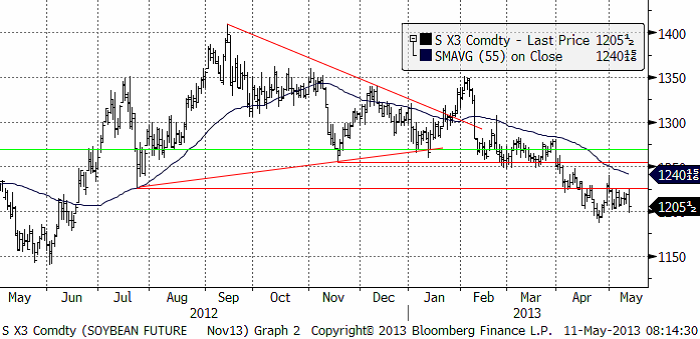
Jag har vecka efter vecka hävdat att sojabönorna (november 2013) befinner sig i en stabil negativ trend. Efter WASDE-rapporten i fredags bröts ett litet tekniskt stöd, vilket kortsiktigt kan leda till att marknaden tar ett trappsteg ner i prisnivå igen i veckan som kommer. WASDE-rapporten i fredags indikerar, om den slår in, ett pris som är ca 200 cent / bushel lägre än idag.
Nedanför ser vi USDA:s estimat för sojaproduktionen i världen.
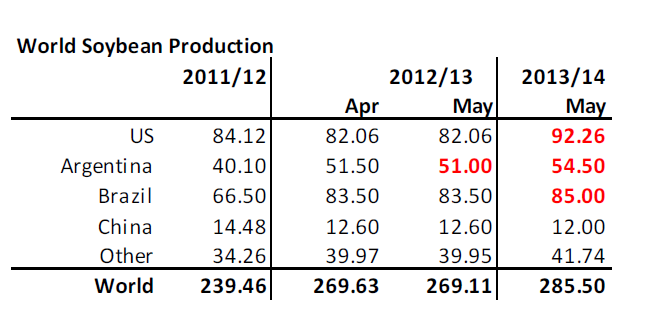
USDA sänkte Argentinas skörd 2012/13 med 0.5 mt. För första gången gav USDA också estimat för 2013/14. Vi ser att USDA väntar sig högre produktion i alla regioner / länder utom i Kina. Global produktion tar ett kliv upp med drygt 15 mt till 285.5 mt.
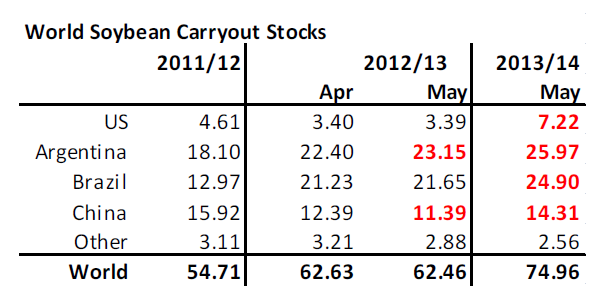
Den här ökningen av produktionen leder till en ökning av utgående lager 2013/14 med nästan 13 mt. USDA väntar sig också att Kinas import ökar till 69 mt. Jag tror det är en lite för stor ökning, med tanke på de animali-mat-problem som landet har. Man misstror inhemskt kött, inhemsk mjölk och kyckling konsumeras i vissa områden inte alls pga den pågående fågelinfluensan.
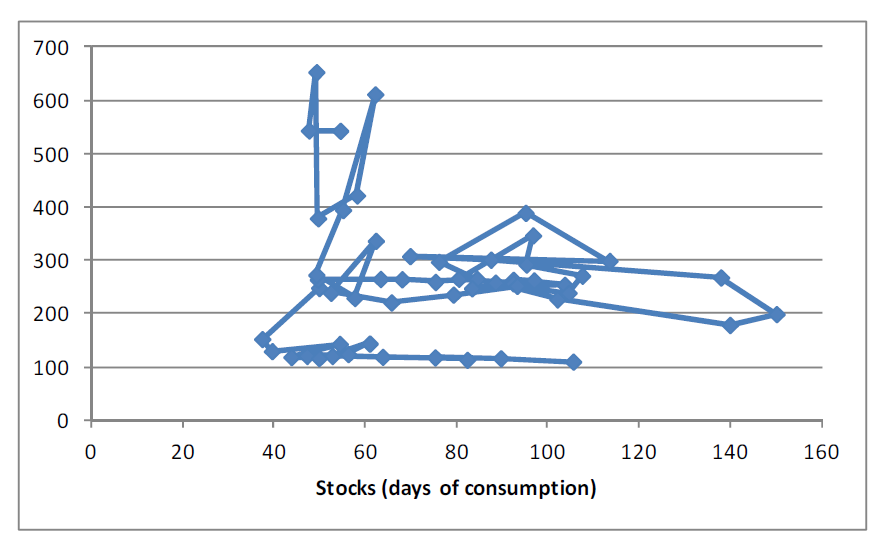
Än så länge kan mycket hända med produktionen, eftersom så stor del odlas i Brasilien, där det sås först i höst. Till dess kan vädret ha slagit om till negativt (eller ännu mer positivt). Men allt annat lika just nu, ser det ut som om den ”bear market” som har börjat, kommer att fortsätta. Nedanför ser vi priset i cent per bushel på decemberkontraktet på CBOT i förhållande till utgående lager.
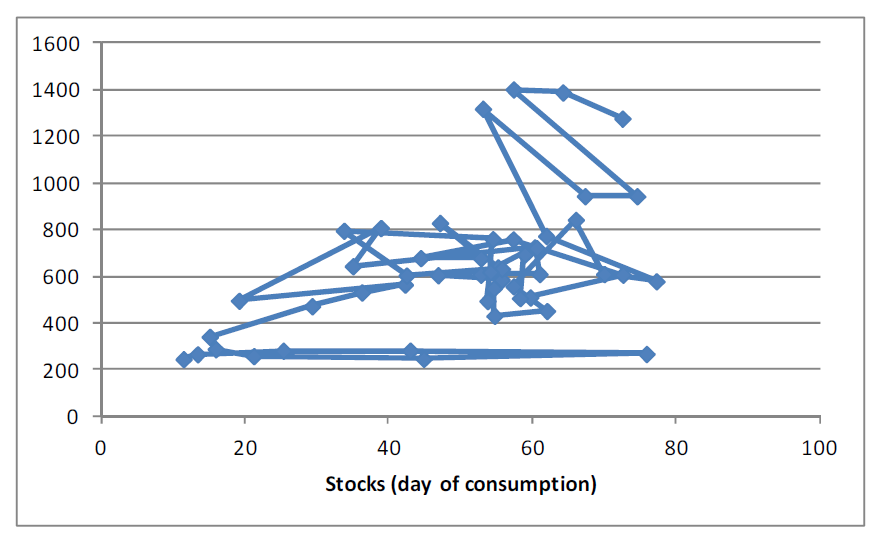
Som vi ser är lite drygt 1000 cent per bushel ett rimligt pris vid den här lagernivån. Slutsatsen är att vi behåller och upprepar vår säljrekommendation på sojabönor.
Raps
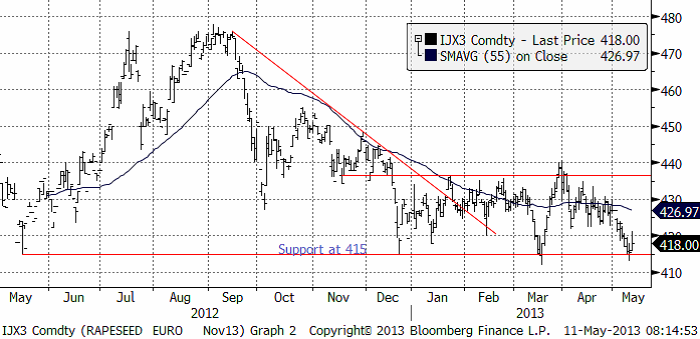
Rapspriset föll på Matif i veckan, men studsade på det tekniska stödet på 415 euro per ton. Med tanke på WASDE-rapportens ordentligt negativa siffror, tror jag ett nytt test av stödet kommer i veckan.
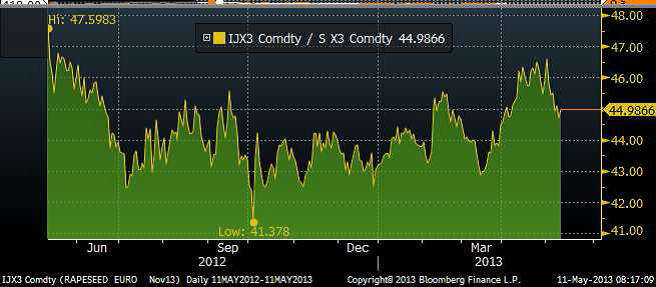
Nedanför ser vi kvoten mellan rapsterminspriset (nov) mot sojabönspriset (nov). Vi ser att raps fram till maj månads början handlades allt dyrare i förhållande till sojabönor, men att detta, som vi påpekat börjat normaliseras genom ett större prisfall på raps än på sojabönor. Ännu finns det extra fallhöjd i rapspriset, eftersom rapsen fortfarande är dyr i ett historiskt perspektiv, i förhållande till sojabönor.
Skulle det tekniska stödet på 415 euro brytas, är detta en rejäl säljsignal. Jag tror att rapspriset kommer att falla. Dels för att sojabönorna bör ha en lång tid av fallande priser framför sig och dels för att rapsen är ovanligt dyr i förhållande till sojabönor.
Mjölk
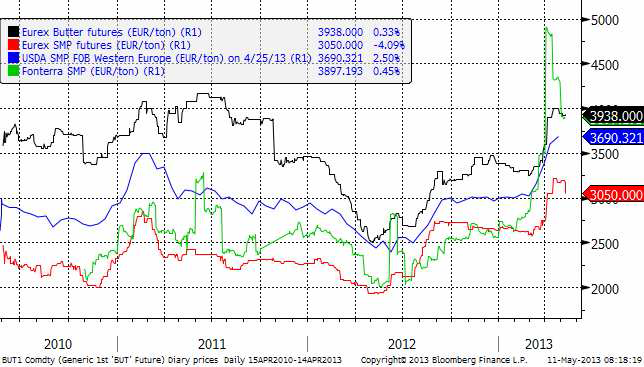
Fonterras notering har nu vänt ner ganska kraftigt och terminsmarknaden på SMP och mör på Eurex har också handlats lägre. Jag tror att vi sett slutet på prisuppgången. Priserna på Eurex ligger ännu kvar på en hög nivå. Den som är snabb kan hinna med att säkra produktion på attraktiva nivåer innan priserna hinner falla tillbaka igen.
[box]SEB Veckobrev Jordbruksprodukter är producerat av SEB Merchant Banking och publiceras i samarbete och med tillstånd på Råvarumarknaden.se[/box]
Disclaimer
The information in this document has been compiled by SEB Merchant Banking, a division within Skandinaviska Enskilda Banken AB (publ) (“SEB”).
Opinions contained in this report represent the bank’s present opinion only and are subject to change without notice. All information contained in this report has been compiled in good faith from sources believed to be reliable. However, no representation or warranty, expressed or implied, is made with respect to the completeness or accuracy of its contents and the information is not to be relied upon as authoritative. Anyone considering taking actions based upon the content of this document is urged to base his or her investment decisions upon such investigations as he or she deems necessary. This document is being provided as information only, and no specific actions are being solicited as a result of it; to the extent permitted by law, no liability whatsoever is accepted for any direct or consequential loss arising from use of this document or its contents.
About SEB
SEB is a public company incorporated in Stockholm, Sweden, with limited liability. It is a participant at major Nordic and other European Regulated Markets and Multilateral Trading Facilities (as well as some non-European equivalent markets) for trading in financial instruments, such as markets operated by NASDAQ OMX, NYSE Euronext, London Stock Exchange, Deutsche Börse, Swiss Exchanges, Turquoise and Chi-X. SEB is authorized and regulated by Finansinspektionen in Sweden; it is authorized and subject to limited regulation by the Financial Services Authority for the conduct of designated investment business in the UK, and is subject to the provisions of relevant regulators in all other jurisdictions where SEB conducts operations. SEB Merchant Banking. All rights reserved.

Brent is climbing higher. Front-month is at USD 106.3/bl this morning, close to a weekly high and a USD 9/bl jump from Mondays open. This is the move we flagged as a risk earlier in the week: the market shifting from ”a deal is around the corner” to ”this is going to take longer than we thought”.

Analyst Commodities, SEB
During April, rest-of-year Brent remained remarkably stable around USD 90/bl. A stability which rested on one single assumption: the SoH reopens around 1 May. That assumption is now slowly falling apart.
As we highlighted yesterday: every week of delay beyond 1 May adds (theoretically) ish USD 5/bl to the rest-of-year average, as global inventories draw 100 million barrels per week. i.e., a mid-May reopening implies rest-of-year Brent closer to USD 100/bl, and anything pushing into June or July takes us meaningfully higher.
What’s changed in the last 48 hours:
#1: The US military has formally warned that clearing suspected sea mines from SoH could take up to six months. That is a completely different timescale from what the financial market is pricing. Even a political deal tomorrow does not immediately reopen the strait.
#2: Trump has shifted his tone from urgency to ”strategic patience”. In yesterday’s press conference: ”Don’t rush me… I want a great deal.” The market is reading this as a president no longer feeling pressured by timelines, with the naval blockade running in the background.
#3: So far, the military activity is escalating, not de-escalating. Axios reports Iran is laying more mines in SoH. The US 3rd carrier strike group (USS George H.W. Bush) is arriving with two countermine vessels. Trump yesterday ordered the US Navy to destroy any Iranian boats caught laying mines. While CNN reports that the Pentagon is actively drawing up plans to strike Iranian SoH capabilities and individual Iranian military leaders if the ceasefire collapses. i.e., NOT a attitude consistent with an imminent deal!
Spot crude and product prices eased off the early-April highs on a combination of system rerouting and deal optimism. Both now weakening. Goldman estimates April Gulf output is reduced by 14.5 mbl/d, or 57% of pre-war supply, a number that keeps getting worse the longer this drags on.
Demand-side adaptation is ongoing: S. Korea has cut its Middle East crude dependence from 69% to 56% by pulling more from the Americas and Africa, and Japan is kicking off a second round of SPR releases from 1 May. But SPRs are finite.
Ref. to the negotiations, we should not bet on speed. The current Iranian leadership is dominated by genuine hardliners willing to absorb economic pain and run the clock to extract concessions. That is not a setup for a rapid resolution. US/Israeli media briefings keep framing the delay as ”internal Iranian divisions”, the reality is more complicated and points toward weeks and months, not days.
Our point is that the complexity is large, and higher prices have only just started (given a scenario where the negotiations drag out in time). The market spent April leaning on the USD 90/bl rest-of-year assumption; that case is diminishing by the hour. If ”early May reopening” is replaced by ”June, July or later” over the next week or two, both crude and products have meaningful room to reprice higher from here. There is a high risk being short energy and betting on any immediate political resolution(!).
Down on Friday. Up on Monday. The Brent June crude oil contract traded down 5.1% last week to a close of $90.38/b. It reached a high of $103.87/b last Monday and a low of $86.09/b on Friday as Iran announced that the Strait of Hormuz was fully open for transit. That quickly changed over the weekend as the US upheld its blockade of Iranian oil exports while Iran naturally responded by closing the SoH again. The US blew a hole in the engine room of the Iranian ship TOUSKA and took custody of the ship on Sunday. Brent crude is up 5.6% this morning to $95.4/b.

The cease-fire is expiring tomorrow. The US has said it will send a delegation for a second round of negotiations in Islamabad in Pakistan. But Iran has for now rejected a second round of talks as it views US demands as unrealistic and excessive while the US is also blocking the Strait of Hormuz.
While Brent is up 5% this morning, the financial market is still very optimistic that progress will be made. That talks will continue and that the SoH will fully open by the start of May which is consistent with a rest-of-year average Brent crude oil price of around $90/b with the market now trading that balance at around $88/b.
Financial optimism vs. physical deterioration. We have a divergence where the financial market is trading negotiations, improvements and resolution while at the same time the physical market is deteriorating day by day. Physical oil flows remain constrained by disrupted flows, longer voyage times and elevated freight and insurance costs.
Financial markets are betting that a US/Iranian resolution will save us in time from violent shortages down the road. But every day that the SoH remains closed is bringing us closer to a potentially very painful point of shortages and much higher prices.
The US blockade is also a weapon of leverage against its European and Asian allies. When Iran closed the SoH it held the world economy as a hostage against the US. The US blockade of the SoH is of course blocking Iranian oil exports. But it is also an action of disruption directed towards Europe and Asia. The US has called for the rest of the world to engaged in the war with Iran: ”If you want oil from the Persian Gulf, then go and get it”. A risk is that the US plays brinkmanship with the global oil market directed towards its European and Asian allies and maybe even towards China to force them to engage and take part. Maybe unthinkable. But unthinkable has become the norm with Trump in the White House.
Wild moves yesterday. Brent crude traded to a high of $114.43/b and a low of $96.0/b and closed at $99.94/b yesterday.
US – Iran negotiations ongoing or not? What a day. Donald Trump announced that good talks were ongoing between Iran and the US and that the 48 hour deadline before bombing Iranian power plants and energy infrastructure was postponed by five days subject to success of ongoing meetings. Iranian media meanwhile stated that no meetings were ongoing at all.
Today we are scratching our heads trying to figure out what yesterday was all about.
Friends and family playing the market? Was it just Trump and his friends and family who were playing with oil and equity markets with $580m and $1.46bn in bets being placed by someone in oil and equity markets just 15 minutes before Trump’s announcement?
Was Trump pulling a TACO as he reached his political and economic pain point: Brent at $112/b, US Gas at $4/gal, SPX below 200dma and US 10yr above 4.4%?
Different Iranian factions with Trump talking with one of them? Are there real negotiations going on but with the US talking to one faction in Iran while another, the hardliners, are not involved and are denying any such negotiations going on?
Extending the ultimatum to attack and invade Kharg island next weekend? Or, is the five day delay of the deadline a tactical decision to allow US amphibious assault ships and marines to arrive in the Gulf in the upcoming weekend while US and Israeli continues to degrade Iranian military targets till then. And then next weekend a move by the US/Israel to attack and conquer for example the Kharg island?
We do not really know which it is or maybe a combination of these.
We did get some kind of TACO ydy. But markets have been waiting for some kind of TACO to happen and yesterday we got some kind of TACO. And Brent crude is now trading at $101.5/b as a result rather than at $112-114/b as it did no the high yesterday.
But what really matters in our view is the political situation on the ground in Iran. Will hardliners continue to hold power or will a more pragmatic faction gain power?
If the hardliners remain in power then oil pain should extend all the way to US midterm elections. The hardliners were apparently still in charge as of last week. Iran immediately retaliated and damaged LNG infrastructure in Qatar after Israel hit Iranian South Pars. The SoH was still closed and all messages coming out of Iran indicated defiance. Hardliners continues in power has a huge consequence for oil prices going forward. The regime has played its ’oil-weapon’ (closing or chocking the Strait of Hormuz). It is using it to achieve political goals. Deterrence: it needs to be so politically and economically expensive to attack Iran that it won’t happen again in the future. Or at least that the US/Israel thinks 10-times over before they attack again. The highest Brent crude oil closing price since the start of the war is $112.19/b last Friday. In comparison the 20-year inflation adjusted Brent price is $103/b. So Brent crude last Friday at $112.19/b isn’t a shockingly high price. And it is still far below the nominal high of $148/b from 2008 which is $220/b if inflation adjusted. So once in a lifetime Iran activates its most powerful weapon. The oil weapon. It needs to show the power of this weapon and it needs to reap political gains. Getting Brent to $112/b and intraday high of $119.5/b (9 March) isn’t a display of the power of that weapon. And it is not a deterrence against future attacks.
So if the hardliners remain in power in Iran, then the SoH will likely remain chocked all the way to US midterm elections and Brent crude will at a minimum go above the historical nominal high of $148/b from 2008.
Thus the outlook for the oil price for the rest of the year doesn’t depend all that much of whether Trump pulls a TACO or not. Stops bombing or not. It depends more on who is in charge in Iran. If it is the hardliners, then deterrence against future attacks via chocking of the SoH and high oil prices is the likely line of action. It is impacting the world but the Iranian ’oil-weapon’ is directed towards the US president and the the US midterm elections.
If a pragmatic faction gets to power in Iran, then a very prosperous future is possible. However, if power is shifting towards a more pragmatic faction in Iran then a completely different direction could evolve. Such a faction could possibly be open for cooperation with the US and the GCC and possibly put its issues versus Israel aside. Then the prosperity we have seen evolving in Dubai could be a possible future also for Iran.
So far it looks like the hardliners are fully in charge. As far as we can see, the hardliners are still fully in control in Iran. That points towards continued chocking of the SoH and oil prices ticking higher as global inventories (the oil market buffers) are drawn lower. And not just for a few more weeks, but possibly all the way to the US midterm elections.


Solkraften pressar elpriserna dagtid

Michel Gubel ger sin syn på oljemarknaden

Svag vårflod dubblar elpriserna
Brent crude up USD 9/bl on the week… ”deal around the corner” narrative fades
Market Still Betting on Timely Resolution, But Each Day Raises Shortage Risk

Det fysiska spotpriset på brentolja har slagit nytt rekord

Marknaden måste börja betrakta de höga kopparpriserna som det nya normala

Christian Kopfer om läget för oljan
Market Still Betting on Timely Resolution, But Each Day Raises Shortage Risk
Brent crude up USD 9/bl on the week… ”deal around the corner” narrative fades
-
 Nyheter4 veckor sedan
Det fysiska spotpriset på brentolja har slagit nytt rekord
-
 Nyheter4 veckor sedan
Marknaden måste börja betrakta de höga kopparpriserna som det nya normala
-
 Nyheter3 veckor sedan
Christian Kopfer om läget för oljan
-
Analys2 veckor sedan
Market Still Betting on Timely Resolution, But Each Day Raises Shortage Risk
-
Analys1 vecka sedan
Brent crude up USD 9/bl on the week… ”deal around the corner” narrative fades
-
 Nyheter5 dagar sedan
Michel Gubel ger sin syn på oljemarknaden
-
Nyheter5 dagar sedan
Svag vårflod dubblar elpriserna
-
 Nyheter3 dagar sedan
Solkraften pressar elpriserna dagtid