Analys
SEB – Råvarukommentarer, 21 september 2012
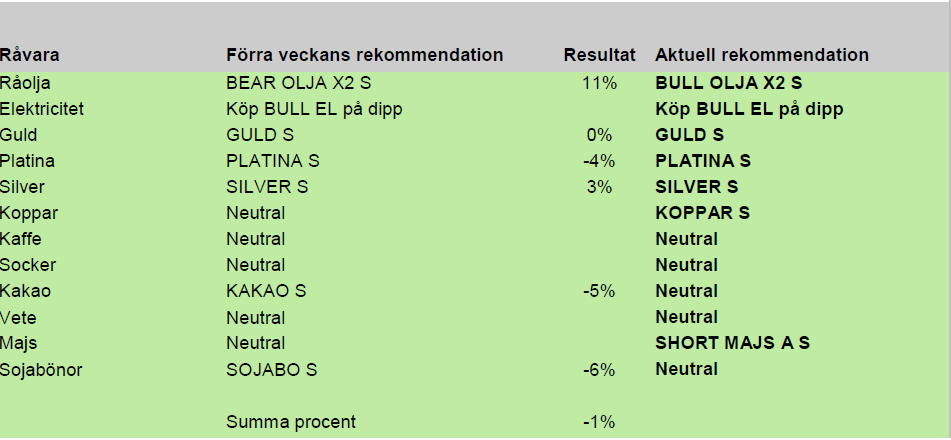
Sammanfattning av rekommendationer
Summan av resultatet blev en liten förlust i veckan på -1%. Vi börjar bli något mer positiva till el jämfört med förra veckan. Efter rekylen i oljepriset är vi positiva till den också. Jordbruksprodukterna har successivt glidit över från köp- till neutral och nu sälj på majs. Möjligtvis kan det komma en rekyl upp på majs, vilket då blir ett säljtillfälle. För ädelmetaller är vi positiva. De gynnas på ett uppenbart sätt av monetär stimulans (“utan begränsning”) i USA, i Europa och i Japan.
Råolja – Brent
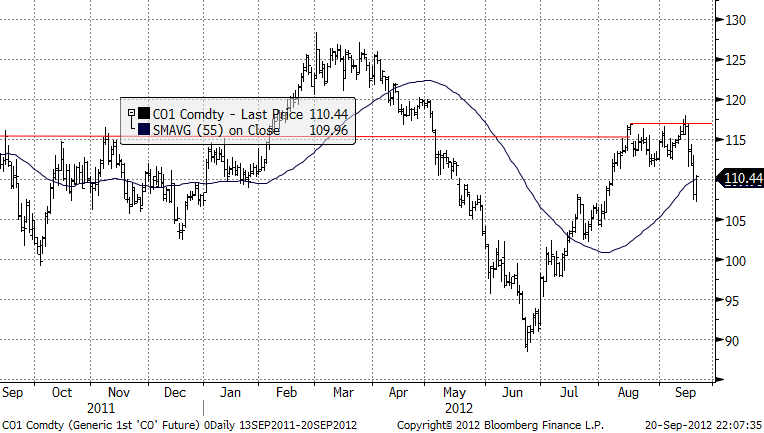
Brentkontraktet har, under en månads tid, fram till i måndags, handlats mellan 112 och 117 usd. Trots massiva stimulanser från FED och framgångarna i det europeiska arbetet mot en bankunion, har inte oljemarknaden lyckats bryta ur intervallet. Stundtals sökte sig priset ovan 117 men trycktes genast ned igen.
Vi har under en tid ansett att råoljan varit för högt prissatt. Det som mest drivit priset högre är utbudsstörningar i Nordsjön, stormen Isaac samt geopolitisk oro i Mellanöstern med sanktionerna mot Iran som största bidragare. Nu senast har ny oro tillkommit med de starka reaktionerna på Mohammed filmen. Samtidigt har Saudiarabien och bland annat Irak, producerat olja som mer än väl kompenserat bortfallet från Iran.
I förra veckan var all fokus på Federal Reserve, som också levererade, i linje med- eller mer än vad marknaden förväntat sig. Många tillgångsslag, inte minst metaller gick mycket starkt, både inför och efter FED beskedet. Oljan däremot var mer återhållen. Visserligen handlade man i en den övre delen av intervallet.
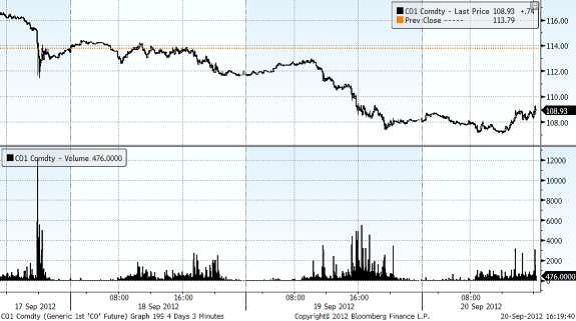
Därefter har dramatiken varit mycket stor. Det började med att amerikansk WTI olja på bara några minuter föll handlöst med 3-4 usd under extremt hög omsättning, se graf nedan. Teorierna kring vad som skedde är många, bland annat anges robothandel, ”fat fingers” och optionslösen som möjliga utlösande faktorer. Nymex ska ha inlett en undersökning. När den värsta röken lagt sig, så verkar det ändå som att även uttalanden och åtgärder från Saudiarabien, vilken länge agerat och argumenterat för lägre pris bidragit samt att marknaden, länge, faktiskt, negligerat negativ information. Kinesisk statistik visar bland annat på en svag utveckling i världens fabrik. I onsdags tilltog fallet då amerikansk oljelagerstatistik visade en mycket stor uppgång, +8.5 miljoner fat (mot förväntade +1.0) för råolja. Brent föll ned mot 107 men har sedan dess återhämtats och noteras senast på 109 usd.
I nuläget förhåller vi oss neutral men ser nivåer kring 105 USD som en mycket attraktiv nivå för en lång position.
Elektricitet
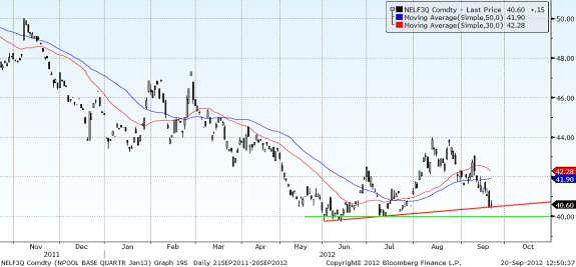
Elmarknaden har fortsatt nedåt och vi börjar närma oss nivåer för att börja bygga längd. Q1-13 terminen är senast omsatt på 40.70 EUR/MWh (tidigare kommunicerad target-nivå 40.00). Nedsidan börjar bli begränsad och vi står beredda på att köpa.
Väderprognoserna indikerar nu kallare och torrare väder och marginalkostnaden för koleldad elproduktion (MC kol), se graf nedan, vilken är en mycket viktig prisinput för de längre terminerna, har planat ut.
Just väderskifte och uppgång i MC kol är två viktiga ”triggers” för en prisuppgång. Q1-13 terminen på börsen har ännu inte stigit eller ens planat ut. Oftast brukar marknaden vara mycket snabb att ta till sig förändringar som dessa men än så länge är reaktionen väldigt försiktig. Vi räknar ändå med att uppsidan kan komma att bli explosiv, om än kanske kortvarig, varför en eventuell vinst bör tas hem relativt snabbt. En återgång till våtare/varmare väder kommer resultera i snabb korrektion ned igen. Brott av 40.00 nivån kan också öppna upp för större prisfall.
Vi håller fortsatt en neutral rekommendation men gör oss beredda att köpa.
Guld och Silver
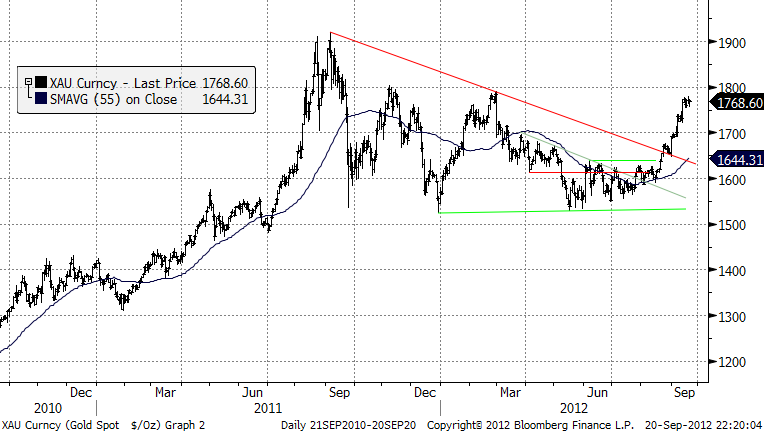
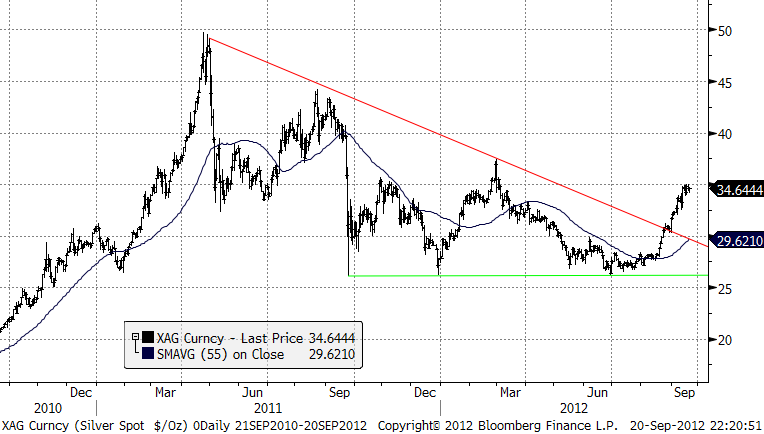
Efter den initiala reaktionen efter FED har guld och silver inte orkat klättra vidare. Många aktörer som köpt på förväntningar om ytterligare stimulanser har legat beredda att ta hem vinster. Det gamla ordspråket ”buy the rumour and sell the fact” verkar gälla den har veckan. Undertonen är ändå stark och rekylerna endast marginella. Vi bedömer att priserna har fortsatt mer att ge med nivån $1800 inom räckhåll för guld (spot i London handlas kring $1862 i skrivandes stund). En tänkbar strategi (för den som inte redan köpt) är att bevaka den tidigare högsta nivån $1780 och agera på ett genombrott. Scenariot är likartat för silver med rekommenderad bevakning av förra veckans toppnivå på $35/oz ($34,50 i skrivandes stund).
Nedan ser vi kursdiagrammet för guld i dollar per troy ounce.
Nedan ser vi kursdiagrammet för silver i dollar per troy ounce.
Platina
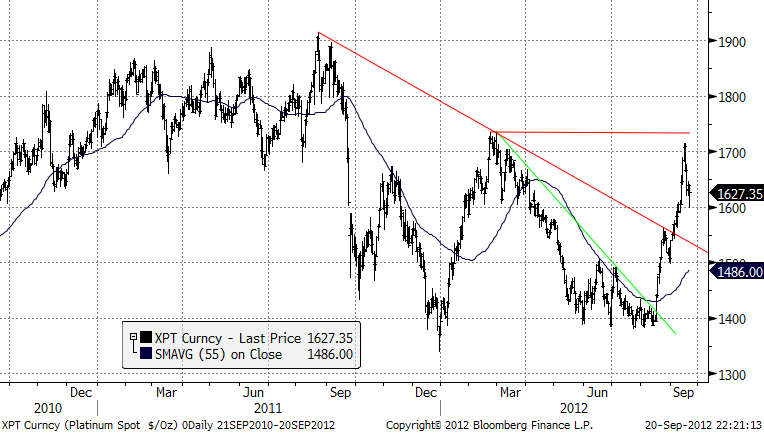
Nyheten att Strejken vid Lonmins gruva i Sydafrika avblåstes i början av veckan ledde till en massiv våg av vinsthemtagningar i platina. Priset har rekylerat ner ca 6 % sen toppen i förra veckan – detta efter en oavbruten uppgång sen mitten av augusti med mer än 20 % över perioden. Vi bedömer dagens nivå, strax över $1600, som klart köpvärd. Oroligheterna i Sydafrika, som står för 75 % av världsutbudet, är inte över, och strejkhoten hänger över fler gruvor efter Lonmins uppgörelse. Gruvorna har redan lönsamhetsproblem (går med förlust) och risken för fortsatt minskat utbud i landet är stor. Vi ser den här rekylen som ett köptillfälle.
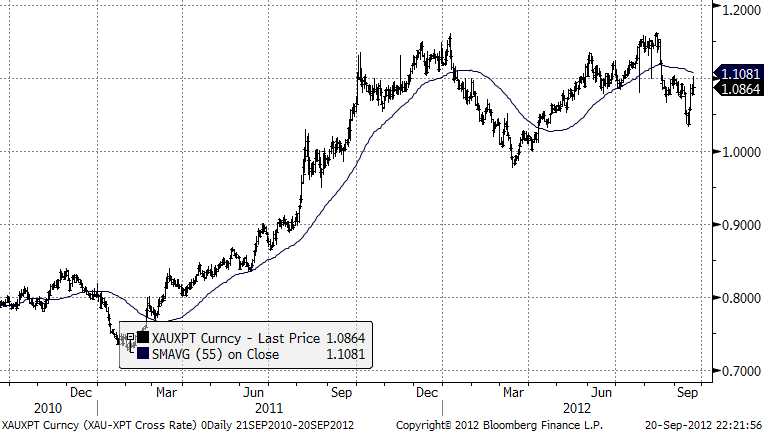
Nedan ser vi priset på guld dividerat med priset på platina. Vi ser att guld har utvecklats sämre än platina sedan mitten av augusti. Tekniskt ser den här trenden stark ut och har potential att gå från 1.05 till 1, dvs en outperformance på ytterligare 5% till platinas fördel. Det mesta av rörelsen från 1.15 är dock avklarad och platina har inte lång tid kvar att vara vår favorit bland ädelmetallerna.
Koppar
Effekten av FED:s penningpolitiska stimulanspaket slog igenom fullt ut förra fredagen med kraftiga prisuppgångar för både bas- och ädelmetaller. Veckan stängde på toppnivåer över hela linjen.
Efter en helg med eftertänksamhet och i viss mån ett uppvaknande med en industriell aktivitet globalt, som faktiskt är under avmattning, var stämningsläget mer avvaktande under denna vecka. Bank of Japan följde upp med ett paket natten mellan tisdag och onsdag, vilket ingav visst mod igen. Oljemarknaden har förbryllat många aktörer och går mot strömmen. Måndagskvällens något oförklarliga ras (oljan föll 4 % inom loppet av ett par minuter), följdes upp av ett kraftigt prisfall på onsdagskvällen, bl.a. efter större lagerökningar i USA än väntat. Oljefallet spred sig till metallerna som dessutom tappade mark efter en svag inköpschefsindex från Kina.
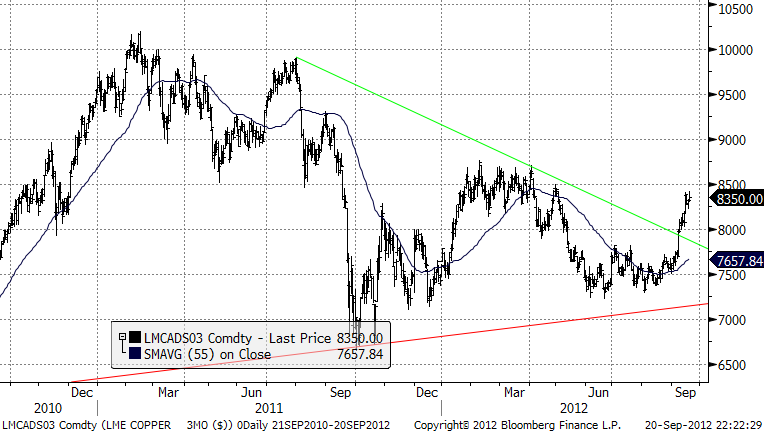
Priserna har nu överlag kommit tillbaka 1-4 % efter uppgångar i storleksordningen 10 % de senaste två veckorna. Undertonen är fortsatt stark med stöd av stimulanser. Nu måste den verkliga fysiska efterfrågan också komma ifatt. Än så länge är det lite tveksamt och marknaden kommer stå och väga för och emot de närmsta dagarna. Koppar är faktiskt upp sedan förra brevet och handlas idag torsdag till $8278 ($3,75(Lbs).
Toppnoteringen förra fredagen noterades till $8422. Marknaden har således endast fallit marginellt. Vi bedömer att finansiella aktörer som tidigare spekulerat i nedgång, nu har återköpt positioner. Tekniska fonder har börjat gå långa.
Industrin är än så länge avvaktande och brottas med en prisuppgång som inte riktigt speglar den
fundamentala situationen, och i många fall överstiger lagda budgetnivåer. Frågan är när (och om) industrin tvingas ”bita i det sura äpplet” och täcka in framtida behov. Centralbankerna visar att de menar allvar och stimulanserna fortsätter. Aktörerna väntar på mer från Kina. Mycket talar för en fortsatt stark trend i nästa vecka med test av nivåer upp mot $8500.
Vi väljer att på kort sikt rekommendera en lång position i koppar.
Kaffe
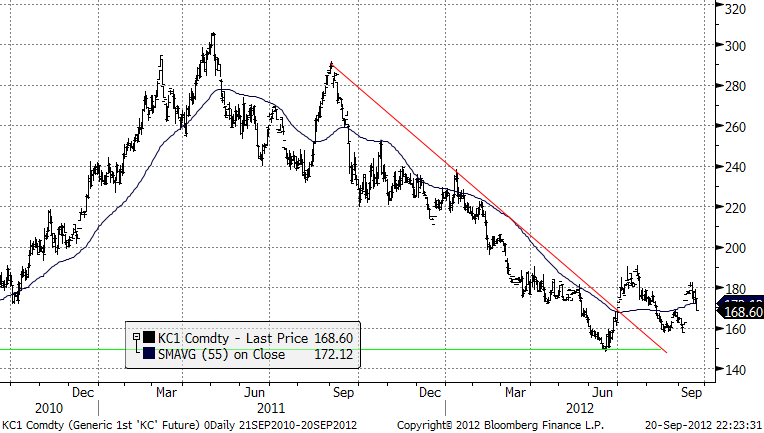
Kaffepriset har fortsatt att falla vilket till största del beror på att världens största kaffeproducent Brasilien har valt att gradvis sälja landets överskott av kaffe efter den senaste tidens prisuppgång. Som världens största kaffeodlande land står Brasilien för hela 25 procent av världens kaffeproduktion och ungefär 80 procent av landets produktion utgörs av arabicabönan.
Enligt Agriculture Ministry i Brasilien förväntas årets skörd motsvara 50,5 miljoner bags jämfört med 43,5 miljoner bags för samma period föregående år, en bag kaffe motsvarar cirka 60 kg. Skörden i Brasilien sträcker sig från april till september. En ökad export från Brasilien som en följd av försvagningen av landets valuta har bidragit till det lägre priset. Den ekonomiska osäkerhet som råder globalt väger också tungt på kaffemarknaden.
Socker
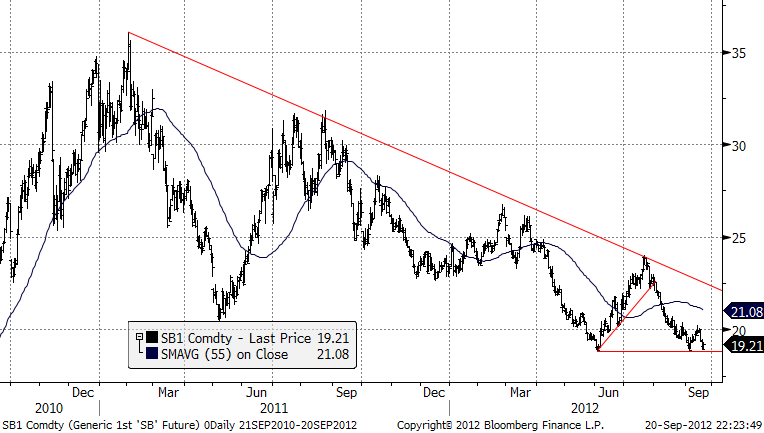
Priset på socker har fallit 3 procent under veckan som gått och handlar nu strax över 20 US cents per pound.
Som vi nämnt ovan så förväntas El Niño bli mild och således inte att medföra större produktionsstörningar i sockerproducerande länder. Terminskontrakt på socker i New York föll till tvåårslägsta efter att torrt väder och lagom mycket regn i Brasilien, världens största sockerproducent, gynnat utvinning av socker från sockerrör. Monsunregn i Indien, världens andra största sockerproducent, ökade förväntningarna på kommande skörd. Den förväntade utbudsökning har pressat ned priset på socker. Förra årets rekordhöga priser ledde till att Kina kraftigt ökade sockerproduktionen. Landet är världens största sockerimportör men kommer efter årets förväntade rekordskörd att minska importen och istället bli en nettoexportör. Sockerskörden i Kina inleds under oktober månad.
För 2012/13 spår International Sugar Organization ett globalt utbudsöverskott på 5,9 miljoner ton, något som begränsar uppsidepotentialen på socker.
Kakao
Kakaopriset fortsatte att falla efter förväntat regn i Elfenbenskusten och Ghana, världens största kakaoproducenter, vilket ökat förhoppningarna om skörden. Väderutsikterna i länderna de närmaste månaderna är avgörande för prisutvecklingen. Historiskt ser vi höga priser och stora investeringar har gjorts i Ghana vilket kan begränsa uppsidan.
Kakaomarknaden är en mycket oförutsägbar och känslig marknad där åtskilliga faktorer påverkar priset.
Flera av de kakaoproducerande länderna lider av inhemska oroligheter och det krävs stora investeringar och långsiktighet för att ett kakaoträd ska bära frukt. Produktionen är ofta kantad av protester och strejker om bättre arbetsförhållanden och träden är dessutom känsliga för sjukdomar.
Kakaopriset finner visst stöd från de diskussioner som förs mellan IMF och Elfenbenskustens Coffee and Cocoa Council, där det råder viss oenighet kring frakt av kakao. Exportörer som köpt kakao på landets elektroniska börs är inte säkra på att de verkligen får kakaon levererad.
Vi väljer att vara neutrala i kakao till nästa vecka.
Politik på agrimarknaden
Frankrike har kallat till ett krismöte med G20’s jordbruksministrar i mitten av oktober i Rom på för att diskutera hur man ska kunna bromsa de kraftiga prissvängningarna i spannmålsmarknaden, efter att årets torka och rekordhöga priser har skapat nya farhågor om en global matkris. Uttalandet kom efter samtal mellan Frankrikes president Francois Hollande och Jose Graziano da Silva, generaldirektör för FN:s livsmedels- och jordbruksorganisation (FAO). Flera förslag har lagts fram under de senaste dagarna, bland annat utveckling av strategiska lager och ett stopp i expanderingen av biobränsle som tillverkas av matgrödor.
För spannmål och övriga jordbruksprodukter hänvisas till gårdagens nyhetsbrev om jordruksprodukter.
[box]SEB Veckobrev Veckans råvarukommentar är producerat av SEB Merchant Banking och publiceras i samarbete och med tillstånd på Råvarumarknaden.se[/box]
Disclaimer
The information in this document has been compiled by SEB Merchant Banking, a division within Skandinaviska Enskilda Banken AB (publ) (“SEB”).
Opinions contained in this report represent the bank’s present opinion only and are subject to change without notice. All information contained in this report has been compiled in good faith from sources believed to be reliable. However, no representation or warranty, expressed or implied, is made with respect to the completeness or accuracy of its contents and the information is not to be relied upon as authoritative. Anyone considering taking actions based upon the content of this document is urged to base his or her investment decisions upon such investigations as he or she deems necessary. This document is being provided as information only, and no specific actions are being solicited as a result of it; to the extent permitted by law, no liability whatsoever is accepted for any direct or consequential loss arising from use of this document or its contents.
About SEB
SEB is a public company incorporated in Stockholm, Sweden, with limited liability. It is a participant at major Nordic and other European Regulated Markets and Multilateral Trading Facilities (as well as some non-European equivalent markets) for trading in financial instruments, such as markets operated by NASDAQ OMX, NYSE Euronext, London Stock Exchange, Deutsche Börse, Swiss Exchanges, Turquoise and Chi-X. SEB is authorized and regulated by Finansinspektionen in Sweden; it is authorized and subject to limited regulation by the Financial Services Authority for the conduct of designated investment business in the UK, and is subject to the provisions of relevant regulators in all other jurisdictions where SEB conducts operations. SEB Merchant Banking. All rights reserved.
Analys
The Mid-East anchor dragging crude oil lower

When it starts to move lower it moves rather quickly. Gaza, China, IEA. Brent crude is down 2.1% today to $62/b after having traded as high as $66.58/b last Thursday and above $70/b in late September. The sell-off follows the truce/peace in Gaze, a flareup in US-China trade and yet another bearish oil outlook from the IEA.

A lasting peace in Gaze could drive crude oil at sea to onshore stocks. A lasting peace in Gaza would probably calm down the Houthis and thus allow more normal shipments of crude oil to sail through the Suez Canal, the Red Sea and out through the Bab-el-Mandeb Strait. Crude oil at sea has risen from 48 mb in April to now 91 mb versus a pre-Covid normal of about 50-60 mb. The rise to 91 mb is probably the result of crude sailing around Africa to be shot to pieces by the Houthis. If sailings were to normalize through the Suez Canal, then it could free up some 40 mb in transit at sea moving onshore into stocks.
The US-China trade conflict is of course bearish for demand if it continues.
Bearish IEA yet again. Getting closer to 2026. Credibility rises. We expect OPEC to cut end of 2025. The bearish monthly report from the IEA is what it is, but the closer we get to 2026, the more likely the IEA is of being ball-park right in its outlook. In its monthly report today the IEA estimates that the need for crude oil from OPEC in 2026 will be 25.4 mb/d versus production by the group in September of 29.1 mb/d. The group thus needs to do some serious cutting at the end of 2025 if it wants to keep the market balanced and avoid inventories from skyrocketing. Given that IEA is correct that is. We do however expect OPEC to implement cuts to avoid a large increase in inventories in Q1-26. The group will probably revert to cuts either at its early December meeting when they discuss production for January or in early January when they discuss production for February. The oil price will likely head yet lower until the group reverts to cuts.
Dubai: The Mid-East anchor dragging crude oil lower. Surplus emerging in Mid-East pricing. Crude oil prices held surprisingly strong all through the summer. A sign and a key source of that strength came from the strength in the front-end backwardation of the Dubai crude oil curve. It held out strong from mid-June and all until late September with an average 1-3mth time-spread premium of $1.8/b from mid-June to end of September. The 1-3mth time-spreads for Brent and WTI however were in steady deterioration from late June while their flat prices probably were held up by the strength coming from the Persian Gulf. Then in late September the strength in the Dubai curve suddenly collapsed. Since the start of October it has been weaker than both the Brent and the WTI curves. The Dubai 1-3mth time-spread now only stands at $0.25/b. The Middle East is now exporting more as it is producing more and also consuming less following elevated summer crude burn for power (Aircon) etc.
The only bear-element missing is a sudden and solid rise in OECD stocks. The only thing that is missing for the bear-case everyone have been waiting for is a solid, visible rise in OECD stocks in general and US oil stocks specifically. So watch out for US API indications tomorrow and official US oil inventories on Thursday.
No sign of any kind of fire-sale of oil from Saudi Arabia yet. To what we can see, Saudi Arabia is not at all struggling to sell its oil. It only lowered its Official Selling Prices (OSPs) to Asia marginally for November. A surplus market + Saudi determination to sell its oil to the market would normally lead to a sharp lowering of Saudi OSPs to Asia. Not yet at least and not for November.
The 5yr contract close to fixed at $68/b. Of importance with respect to how far down oil can/will go. When the oil market moves into a surplus then the spot price starts to trade in a large discount to the 5yr contract. Typically $10-15/b below the 5yr contract on average in bear-years (2009, 2015, 2016, 2020). But the 5yr contract is usually pulled lower as well thus making this approach a moving target. But the 5yr contract price has now been rock solidly been pegged to $68/b since 2022. And in the 2022 bull-year (Brent spot average $99/b), the 5yr contract only went to $72/b on average. If we assume that the same goes for the downside and that 2026 is a bear-year then the 5yr goes to $64/b while the spot is trading at a $10-15/b discount to that. That would imply an average spot price next year of $49-54/b. But that is if OPEC doesn’t revert to cuts and instead keeps production flowing. We think OPEC(+) will trim/cut production as needed into 2026 to prevent a huge build-up in global oil stocks and a crash in prices. But for now we are still heading lower. Into the $50ies/b.
Analys
More weakness and lower price levels ahead, but the world won’t drown in oil in 2026

Some rebound but not much. Brent crude rebounded 1.5% yesterday to $65.47/b. This morning it is inching 0.2% up to $65.6/b. The lowest close last week was on Thursday at $64.11/b.

The curve structure is almost as week as it was before the weekend. The rebound we now have gotten post the message from OPEC+ over the weekend is to a large degree a rebound along the curve rather than much strengthening at the front-end of the curve. That part of the curve structure is almost as weak as it was last Thursday.
We are still on a weakening path. The message from OPEC+ over the weekend was we are still on a weakening path with rising supply from the group. It is just not as rapidly weakening as was feared ahead of the weekend when a quota hike of 500 kb/d/mth for November was discussed.
The Brent curve is on its way to full contango with Brent dipping into the $50ies/b. Thus the ongoing weakening we have had in the crude curve since the start of the year, and especially since early June, will continue until the Brent crude oil forward curve is in full contango along with visibly rising US and OECD oil inventories. The front-month Brent contract will then flip down towards the $60/b-line and below into the $50ies/b.
At what point will OPEC+ turn to cuts? The big question then becomes: When will OPEC+ turn around to make some cuts? At what (price) point will they choose to stabilize the market? Because for sure they will. Higher oil inventories, some more shedding of drilling rigs in US shale and Brent into the 50ies somewhere is probably where the group will step in.
There is nothing we have seen from the group so far which indicates that they will close their eyes, let the world drown in oil and the oil price crash to $40/b or below.
The message from OPEC+ is also about balance and stability. The world won’t drown in oil in 2026. The message from the group as far as we manage to interpret it is twofold: 1) Taking back market share which requires a lower price for non-OPEC+ to back off a bit, and 2) Oil market stability and balance. It is not just about 1. Thus fretting about how we are all going to drown in oil in 2026 is totally off the mark by just focusing on point 1.
When to buy cal 2026? Before Christmas when Brent hits $55/b and before OPEC+ holds its last meeting of the year which is likely to be in early December.
Brent crude oil prices have rebounded a bit along the forward curve. Not much strengthening in the structure of the curve. The front-end backwardation is not much stronger today than on its weakest level so far this year which was on Thursday last week.

The front-end backwardation fell to its weakest level so far this year on Thursday last week. A slight pickup yesterday and today, but still very close to the weakest year to date. More oil from OPEC+ in the coming months and softer demand and rising inventories. We are heading for yet softer levels.

Analys
A sharp weakening at the core of the oil market: The Dubai curve

Down to the lowest since early May. Brent crude has fallen sharply the latest four days. It closed at USD 64.11/b yesterday which is the lowest since early May. It is staging a 1.3% rebound this morning along with gains in both equities and industrial metals with an added touch of support from a softer USD on top.

What stands out the most to us this week is the collapse in the Dubai one to three months time-spread.
Dubai is medium sour crude. OPEC+ is in general medium sour crude production. Asian refineries are predominantly designed to process medium sour crude. So Dubai is the real measure of the balance between OPEC+ holding back or not versus Asian oil demand for consumption and stock building.
A sharp weakening of the front-end of the Dubai curve. The front-end of the Dubai crude curve has been holding out very solidly throughout this summer while the front-end of the Brent and WTI curves have been steadily softening. But the strength in the Dubai curve in our view was carrying the crude oil market in general. A source of strength in the crude oil market. The core of the strength.
The now finally sharp decline of the front-end of the Dubai crude curve is thus a strong shift. Weakness in the Dubai crude marker is weakness in the core of the oil market. The core which has helped to hold the oil market elevated.
Facts supports the weakening. Add in facts of Iraq lifting production from Kurdistan through Turkey. Saudi Arabia lifting production to 10 mb/d in September (normal production level) and lifting exports as well as domestic demand for oil for power for air con is fading along with summer heat. Add also in counter seasonal rise in US crude and product stocks last week. US oil stocks usually decline by 1.3 mb/week this time of year. Last week they instead rose 6.4 mb/week (+7.2 mb if including SPR). Total US commercial oil stocks are now only 2.1 mb below the 2015-19 seasonal average. US oil stocks normally decline from now to Christmas. If they instead continue to rise, then it will be strongly counter seasonal rise and will create a very strong bearish pressure on oil prices.
Will OPEC+ lift its voluntary quotas by zero, 137 kb/d, 500 kb/d or 1.5 mb/d? On Sunday of course OPEC+ will decide on how much to unwind of the remaining 1.5 mb/d of voluntary quotas for November. Will it be 137 kb/d yet again as for October? Will it be 500 kb/d as was talked about earlier this week? Or will it be a full unwind in one go of 1.5 mb/d? We think most likely now it will be at least 500 kb/d and possibly a full unwind. We discussed this in a not earlier this week: ”500 kb/d of voluntary quotas in October. But a full unwind of 1.5 mb/d”
The strength in the front-end of the Dubai curve held out through summer while Brent and WTI curve structures weakened steadily. That core strength helped to keep flat crude oil prices elevated close to the 70-line. Now also the Dubai curve has given in.

Brent crude oil forward curves

Total US commercial stocks now close to normal. Counter seasonal rise last week. Rest of year?

Total US crude and product stocks on a steady trend higher.

-

 Nyheter4 veckor sedan
Tyskland har så höga elpriser att företag inte har råd att använda elektricitet
-

 Nyheter3 veckor sedan
OPEC+ missar produktionsmål, stöder oljepriserna
-

 Nyheter3 veckor sedan
Ett samtal om guld, olja, fjärrvärme och förnybar energi
-

 Nyheter2 veckor sedan
Guld nära 4000 USD och silver 50 USD, därför kan de fortsätta stiga
-

 Analys3 veckor sedan
Are Ukraine’s attacks on Russian energy infrastructure working?
-

 Nyheter1 vecka sedan
Goldman Sachs höjer prognosen för guld, tror priset når 4900 USD
-

 Nyheter2 veckor sedan
Blykalla och amerikanska Oklo inleder ett samarbete
-

 Nyheter3 veckor sedan
Guldpriset uppe på nya höjder, nu 3750 USD


