

Analys
USD weakness, inventory draws and a pinch of Venezuela concerns

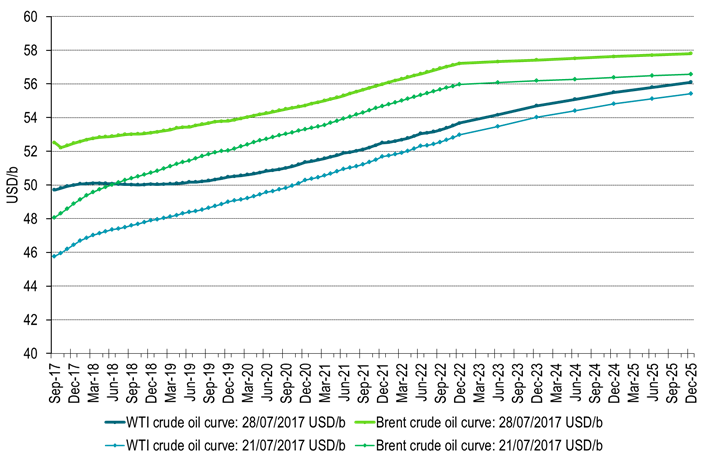
 Last week Brent crude gained 9.3% w/w with a close of $52.52/b on Friday. WTI gained comparably much (+8.6%) with a close of $49.71/b. The main gains were in the front end of the crude curves leading to a substantial flattening of the forward curves. Brent crude Dec 2020 only gained 2.6% with a close of $54.72/b and thus a way smaller gain than in the front end of the forward curves. For WTI the front end contract now only sits $0.34/b below the 18 mth forward WTI contracts which closed the week at $50.05/b.
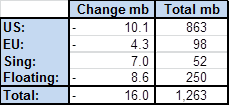
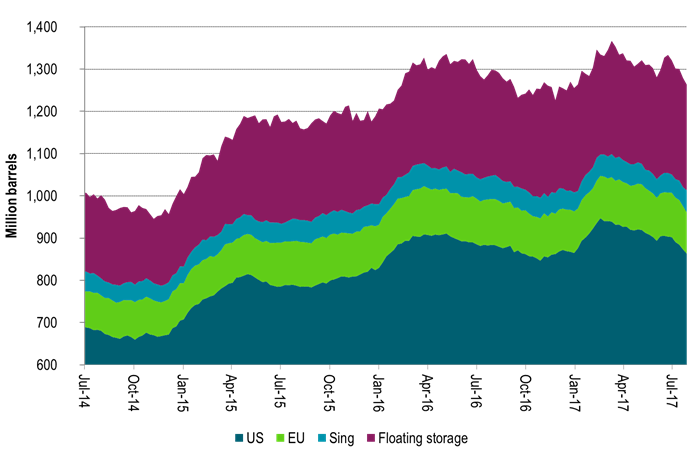
Continued inventory draws last week underpinned the crude oil price rally and the flattening of the forward crude curves. Weekly inventory data last week saw draws of 16 mb of which 10 mb were in the US while a reduction of 8.6 mb in floating storage also took a solid bite. Over the past 5 weeks inventories have drawn down some 70 mb in weekly data. Thus inventory draws kicked in and accelerated almost on the clock as we entered stronger seasonal consumption in Q3-17. Since mid-March weekly data indicate an inventory draw of 104 mb of which 76 mb took place in the US while 18 mb were drawn in floating storage. Refineries are rapidly coming back online with increased crude oil consumption as a result. There are still more refineries to come back online both in Asia and LatAm while Europe and Africa are mostly all up and running. We expect continued draws in H2-17.
Saudi Arabia of course added some extra fuel on the fire last week as they promised exports of no more than 6.6 mb/d in August. That would be their lowest monthly export since early 2011 (not including oil products). From Jan-May Saudi Arabia exported 7.17 kb/d. If it sticks to 6.6 mb/d exports in August it will be a reduction of 705 kb/d y/y versus its pledged production cut of 490 kb/d. The lower export pledged in August of course coincide with high domestic summer demand in Saudi Arabia. As such it remains to be seen whether the export cap of 6.6 mb/d remains in place after August. What it shows more than anything is determination by the Saudi energy minister Al-Falih. Determination to draw inventories down and the time to do it is H2-17 before US shale oil revival extends too far in 2018. It is thus possible that Saudi Arabia maintains its export cap beyond August.
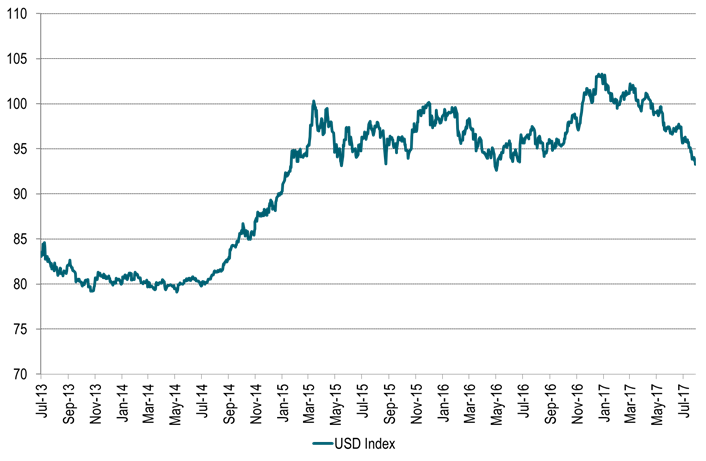
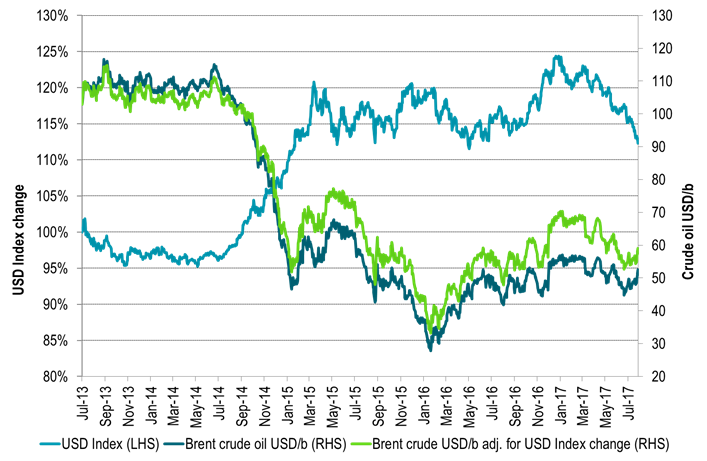
The softening in the US dollar has definitely underpinned the whole crude oil rally. It has underpinned a rally in the whole commodity complex. Over the past 5 weeks Bloomberg’s commodity index has gained 8.3% with 11.9% in Energy, 8.3% in Agri, 7% in Industrial metals and 1% in precious. The USD index has declined a substantial 4.1% over the period with half of the overall commodity index gain being a nominal impact from a softer dollar. IMF’s upgrade last week of growth in Europe, Japan and China while downgrading US growth from 2.3% to 2.1% (little hope for promised tax cuts) is the example in case which drives the dollar lower. US growth has been ahead of the curve for a long time and now the rest of the world is catching up. If the dollar weakness continues it will undoubtedly drive commodity prices in general and oil prices specifically higher in nominal terms. With the 4.1% USD Index decline over the past 5 weeks the Brent crude Dec 2020 contract has gained 5.5%. Thus almost all of this can be attributed to the dollar effect.
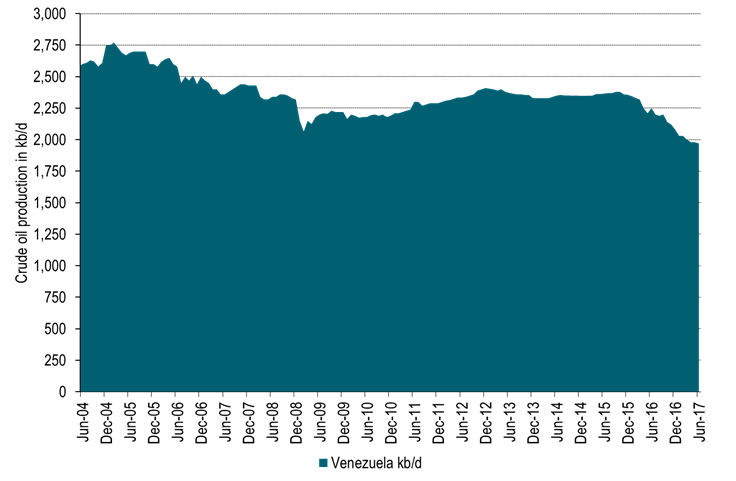
The deteriorating situation in Venezuela probably adds some support to oil prices as well. A national election was held this weekend to vote for members of a National Constituent Assembly. This Assembly will have no fixed term, it will have powers to rewrite the constitution. It will supersede the National Assembly and hand Nicolas Maduro close to dictatorial power and end close to six decades of democracy. At least 10 people were killed in clashes during the election this weekend and some 120 people have been killed in uprisings since April. Venezuela probably holds the world’s largest oil reserves (297 billion barrels) and produced 1.97 mb/d in June (Blberg) which is close to exactly equal to the production cap under the current OPEC production agreement. Its production has however deteriorated steadily due to lack of investments with production standing at 2.37 mb/d back in July 2015. The main concern in the oil market following the election is possible sanctions by Donald Trump. The US buys a third of Venezuela’s oil exports. Extensive US sanctions could make it almost impossible for international oil companies to work in Venezuela. For now the market is awaiting reactions from Donald Trump.
Today equities are up across the board, industrial metals are up 1% and Brent crude traded as much as 0.8% higher before now trading flat at $52.5/b. Thus so far this morning crude oil is lagging behind the gains in industrial metals. Crude oil is trading cautiously following five consecutive days of solid gains. A slight negative this morning is the USD Index which gains 0.3%. We expect to see further oil inventory draws also this week. If the USD Index also continues on its softening trend the two drivers are likely to push crude oil prices yet higher also this week. Money managers have added net long positions for 4 weeks in a row now but probably have room to add more. Producers are likely to sell into the forward crude prices. This is likely to hold back gains for medium term crude prices while inventory draws and investor appetite continues to push upwards in the front leading to a yet flatter crude curve. Potentially shifting the curves into backwardation.
The crude oil inventory draws taking place at the moment are of course real and they will draw down more during H2-17. Still it is important to remember that they are artificially managed by a 1.8 mb/d cut by OPEC and some non-OPEC members. Currently they help to draw down invnetories and to flatten curude curves. When needed however, the volumes will be put back into the market some time in 2018 or 2019.
Ch 1: Inventories in global weekly data drew 16 mb last week.
Over the past 5 weeks inventories have drawn down 70 mb in weekly data
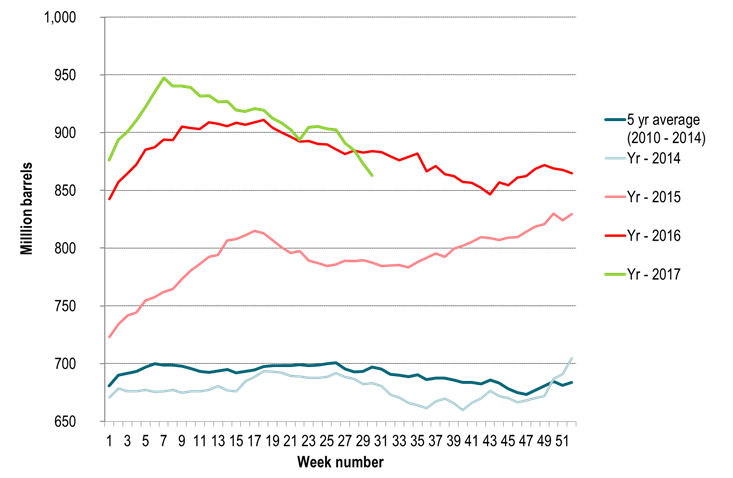
Ch2: US crude and product stocks now well below last year
And down y/y first time since 2014
Ch3: The USD Index has moved down 9.6% since the start of the year
More specifically it has moved down 4.2% since crude oil prices bottomed out in June 21st.
It is now the weakest since a brief sell-off in February 2016.
However, it needs to decline another 15% to get down the the weakness it had in 2014.
Ch4: If we had had USD weakness as in 2014 we should nominally have had an oil price of close to $60/b
Ch5: Crude oil forward curves flattened substantially last week
As investors and refineries bought the front while producers probably sold into the rally out on the curve
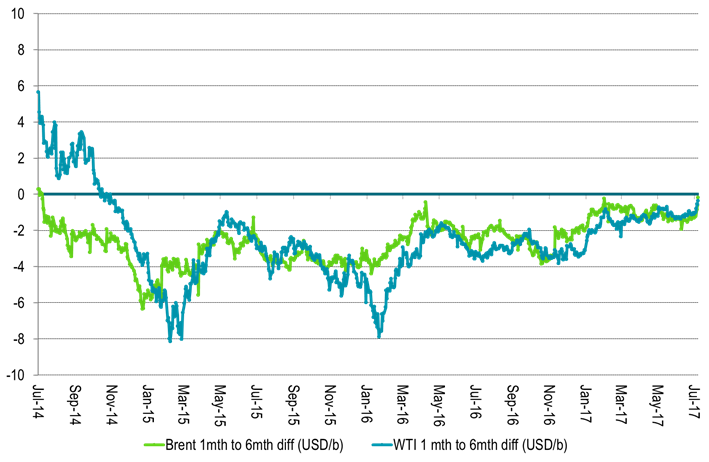
Ch6: The 1 to 6mth crude time spreads got close to zero
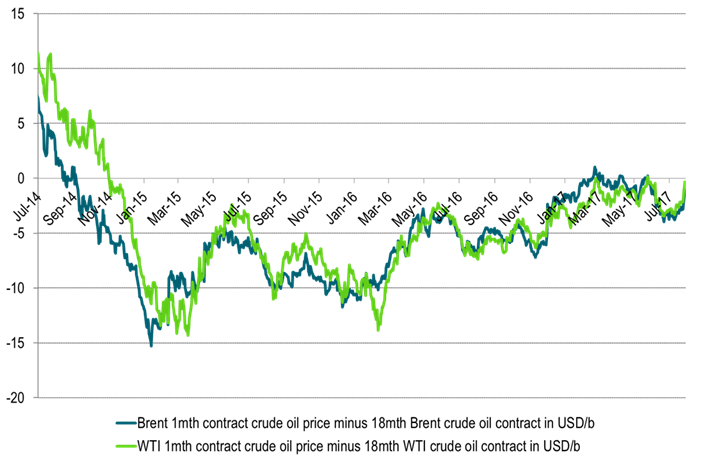
Ch7: And crude time spreads of 1mth to 18mth were not far away either
With WTI 1mth closing just $0.34/b below the 18mth on Friday and trading just $0.19/b below today
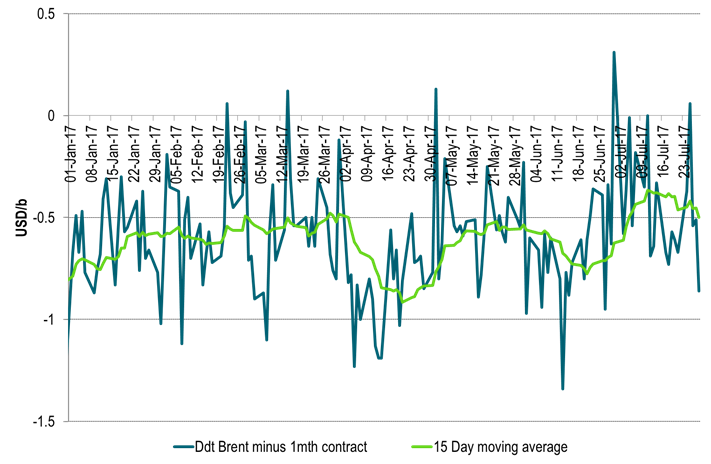
Ch8: A word of caution though. The tightness is not so evident in the Brent crude oil spot market
Dated Brent still trades at a $0.5/b discount to the 1mth contract in a sign that deficit of crude oil is still not quite yet here
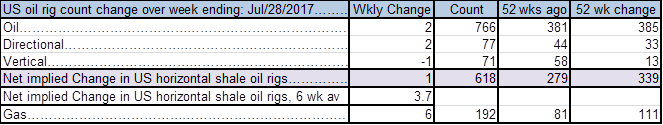
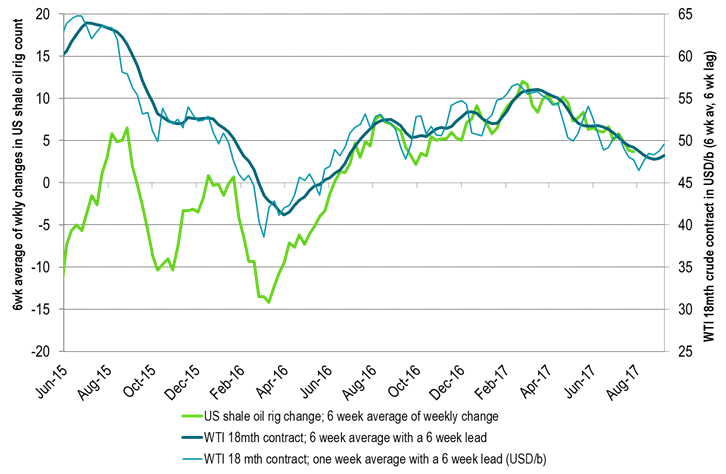
Ch9: US oil players added 2 rigs last week
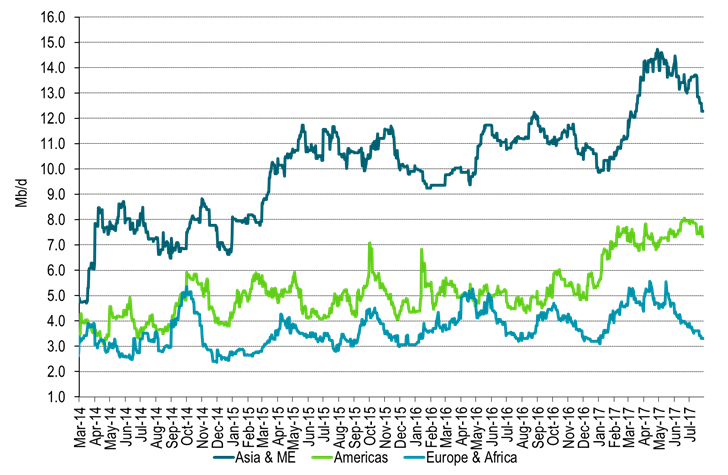
Ch10: Global refineries are rapidly getting back on line consuming more crude oil
More to come in Asia, ME and LatAm
Ch11: Deteriorating crude production in Venezuela
Production could be hit hard by possible US sanctions
Ch12: Net long managed money probably has room to add more length
Even though length has been added 4 weeks in a row now

Kind regards
Bjarne Schieldrop
Chief analyst, Commodities
SEB Markets
Merchant Banking
Parts of the Brent crude curve dipping into the high $50ies/b. Brent crude fell 2.3% over the week to Friday. It closed the week at $61.29/b, a slight gain on the day, but also traded to a low of $60.14/b that same day and just barely avoided trading into the $50ies/b. This morning it is risk-on in equities which seems to help industrial metals a little higher. But no such luck for oil. It is down 0.8% at $60.8/b. This week looks set for Brent crude to dip its feet in the $50ies/b. The Brent 3mth contract actually traded into the high $50ies/b on Friday.

The front-end backwardation has been on a weakening foot and is now about to fully disappear. The lowest point of the crude oil curve has also moved steadily lower and lower and its discount to the 5yr contract is now $6.8/b. A solid contango. The Brent 3mth contract did actually dip into the $50ies/b intraday on Friday when it traded to a low point of $59.93/b.
More weakness to come as lots of oil at sea comes to ports. Mid-East OPEC countries have boosted exports along with lower post summer consumption and higher production. The result is highly visibly in oil at sea which increased by 17 mb to 1,311 mb over the week to Sunday. Up 185 mb since mid-August. On its way to discharge at a port somewhere over the coming month or two.
Don’t forget that the oil market path ahead is all down to OPEC+. Remember that what is playing out in the oil market now is all by design by OPEC+. The group has decided that the unwind of the voluntary cuts is what it wants to do. In a combination of meeting demand from consumers as well as taking back market share. But we need to remember that how this plays out going forward is all at the mercy of what OPEC+ decides to do. It will halt the unwinding at some point. It will revert to cuts instead of unwind at some point.
A few months with Brent at $55/b and 40-50 US shale oil rigs kicked out may be what is needed. We think OPEC+ needs to see the exit of another 40-50 drilling rigs in the US shale oil patches to set US shale oil production on a path to of a 1 mb/d year on year decline Dec-25 to Dec-26. We are not there yet. But a 2-3 months period with Brent crude averaging $55/b would probably do it.
Oil on water increased 17 mb over the week to Sunday while oil in transit increased by 23 mb. So less oil was standing still. More was moving.

Crude oil floating storage (stationary more than 7 days). Down 11 mb over week to Sunday

The lowest point of the Brent crude oil curve versus the 5yr contract. Weakest so far this year.

Crude oil 1mth to 3mth time-spreads. Dubai held out strongly through summer, but then that center of strength fell apart in late September and has been leading weakness in crude curves lower since then.

Rebounding along with most markets. But concerns over solidity of Gaza peace may also contribute. Brent crude fell 0.8% yesterday to $61.91/b and its lowest close since May this year. This morning it is bouncing up 0.9% to $62.5/b along with a softer USD amid positive sentiment with both equities and industrial metals moving higher. Concerns that the peace in Gaza may be less solid than what one might hope for also yields some support to Brent. Bets on tech stocks are rebounding, defying fears of trade war. Money moving back into markets. Gold continues upwards its strong trend and a softer dollar helps it higher today as well.
US crude & products probably rose 5.6 mb last week (API) versus a normal seasonal decline of 2.4 mb. The US API last night partial and thus indicative data for US oil inventories. Their data indicates that US crude stocks rose 7.4 mb last week, gasoline stocks rose 3.0 mb while Distillate stocks fell 4.8 mb. Altogether an increase in commercial crude and product stocks of 5.6 mb. Commercial US crude and product stocks normally decline by 2.4 mb this time of year. So seasonally adjusted the US inventories rose 8 mb last week according to the indicative numbers by the API. That is a lot. Also, the counter seasonal trend of rising stocks versus normally declining stocks this time of year looks on a solid pace of continuation. If the API is correct then total US crude and product stocks would stand 41 mb higher than one year ago and 6 mb higher than the 2015-19 average. And if we combine this with our knowledge of a sharp increase in production and exports by OPEC(+) and a large increase in oil at sea, then the current trend in US oil inventories looks set to continue. So higher stocks and lower crude oil prices until OPEC(+) switch to cuts. Actual US oil inventory data today at 18:00 CET.
US commercial crude and product stocks rising to 1293 mb in week 41 if last nights indicative numbers from API are correct.

Crude oil soon coming to a port near you. OPEC has lifted production sharply higher this autumn. At the same time demand for oil in the Middle-East has fallen as we have moved out of summer heat and crude oil burn for power for air-conditioning. The Middle-East oil producers have thus been able to lift exports higher on both accounts. Crude oil and condensates on water has shot up by 177 mb since mid-August. This oil is now on its way to ports around the world. And when they arrive, it will likely help to lift stocks onshore higher. That is probably when we will lose the last bit of front-end backwardation the the crude oil curves. That will help to drive the front-month Brent crude oil price down to the $60/b line and revisit the high $50ies/b. Then the eyes will be all back on OPEC+ when they meet in early November and then again in early December.
Crude oil and condensates at sea have moved straight up by 177 mb since mid-August as OPEC(+) has produced more, consumed less and exported more.

When it starts to move lower it moves rather quickly. Gaza, China, IEA. Brent crude is down 2.1% today to $62/b after having traded as high as $66.58/b last Thursday and above $70/b in late September. The sell-off follows the truce/peace in Gaze, a flareup in US-China trade and yet another bearish oil outlook from the IEA.
A lasting peace in Gaze could drive crude oil at sea to onshore stocks. A lasting peace in Gaza would probably calm down the Houthis and thus allow more normal shipments of crude oil to sail through the Suez Canal, the Red Sea and out through the Bab-el-Mandeb Strait. Crude oil at sea has risen from 48 mb in April to now 91 mb versus a pre-Covid normal of about 50-60 mb. The rise to 91 mb is probably the result of crude sailing around Africa to be shot to pieces by the Houthis. If sailings were to normalize through the Suez Canal, then it could free up some 40 mb in transit at sea moving onshore into stocks.
The US-China trade conflict is of course bearish for demand if it continues.
Bearish IEA yet again. Getting closer to 2026. Credibility rises. We expect OPEC to cut end of 2025. The bearish monthly report from the IEA is what it is, but the closer we get to 2026, the more likely the IEA is of being ball-park right in its outlook. In its monthly report today the IEA estimates that the need for crude oil from OPEC in 2026 will be 25.4 mb/d versus production by the group in September of 29.1 mb/d. The group thus needs to do some serious cutting at the end of 2025 if it wants to keep the market balanced and avoid inventories from skyrocketing. Given that IEA is correct that is. We do however expect OPEC to implement cuts to avoid a large increase in inventories in Q1-26. The group will probably revert to cuts either at its early December meeting when they discuss production for January or in early January when they discuss production for February. The oil price will likely head yet lower until the group reverts to cuts.
Dubai: The Mid-East anchor dragging crude oil lower. Surplus emerging in Mid-East pricing. Crude oil prices held surprisingly strong all through the summer. A sign and a key source of that strength came from the strength in the front-end backwardation of the Dubai crude oil curve. It held out strong from mid-June and all until late September with an average 1-3mth time-spread premium of $1.8/b from mid-June to end of September. The 1-3mth time-spreads for Brent and WTI however were in steady deterioration from late June while their flat prices probably were held up by the strength coming from the Persian Gulf. Then in late September the strength in the Dubai curve suddenly collapsed. Since the start of October it has been weaker than both the Brent and the WTI curves. The Dubai 1-3mth time-spread now only stands at $0.25/b. The Middle East is now exporting more as it is producing more and also consuming less following elevated summer crude burn for power (Aircon) etc.
The only bear-element missing is a sudden and solid rise in OECD stocks. The only thing that is missing for the bear-case everyone have been waiting for is a solid, visible rise in OECD stocks in general and US oil stocks specifically. So watch out for US API indications tomorrow and official US oil inventories on Thursday.
No sign of any kind of fire-sale of oil from Saudi Arabia yet. To what we can see, Saudi Arabia is not at all struggling to sell its oil. It only lowered its Official Selling Prices (OSPs) to Asia marginally for November. A surplus market + Saudi determination to sell its oil to the market would normally lead to a sharp lowering of Saudi OSPs to Asia. Not yet at least and not for November.
The 5yr contract close to fixed at $68/b. Of importance with respect to how far down oil can/will go. When the oil market moves into a surplus then the spot price starts to trade in a large discount to the 5yr contract. Typically $10-15/b below the 5yr contract on average in bear-years (2009, 2015, 2016, 2020). But the 5yr contract is usually pulled lower as well thus making this approach a moving target. But the 5yr contract price has now been rock solidly been pegged to $68/b since 2022. And in the 2022 bull-year (Brent spot average $99/b), the 5yr contract only went to $72/b on average. If we assume that the same goes for the downside and that 2026 is a bear-year then the 5yr goes to $64/b while the spot is trading at a $10-15/b discount to that. That would imply an average spot price next year of $49-54/b. But that is if OPEC doesn’t revert to cuts and instead keeps production flowing. We think OPEC(+) will trim/cut production as needed into 2026 to prevent a huge build-up in global oil stocks and a crash in prices. But for now we are still heading lower. Into the $50ies/b.


Australien och USA investerar 8,5 miljarder USD för försörjningskedja av kritiska mineraler
Brent crude set to dip its feet into the high $50ies/b this week

Vad guldets uppgång egentligen betyder för världen

Spotpriset på guld över 4300 USD och silver över 54 USD
Crude oil soon coming to a port near you

OPEC+ missar produktionsmål, stöder oljepriserna

Goldman Sachs höjer prognosen för guld, tror priset når 4900 USD

Ett samtal om guld, olja, fjärrvärme och förnybar energi

Blykalla och amerikanska Oklo inleder ett samarbete
Guld nära 4000 USD och silver 50 USD, därför kan de fortsätta stiga
-
 Nyheter4 veckor sedan
OPEC+ missar produktionsmål, stöder oljepriserna
-
 Nyheter2 veckor sedan
Goldman Sachs höjer prognosen för guld, tror priset når 4900 USD
-
 Nyheter4 veckor sedan
Ett samtal om guld, olja, fjärrvärme och förnybar energi
-
 Nyheter3 veckor sedan
Blykalla och amerikanska Oklo inleder ett samarbete
-
 Nyheter3 veckor sedan
Guld nära 4000 USD och silver 50 USD, därför kan de fortsätta stiga
-
Analys4 veckor sedan
Are Ukraine’s attacks on Russian energy infrastructure working?
-

 Nyheter4 veckor sedan
Guldpriset uppe på nya höjder, nu 3750 USD
-
Nyheter3 veckor sedan
Ett samtal om guld, olja, koppar och stål