

Analys
The crude oil market in June – Less of a crowded place


Saudi Arabia today reduced its official selling prices (OSPs) to Asia in June and crude oil prices are bouncing 6-9% on the back of that news. It signals that Saudi Arabia sees the June crude oil market as less of a crowded place and that it will be easier for the producer to place its desired volumes into the market. In a slight parallel to this we think that it is unlikely to be a wall of surplus oil banging on the door of Cushing Oklahoma in June of a comparable magnitude of May. There is probably a limited risk for a repetition of the crash to -$40/bl for the WTI June contract when it rolls off in only 9 trading days on May 19.

Crude oil prices have today been trading a little higher and a little lower until they jumped up 6-9% as Saudi Arabia increased its official selling prices for June versus other benchmarks. Higher official selling prices (OSPs) signals that Saudi Arabia no longer is seeking to push oil into the market at almost any price.
We all know that Saudi Arabia is cutting production down to 8.5 m bl/d but what this is saying is that Saudi sees the June crude oil market as less of a crowded place than before. It will need to work less hard to get oil out the door in June in the amounts it desires.
The WTI May contract crashed oil prices on April 20th. Then prices fumbled around for a week or so before a rally kick-started at the very end of April on the back of emerging signs of demand recovery, cuts by OPEC+ and declines by non-OPEC+ producers. On Tuesday the Brent front-month contract closed above $30/bl for the first time since 13th April before taking a little breather yesterday.
It is now only 9 trading days left until the WTI June contract rolls off and expires on May 19. Attention is again coming back to what happened on April 20 when the WTI May contract expired and traded down to -$40/bl before closing at -$37/bl. The market is concerned that we might get the same kind of end-of-contract disturbances for the June contract as we got for the May contract.
If so, it is highly unlikely that we would see -$40/bl again since the market now is prepared and knows such an event might happen. It is still possible that the WTI June contract could come under intense selling pressure over the coming 9 trading days as long positions move to exit.
The special thing about the WTI contract is of course that it is based and priced in-land in Cushing Oklahoma in the US. It is land-locked with flows in and out of the storage hub going by pipelines. If inventories in Cushing are full and pipes out of Cushing are full then prices can crash.
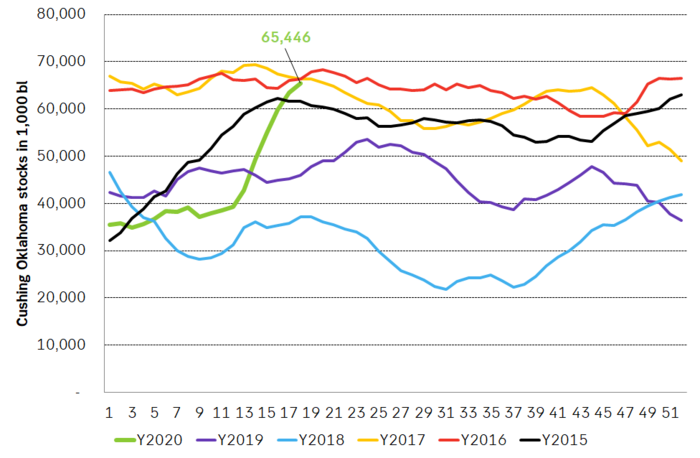
Inventories in Cushing Oklahoma have been on a continuous rise for 9 weeks. Inventories there have risen 28 m bl over this period and as of last week they stood at 65.5 m bl which is slightly below the total capacity of 76.1 m bl and on par with levels in 2016 and early 2017. Last week inventories rose by 2.1 m bl in the hub. In all practical terms the hub is now more or less full.
The number of open positions in the WTI June contract yesterday stood at 239 m bl with a comparable amount of long versus short positions. If the 239 m bl long-side of this equation decides to take these contracts to delivery in June the holders of these contracts will actually receive physical volumes in the Cushing Oklahoma physical location.
When the WTI May contract crashed to -$40/bl on April 20 there was an open position of 109 m bl at the start of the trading day. There were basically no buyers for the long positions who wanted and needed to exit since inventories were more or less fully booked for May with nowhere to take physical delivery.
At the moment we see that Cushing inventories are close to full and still rising though the growth rate in inventories is slowing since we are moving towards total capacity.
The WTI June contract however is about June and not about May. The question is thus what are the storage needs in June? How are the bookings in June? Will surplus oil just continue to flush into Cushing also in June with all pipes in and out of the hub clogged by surplus? Probably not.
Delivered oil products in the US last week stood at 25% below last year which is equal to a decline of close to 5 m bl/d. This is terribly bad, but still better than a YoY decline of 6 m bl/d in mid-April.
But demand in the US is on its way back and demand will by June most definitely be better than it is now. Maybe down only 2-3 m bl/d YoY (which is still exceptionally weak).
Supply in the US and Canada is however declining rapidly and is expected to be down by 3.5 to 4.5 m bl/d versus pre-Corona levels already in the Month of May. It turns out that shutting down a shale oil well is easy, quick and is not damaging to the overall production of the well when it is opened at a later stage.
So, if US demand is back up to within 2-3 m bl/d versus normal in June and supply in the US and Canada is down by 3.5 to 4.5 m bl/d already in May, then there shouldn’t be a massive wall of oil banging on the door of Cushing Oklahoma to get in in June as was the case in May. As such bookings for Cushing Oklahoma inventory in June should be much less strained in June than in May even if we still see rising inventories there right now.
This lowers the risk significantly for a price crash repetition on the 19th of May when the June contract rolls off comparable to what happened to the WTI May contract on the 20th of April.
US Cushing Oklahoma oil inventories rose another 2.1 m bl/d last week to 65.5 m bl which is on par with levels from 2016 and 2017 and only about 10 m bl below max storage capacity of 76.1 m bl. Inventories are in all practical terms full.
Analys
OPEC+ will likely unwind 500 kb/d of voluntary quotas in October. But a full unwind of 1.5 mb/d in one go could be in the cards
Down to mid-60ies as Iraq lifts production while Saudi may be tired of voluntary cut frugality. The Brent December contract dropped 1.6% yesterday to USD 66.03/b. This morning it is down another 0.3% to USD 65.8/b. The drop in the price came on the back of the combined news that Iraq has resumed 190 kb/d of production in Kurdistan with exports through Turkey while OPEC+ delegates send signals that the group will unwind the remaining 1.65 mb/d (less the 137 kb/d in October) of voluntary cuts at a pace of 500 kb/d per month pace.

Signals of accelerated unwind and Iraqi increase may be connected. Russia, Kazakhstan and Iraq were main offenders versus the voluntary quotas they had agreed to follow. Russia had a production ’debt’ (cumulative overproduction versus quota) of close to 90 mb in March this year while Kazakhstan had a ’debt’ of about 60 mb and the same for Iraq. This apparently made Saudi Arabia angry this spring. Why should Saudi Arabia hold back if the other voluntary cutters were just freeriding? Thus the sudden rapid unwinding of voluntary cuts. That is at least one angle of explanations for the accelerated unwinding.
If the offenders with production debts then refrained from lifting production as the voluntary cuts were rapidly unwinded, then they could ’pay back’ their ’debts’ as they would under-produce versus the new and steadily higher quotas.
Forget about Kazakhstan. Its production was just too far above the quotas with no hope that the country would hold back production due to cross-ownership of oil assets by international oil companies. But Russia and Iraq should be able to do it.
Iraqi cumulative overproduction versus quotas could reach 85-90 mb in October. Iraq has however steadily continued to overproduce by 3-5 mb per month. In July its new and gradually higher quota came close to equal with a cumulative overproduction of only 0.6 mb that month. In August again however its production had an overshoot of 100 kb/d or 3.1 mb for the month. Its cumulative production debt had then risen to close to 80 mb. We don’t know for September yet. But looking at October we now know that its production will likely average close to 4.5 mb/d due to the revival of 190 kb/d of production in Kurdistan. Its quota however will only be 4.24 mb/d. Its overproduction in October will thus likely be around 250 kb/d above its quota with its production debt rising another 7-8 mb to a total of close to 90 mb.
Again, why should Saudi Arabia be frugal while Iraq is freeriding. Better to get rid of the voluntary quotas as quickly as possible and then start all over with clean sheets.
Unwinding the remaining 1.513 mb/d in one go in October? If OPEC+ unwinds the remaining 1.513 mb/d of voluntary cuts in one big go in October, then Iraq’s quota will be around 4.4 mb/d for October versus its likely production of close to 4.5 mb/d for the coming month..
OPEC+ should thus unwind the remaining 1.513 mb/d (1.65 – 0.137 mb/d) in one go for October in order for the quota of Iraq to be able to keep track with Iraq’s actual production increase.
October 5 will show how it plays out. But a quota unwind of at least 500 kb/d for Oct seems likely. An overall increase of at least 500 kb/d in the voluntary quota for October looks likely. But it could be the whole 1.513 mb/d in one go. If the increase in the quota is ’only’ 500 kb/d then Iraqi cumulative production will still rise by 5.7 mb to a total of 85 mb in October.
Iraqi production debt versus quotas will likely rise by 5.7 mb in October if OPEC+ only lifts the overall quota by 500 kb/d in October. Here assuming historical production debt did not rise in September. That Iraq lifts its production by 190 kb/d in October to 4.47 mb/d (August level + 190 kb/d) and that OPEC+ unwinds 500 kb/d of the remining quotas in October when they decide on this on 5 October.

U.S. commercial crude inventories posted a marginal draw last week, falling by 0.6 million barrels to 414.8 million barrels. Inventories remain 4% below the five-year seasonal average, but the draw is far smaller than last week’s massive 9.3-million-barrel decline. Higher crude imports (+803,000 bl d WoW) and steady refinery runs (93% utilization) helped keep the crude balance relatively neutral.

Yet another drawdown indicates commercial crude inventories continue to trend below the 2015–2022 seasonal norm (~440 million barrels), though at 414.8 million barrels, levels are now almost exactly in line with both the 2023 and 2024 trajectory, suggesting stable YoY conditions (see page 3 attached).
Gasoline inventories dropped by 1.1 million barrels and are now 2% below the five-year average. The decline was broad-based, with both finished gasoline and blending components falling, indicating lower output and resilient end-user demand as we enter the shoulder season post-summer (see page 6 attached).
On the diesel side, distillate inventories declined by 1.7 million barrels, snapping a two-week streak of strong builds. At 125 million barrels, diesel inventories are once again 8% below the five-year average and trending near the low end of the historical range.
In total, commercial petroleum inventories (excl. SPR) slipped by 0.5 million barrels on the week to ish 1,281.5 million barrels. While essentially flat, this ends a two-week streak of meaningful builds, reflecting a return to a slightly tighter situation.
On the demand side, the DOE’s ‘products supplied’ metric (see page 6 attached), a proxy for implied consumption, softened slightly. Total demand for crude oil over the past four weeks averaged 20.5 million barrels per day, up just 0.9% YoY.
Summing up: This week’s report shows a re-tightening in diesel supply and modest draws across the board, while demand growth is beginning to flatten. Inventories remain structurally low, but the tone is less bullish than in recent weeks.


Brent crude rose 1.6% yesterday. After trading in a range of USD 66.1 – 68.09/b it settled at USD 67.63/b. A level which we are well accustomed to see Brent crude flipping around since late August. This morning it is trading 0.5% higher at USD 68/b. The market was expecting an increase of 230 kb/d in Iraqi crude exports from Kurdistan through Turkey to the Cheyhan port but that has so far failed to materialize. This probably helped to drive Brent crude higher yesterday. Indications last evening that US crude oil inventories likely fell 3.8 mb last week (indicative numbers by API) probably also added some strength to Brent crude late in the session. The market continues to await the much heralded global surplus materializing as rising crude and product inventories in OECD countries in general and the US specifically.
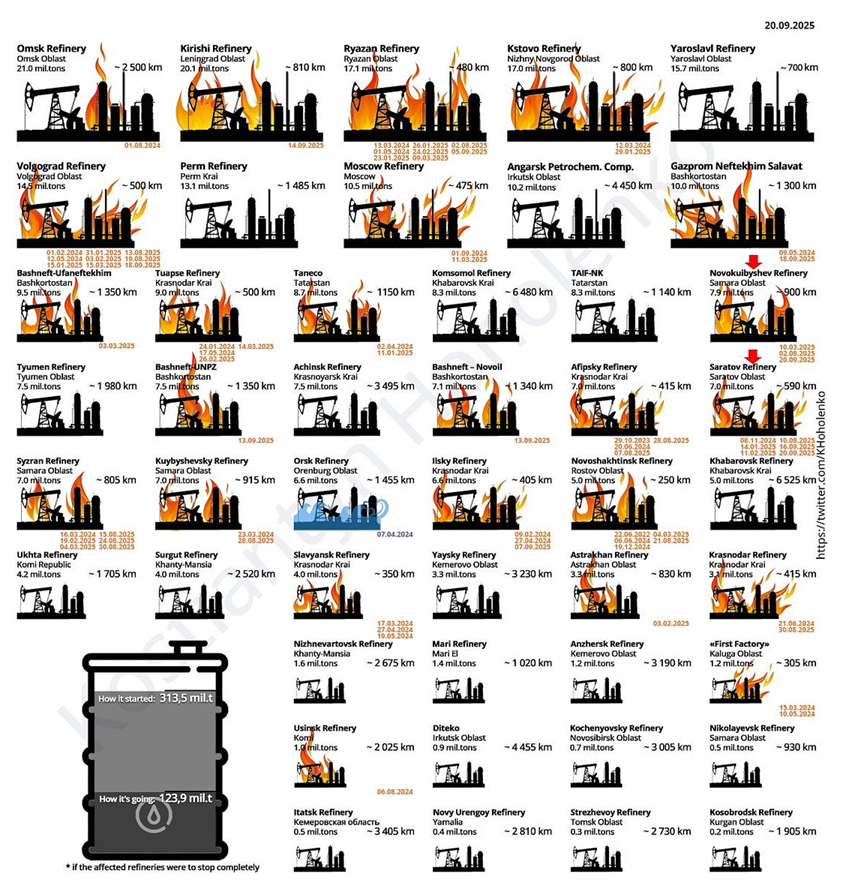
The oil market is starting to focus increasingly on the successful Ukrainian attacks on Russian oil infrastructure. Especially the attacks on Russian refineries. Refineries are highly complex and much harder to repair than simple crude oil facilities like export pipelines, ports and hubs. It can take months and months to repair complex refineries. It is thus mainly Russian oil products which will be hurt by this. First oil product exports will go down, thereafter Russia will have to ration oil product consumption domestically. Russian crude exports may not be hurt as much. Its crude exports could actually go up as its capacity to process crude goes down. SEB’s Emerging Market strategist Erik Meyersson wrote about the Ukrainian campaign this morning: ”Are Ukraine’s attacks on Russian energy infrastructure working?”. Phillips P O’Brian published an interesting not on this as well yesterday: ”An Update On The Ukrainian Campaign Against Russian Refineries”. It is a pay-for article, but it is well worth reading. Amongst other things it highlights the strategic focus of Ukraine towards Russia’s energy infrastructure. A Ukrainian on the matter also put out a visual representation of the attacks on twitter. We have not verified the data representation. It needs to be interpreted with caution in terms of magnitude of impact and current outage.
Complex Russian oil refineries are sitting ducks in the new, modern long-range drone war. Ukraine is building a range of new weapons as well according to O’Brian. The problem with attacks on Russian refineries is thus on the rise. This will likely be an escalating problem for Russia. And oil products around the world may rise versus the crude oil price while the crude oil price itself may not rise all that much due to this.
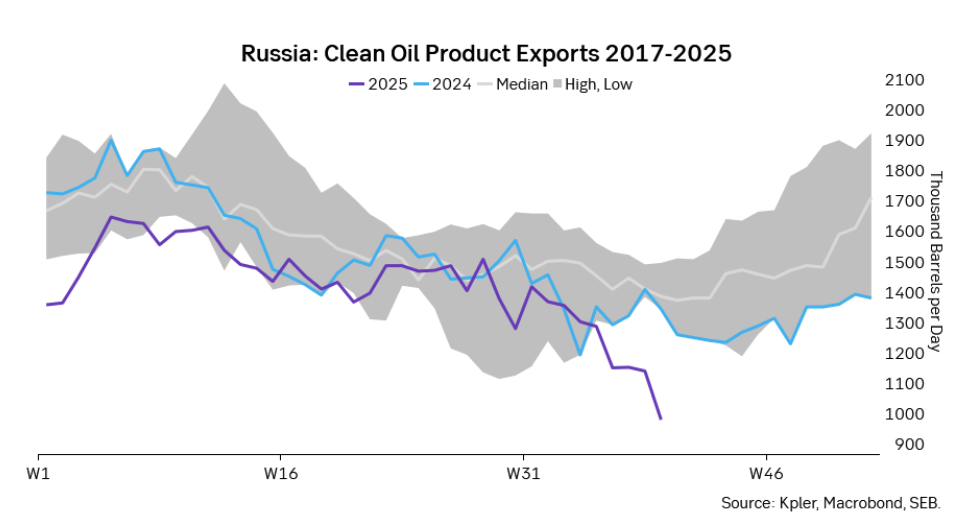
Russian clean oil product exports as presented by SEB’s Erik Meyersson in his note this morning.
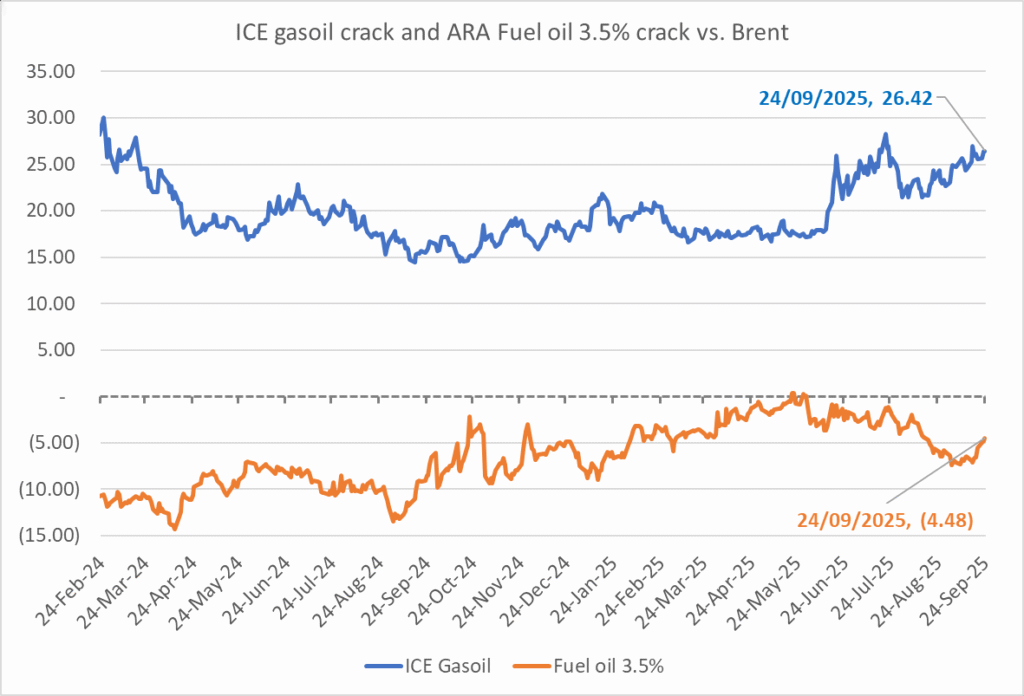
The ICE Gasoil crack and the 3.5% fuel oil crack has been strengthening. The 3.5% crack should have weakened along with rising exports of sour crude from OPEC+, but it hasn’t. Rather it has moved higher instead. The higher cracks could in part be due to the Ukrainian attacks on Russian oil refineries.
Ukrainian inhabitants graphical representation of Ukrainian attacks on Russian oil refineries on Twitter. Highlighting date of attacks, size of refineries and distance from Ukraine. We have not verified the detailed information. And you cannot derive the amount of outage as a consequence of this.

OPEC+ will likely unwind 500 kb/d of voluntary quotas in October. But a full unwind of 1.5 mb/d in one go could be in the cards

Blykalla och amerikanska Oklo inleder ett samarbete

Fortsatt stabilt elpris – men dubbelt så dyrt som i fjol

Ett samtal om guld, olja, koppar och stål

Mixat oktoberväder påverkar elpriset

Eurobattery Minerals satsar på kritiska metaller för Europas självförsörjning

Mahvie Minerals i en guldtrend

Guldpriset kan närma sig 5000 USD om centralbankens oberoende skadas

OPEC signalerar att de inte bryr sig om oljepriset faller kommande månader
Volatile but going nowhere. Brent crude circles USD 66 as market weighs surplus vs risk
-
 Nyheter4 veckor sedan
Eurobattery Minerals satsar på kritiska metaller för Europas självförsörjning
-
 Nyheter3 veckor sedan
Mahvie Minerals i en guldtrend
-
 Nyheter4 veckor sedan
Guldpriset kan närma sig 5000 USD om centralbankens oberoende skadas
-
 Nyheter4 veckor sedan
OPEC signalerar att de inte bryr sig om oljepriset faller kommande månader
-
Analys3 veckor sedan
Volatile but going nowhere. Brent crude circles USD 66 as market weighs surplus vs risk
-

 Nyheter3 veckor sedan
Aktier i guldbolag laggar priset på guld
-

 Nyheter3 veckor sedan
Kinas elproduktion slog nytt rekord i augusti, vilket även kolkraft gjorde
-
 Nyheter2 veckor sedan
Tyskland har så höga elpriser att företag inte har råd att använda elektricitet