

Analys
Shale oil denial once again?

 Price action – Dollar headwinds driving speculators to take money off the table
Equities across the board rebounded 0.7% ydy following the recent North Korea driven sell-off. The USD Index however gained 0.4% on the day which helped to drive all commodity indices lower with the overall Blbrg commodity index down 0.7% with energy losing the most. Brent crude sold down 2.6% closing at $50.73/b while the longer dated Brent Dec 2020 contract only lost 1% closing at $52.62/b.
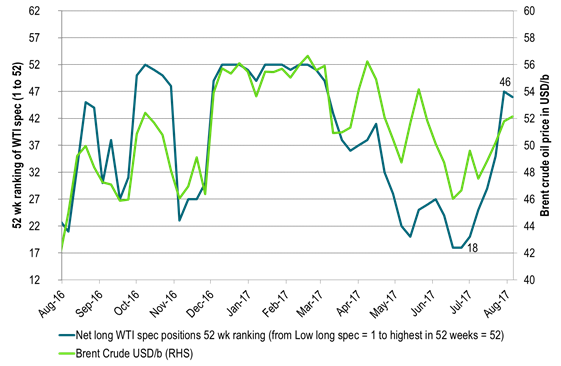
Since a Brent crude oil price low of $44.35/b in June 21st net long speculative WTI positions have moved in only one direction – up. Since then the number of net long speculative WTI contracts have increased by 156,000 contracts (+42%) or 156 mb. As of Tuesday last week the number of net long speculative WTI contracts stood at 532,000 contracts which was the 7th highest speculative position over the past 52 weeks. Except for the release of the US EIA’s monthly Drilling Productivity report there was little in the news that warranted the 2.6% sell-off in Brent crude oil prices other than speculators taking money off the table following 7 consecutive weeks of rising long bets.
Crude oil comment – Shale oil denial once again?
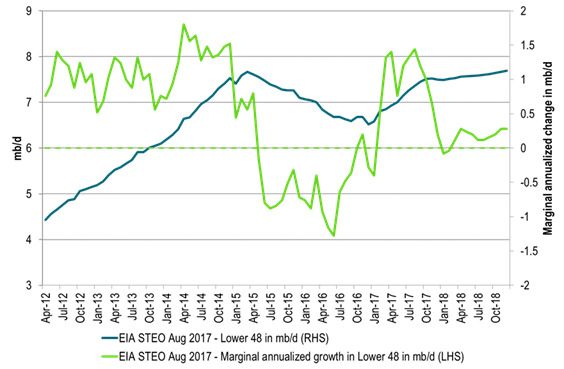
What puzzles us a lot is graph 2 below. It shows the US EIA’s projection of US crude oil production coming out of Lower 48 states (i.e. ex Gulf of Mexico and Alaska). Thus it basically constitutes US shale oil production even though it includes a million or two of US crude production which is not shale oil as well.
What the the US EIA STEO August report projects is that from January to September the marginal, annualized Lower 48 crude oil production growth has averaged 1.25 mb/d. That we buy into. Then however, from October 2017 onwards their projected growth rate then suddenly collapse to a marginal annualized growth rate of only +0.2 mb/d all to the end of 2018 (on average).
When the US shale oil production was booming from 2011 to 2015 the story was always that yes, production is growing strongly now, but next year it will taper off. The tapering off never happened before the oil price collapsed and all breaks were on. During 2012, 2013 and 2014 the US shale oil production grew relentlessly at an annual pace of 1 mb/d.
Thus even if the market is fully aware of US shale oil these days. Fully aware that rigs are rising and productivity is rising. The story still looks a bit the same in terms of what the US EIA currently is projecting in its August STEO report. Yes, shale oil is growing at a strong marginal, annual pace now, but from October onwards it is all going to slow sharply. Thus shale oil awareness is definitely there but is it again too pesimistic in terms of volumes delivered down the road just as was the case consistently from 2012 to 2014/15. Still some kind of shale oil denial in a way in terms of production down the road.
Yesterday the US EIA released its drilling productivity report (DPR) and its DUC’s report (Drilled wells and uncompleted wells). First out the reports stated a projection that US shale oil production will increase by 117 kb/d mth/mth to September. That equals a marginal, annualized pace of 1.4 mb/d per year. The puzzle is that the EIA projects that this strong growth rate is going to suddenly fall back in October onwards.
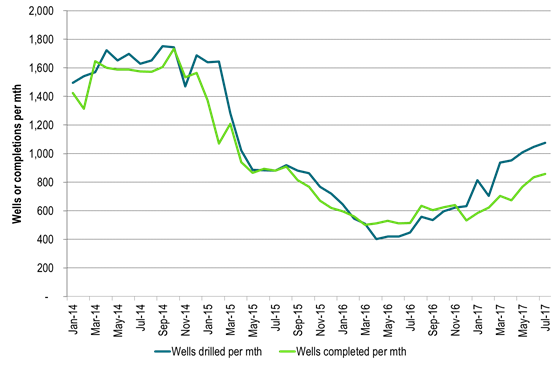
What was further revealed was that the number of completed wells per month continued to rise by 25 wells mth/mth to 859 wells in July. Completions were however still trailing way behind the number of wells drilled by more than 200 wells. Wells drilled reached 1075 wells in July which also was an increase mth/mth by 28 wells. Thus completions are rising but are still solidly trailing behind drilling of wells.
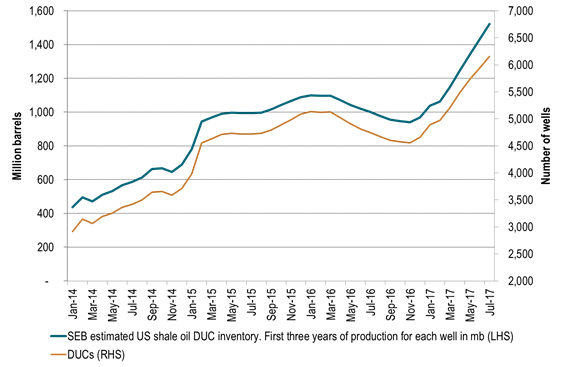
For US shale oil production to slow down we first need to see a halt in the number of drilling rigs being added into operation. Only 2 implied shale oil rigs were added last week, but the number is still rising marginally rather than falling. But yes, that part is slowing down. The next step then is to see that completions manage to catch up with drilling. I.e. completions needs to move from a July level of 859 wells completed to at least 1075 wells drilled. Then the last step is that completions start to draw down the now very high DUC inventory which has seen an increase of 1595 wells since November 2016 now standing at 6154 wells.
So during the unavoidable (some time in the future) draw down period of DUCs we need to see that completions move above drilled wells per month in order to draw down the DUC inventory. I.e. the number of wells completed should move above 1075 wells per month unless of course the number of drilling rigs declines. A lower oil price or reduced access to capital is typically the driving forces which would lead to a reduction in drilling rigs. Captial spending and profitability is definitely at the top end of the agenda these days in the shale oil space.
In terms of the DUC inventory build up. In perspective the 1595 wells added since November last year equates to some 5-600 million barrels of additional producible oil within a three year time frame. That is if we assume 350,000 barrels of oil from each well during the first three years of production on average for all wells.
In this perspective it is difficult to understand the US EIA’s projection that US L48 crude oil production growth is going to slow sharply from October onwards. Drilling rigs are still rising (although slowly) and completions still has a lot of catching up to do just to get up to speed with drilling and then some to draw down the DUC inventory.
Not surprisingly we are bullish for US crude oil production for 2018 where we expect US crude oil production to increase y/y by 1.5 mb/d rather than the US EIA’s y/y projecting that US crude oil will only increase 0.6 mb/d y/y to 2018.
OPEC will have a lont on its hands in 2018 and will likely need to manage supply all through to the end of 2018 rather than to end of Q1-17.
(Data for drilling and completions etc in this report were for the regions Anadarko, Bakken, Eagle Ford, Niobrara and Permian and are from the US EIA.)
Ch1 – Net long specs in WTI reached the 7th highest in a year last Tuesday
A strong, long rise in net long spec since the price low in late June
Sideways price action during most of August with no success to the upside when Brent hit $53.64/b.
Then dollar headwinds and North Korea risk aversion. Both pushing specs to take money off the table
Oil prices in graph are averaged over weeks ending Tuesday. Same as specs reporting
Ch2 – US EIA STEO August report projects a sharp slowdown in marginal growth in US L48 crude oil production from October onwards
How is that possible when drilling rig count is still rising and completions are still working hard catching up rising as well.
Ch3 – Completions of shale wells rising as they try to catch up to drilled wells per month which is also rising (US EIA August DUC report)
Today’s level looks unimpressive versus 2014 levels. But they need to be adjusted with productivity improvements
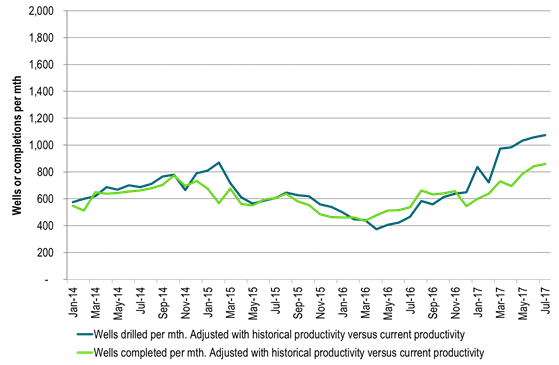
Ch3 – Productivity adjusted – Completions of shale wells rising as they try to catch up to drilled wells per month which is also rising (US EIA August DUC report)
If we productivity adjust the historical data of number of wells drilled and completed with productivity then:
a) Number of drilled wells today per month is 40% higher then the previous peak in September 2014
b) Number of completed wells is 11% higher than the previous peak in October 2014
If completions catches up to current drilling then completions will run 40% higher than the previous peak in October 2014 in productivity adjusted terms.
Ch 4 – Strong rise in DUC (uncompleted wells) inventory since November last year
Equating it to oil it has increased close to 600 mb since Nov last year in terms of oil from first three years of production each well
Kind regards
Bjarne Schieldrop
Chief analyst, Commodities
SEB Markets
Merchant Banking
Rebounding along with most markets. But concerns over solidity of Gaza peace may also contribute. Brent crude fell 0.8% yesterday to $61.91/b and its lowest close since May this year. This morning it is bouncing up 0.9% to $62.5/b along with a softer USD amid positive sentiment with both equities and industrial metals moving higher. Concerns that the peace in Gaza may be less solid than what one might hope for also yields some support to Brent. Bets on tech stocks are rebounding, defying fears of trade war. Money moving back into markets. Gold continues upwards its strong trend and a softer dollar helps it higher today as well.

US crude & products probably rose 5.6 mb last week (API) versus a normal seasonal decline of 2.4 mb. The US API last night partial and thus indicative data for US oil inventories. Their data indicates that US crude stocks rose 7.4 mb last week, gasoline stocks rose 3.0 mb while Distillate stocks fell 4.8 mb. Altogether an increase in commercial crude and product stocks of 5.6 mb. Commercial US crude and product stocks normally decline by 2.4 mb this time of year. So seasonally adjusted the US inventories rose 8 mb last week according to the indicative numbers by the API. That is a lot. Also, the counter seasonal trend of rising stocks versus normally declining stocks this time of year looks on a solid pace of continuation. If the API is correct then total US crude and product stocks would stand 41 mb higher than one year ago and 6 mb higher than the 2015-19 average. And if we combine this with our knowledge of a sharp increase in production and exports by OPEC(+) and a large increase in oil at sea, then the current trend in US oil inventories looks set to continue. So higher stocks and lower crude oil prices until OPEC(+) switch to cuts. Actual US oil inventory data today at 18:00 CET.
US commercial crude and product stocks rising to 1293 mb in week 41 if last nights indicative numbers from API are correct.

Crude oil soon coming to a port near you. OPEC has lifted production sharply higher this autumn. At the same time demand for oil in the Middle-East has fallen as we have moved out of summer heat and crude oil burn for power for air-conditioning. The Middle-East oil producers have thus been able to lift exports higher on both accounts. Crude oil and condensates on water has shot up by 177 mb since mid-August. This oil is now on its way to ports around the world. And when they arrive, it will likely help to lift stocks onshore higher. That is probably when we will lose the last bit of front-end backwardation the the crude oil curves. That will help to drive the front-month Brent crude oil price down to the $60/b line and revisit the high $50ies/b. Then the eyes will be all back on OPEC+ when they meet in early November and then again in early December.
Crude oil and condensates at sea have moved straight up by 177 mb since mid-August as OPEC(+) has produced more, consumed less and exported more.

When it starts to move lower it moves rather quickly. Gaza, China, IEA. Brent crude is down 2.1% today to $62/b after having traded as high as $66.58/b last Thursday and above $70/b in late September. The sell-off follows the truce/peace in Gaze, a flareup in US-China trade and yet another bearish oil outlook from the IEA.
A lasting peace in Gaze could drive crude oil at sea to onshore stocks. A lasting peace in Gaza would probably calm down the Houthis and thus allow more normal shipments of crude oil to sail through the Suez Canal, the Red Sea and out through the Bab-el-Mandeb Strait. Crude oil at sea has risen from 48 mb in April to now 91 mb versus a pre-Covid normal of about 50-60 mb. The rise to 91 mb is probably the result of crude sailing around Africa to be shot to pieces by the Houthis. If sailings were to normalize through the Suez Canal, then it could free up some 40 mb in transit at sea moving onshore into stocks.
The US-China trade conflict is of course bearish for demand if it continues.
Bearish IEA yet again. Getting closer to 2026. Credibility rises. We expect OPEC to cut end of 2025. The bearish monthly report from the IEA is what it is, but the closer we get to 2026, the more likely the IEA is of being ball-park right in its outlook. In its monthly report today the IEA estimates that the need for crude oil from OPEC in 2026 will be 25.4 mb/d versus production by the group in September of 29.1 mb/d. The group thus needs to do some serious cutting at the end of 2025 if it wants to keep the market balanced and avoid inventories from skyrocketing. Given that IEA is correct that is. We do however expect OPEC to implement cuts to avoid a large increase in inventories in Q1-26. The group will probably revert to cuts either at its early December meeting when they discuss production for January or in early January when they discuss production for February. The oil price will likely head yet lower until the group reverts to cuts.
Dubai: The Mid-East anchor dragging crude oil lower. Surplus emerging in Mid-East pricing. Crude oil prices held surprisingly strong all through the summer. A sign and a key source of that strength came from the strength in the front-end backwardation of the Dubai crude oil curve. It held out strong from mid-June and all until late September with an average 1-3mth time-spread premium of $1.8/b from mid-June to end of September. The 1-3mth time-spreads for Brent and WTI however were in steady deterioration from late June while their flat prices probably were held up by the strength coming from the Persian Gulf. Then in late September the strength in the Dubai curve suddenly collapsed. Since the start of October it has been weaker than both the Brent and the WTI curves. The Dubai 1-3mth time-spread now only stands at $0.25/b. The Middle East is now exporting more as it is producing more and also consuming less following elevated summer crude burn for power (Aircon) etc.
The only bear-element missing is a sudden and solid rise in OECD stocks. The only thing that is missing for the bear-case everyone have been waiting for is a solid, visible rise in OECD stocks in general and US oil stocks specifically. So watch out for US API indications tomorrow and official US oil inventories on Thursday.
No sign of any kind of fire-sale of oil from Saudi Arabia yet. To what we can see, Saudi Arabia is not at all struggling to sell its oil. It only lowered its Official Selling Prices (OSPs) to Asia marginally for November. A surplus market + Saudi determination to sell its oil to the market would normally lead to a sharp lowering of Saudi OSPs to Asia. Not yet at least and not for November.
The 5yr contract close to fixed at $68/b. Of importance with respect to how far down oil can/will go. When the oil market moves into a surplus then the spot price starts to trade in a large discount to the 5yr contract. Typically $10-15/b below the 5yr contract on average in bear-years (2009, 2015, 2016, 2020). But the 5yr contract is usually pulled lower as well thus making this approach a moving target. But the 5yr contract price has now been rock solidly been pegged to $68/b since 2022. And in the 2022 bull-year (Brent spot average $99/b), the 5yr contract only went to $72/b on average. If we assume that the same goes for the downside and that 2026 is a bear-year then the 5yr goes to $64/b while the spot is trading at a $10-15/b discount to that. That would imply an average spot price next year of $49-54/b. But that is if OPEC doesn’t revert to cuts and instead keeps production flowing. We think OPEC(+) will trim/cut production as needed into 2026 to prevent a huge build-up in global oil stocks and a crash in prices. But for now we are still heading lower. Into the $50ies/b.
Some rebound but not much. Brent crude rebounded 1.5% yesterday to $65.47/b. This morning it is inching 0.2% up to $65.6/b. The lowest close last week was on Thursday at $64.11/b.
The curve structure is almost as week as it was before the weekend. The rebound we now have gotten post the message from OPEC+ over the weekend is to a large degree a rebound along the curve rather than much strengthening at the front-end of the curve. That part of the curve structure is almost as weak as it was last Thursday.
We are still on a weakening path. The message from OPEC+ over the weekend was we are still on a weakening path with rising supply from the group. It is just not as rapidly weakening as was feared ahead of the weekend when a quota hike of 500 kb/d/mth for November was discussed.
The Brent curve is on its way to full contango with Brent dipping into the $50ies/b. Thus the ongoing weakening we have had in the crude curve since the start of the year, and especially since early June, will continue until the Brent crude oil forward curve is in full contango along with visibly rising US and OECD oil inventories. The front-month Brent contract will then flip down towards the $60/b-line and below into the $50ies/b.
At what point will OPEC+ turn to cuts? The big question then becomes: When will OPEC+ turn around to make some cuts? At what (price) point will they choose to stabilize the market? Because for sure they will. Higher oil inventories, some more shedding of drilling rigs in US shale and Brent into the 50ies somewhere is probably where the group will step in.
There is nothing we have seen from the group so far which indicates that they will close their eyes, let the world drown in oil and the oil price crash to $40/b or below.
The message from OPEC+ is also about balance and stability. The world won’t drown in oil in 2026. The message from the group as far as we manage to interpret it is twofold: 1) Taking back market share which requires a lower price for non-OPEC+ to back off a bit, and 2) Oil market stability and balance. It is not just about 1. Thus fretting about how we are all going to drown in oil in 2026 is totally off the mark by just focusing on point 1.
When to buy cal 2026? Before Christmas when Brent hits $55/b and before OPEC+ holds its last meeting of the year which is likely to be in early December.
Brent crude oil prices have rebounded a bit along the forward curve. Not much strengthening in the structure of the curve. The front-end backwardation is not much stronger today than on its weakest level so far this year which was on Thursday last week.

The front-end backwardation fell to its weakest level so far this year on Thursday last week. A slight pickup yesterday and today, but still very close to the weakest year to date. More oil from OPEC+ in the coming months and softer demand and rising inventories. We are heading for yet softer levels.


Vad guldets uppgång egentligen betyder för världen

Spotpriset på guld över 4300 USD och silver över 54 USD
Crude oil soon coming to a port near you

Guld och silver stiger hela tiden mot nya höjder
The Mid-East anchor dragging crude oil lower

OPEC+ missar produktionsmål, stöder oljepriserna

Ett samtal om guld, olja, fjärrvärme och förnybar energi

Goldman Sachs höjer prognosen för guld, tror priset når 4900 USD
Guld nära 4000 USD och silver 50 USD, därför kan de fortsätta stiga
Are Ukraine’s attacks on Russian energy infrastructure working?
-
 Nyheter3 veckor sedan
OPEC+ missar produktionsmål, stöder oljepriserna
-
 Nyheter4 veckor sedan
Ett samtal om guld, olja, fjärrvärme och förnybar energi
-
 Nyheter2 veckor sedan
Goldman Sachs höjer prognosen för guld, tror priset når 4900 USD
-
 Nyheter2 veckor sedan
Guld nära 4000 USD och silver 50 USD, därför kan de fortsätta stiga
-
Analys4 veckor sedan
Are Ukraine’s attacks on Russian energy infrastructure working?
-

 Nyheter3 veckor sedan
Blykalla och amerikanska Oklo inleder ett samarbete
-

 Nyheter4 veckor sedan
Guldpriset uppe på nya höjder, nu 3750 USD
-
Nyheter3 veckor sedan
Ett samtal om guld, olja, koppar och stål