

Analys
SEB Råvarubrev 22 augusti 2017

 Rallyt i industrimetaller går för fort!
MARKNADEN I KORTHET
Sommaren har bjudit på en viss dramatik avseende en betydligt svagare dollar än vad undertecknad hade förväntat sig. Dessutom har börserna uppvisat en del svaghetstecken. Nordkorea har varit i fokus och kommer nog att var så ytterligare ett tag. För innevarande vecka så väntar nog marknaden på framför allt på den kommande Jackson Hole konferensen (24 – 26 aug) där både Mrs. Yellen och Signori Draghi kommer att tala. Marknaden kommer att lusläsa talen i sökandet efter indikationer om den framtida penningpolitiken. Man kan väl misstänka att Hr. Draghi kommer att vara återhållsam för att inte ytterligare ”prata” upp euron (tysk BNP var ju senast något svagare med utrikeshandeln svag (starkare €?) men med draghjälp från den inhemska ekonomin) inför ECB mötet den 7 september.

Anders Söderberg, Redaktör
Råvaror: Oljepriset ser i och med återvändandet över $50/fat att verkligen ha passerat sin lågpunkt. Lagren fortsätter att falla och efterfrågeprognoserna skrivits upp. Adderandet av amerikanska borriggar har mer eller mindre upphört, 0.2 stycke i snitt de senaste sex veckorna. Å andra sidan fortsätter framför allt Irak och Bolivia att pumpa betydligt mer än vad de ska göra enligt överenskommelsen. Industrimetaller har gått starkt under sommaren med järnmalm i täten (~45 %) men börjar i vissa fall lämna fundamentalt motiverade nivåer bakom sig. Zink har nått ett långsiktigt tekniskt mål om $3146, och har i alla fall slutat stiga därefter. Återöppnande av gruvor har nu annonserats vilket väl får anses visa att priset nu är väldigt attraktivt för producenterna. Ädelmetallerna har också stigit med palladium i täten (16 års högsta) med förväntningar att konsumenterna ska gå från diesel till bensinbilar efter dieselskandalerna och den ökade europeiska fokuseringen på utsläpp av kväveoxider (vilket länge varit fokus i USA). Svag dollar och geopolitisk oro har hjälpt upp guldet till $1300 nivån där vi dock tidigare i år vänt ett par gånger. Majs, vete och soja har fallit och föll ännu mer efter den senaste WASDE rapporten. Socker ser ut att ha avslutat sin uppåt korrektion och nya bottnar ser troliga ut. Elpriser har stigit på baksidan av att framför allt kolet stigit samt rykten om likartade problem med fransk kärnkraft som förra hösten då ju priset steg kraftigt.
Valuta: Dollarindex har under sommaren som lägst fallit ned till 92,55, inte långt ifrån huvudstödet vid 91,92 (i USD/SEK termer motsvarar det 8,0575 respektive 7,8935). Lägre förväntningar på framtida FED-höjningar och en tro på att ECB snart ska börja minska sina stimulanser ligger bakom rörelsen (i USD/SEK kan vi addera högre än förväntad inflation i Sverige). Tekniskt sett börjar NOK/SEK se intressant ut för ett möjligt utbrott på uppsidan.
Börser: Europa har som väntat varit den svagaste länken i börskedjan. De negativa signaler som genererades i och med skiftet juni/juli har fortsatt att pressa marknaden och vi ser fortsatt en viss risk för ytterligare nedgång, troligen efter en rekyl. S & P 500 har nått ett första möjligt korrektionsmål vid 2416, så får vi se om stödet håller eller ej.
Räntor: Långa räntor har stigit men nyligen korrigerat lägre. Vi tror att de snart åter ska stiga.
OBSERVATIONER I SAMMANDRAG
- Olja – överlag en något positivare ton.
- Aluminium – för mycket för fort?
- Guld – falskt brott av $1296 ger huvudbry.
- DAX – korrektion inte björnmarknad.
- NOK/SEK – kan norsk BNP komma att lyfta valutaparet?
- OMX30 – svagt men nog dags för en rekyl i nedgången.
En placering i certifikat och warranter är förknippat med risker. Du kan förlora hela ditt investerade kapital. Läs mer om riskerna i SEB:s offentliggjorda Grundprospekt för certifikat- och warrantprogram på seb.se/cert eller seb.se/mini
OLJA BRENT
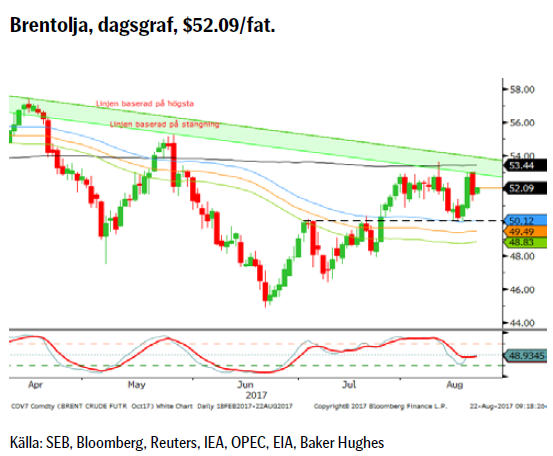 Även om vi var lite tidigt ute med att tro på att oljeprisnedgången gjort sitt tog det inte mer än en vecka innan vår vy hamnade i fas med verkligheten. Brottet tillbaka upp över $50 (och 55d mv-bandet) har adderat till en positivare vy. Dessutom såg vi förra veckan antalet borriggar i USA falla, marginellt men ändå en signal om att priset under juli varit väl lågt. Enligt en artikel i WSJ så börjar en del investerare att åter vända blicken mot konventionella oljekällor.
Konklusion: Återhämtningen ser ut att fortsätta.
OBSERVATIONER
+ Antalet borriggar i USA föll med 5 förra veckan.
+ Neddragningar av amerikanska lager har fortsatt men den ökade produktionen är ett hot.
+ Nedgången i mogna oljefält största sedan 1992.
+ Både IEA och OPEC har nu uppgraderat prognoserna för efterfrågan på olja.
+ Spekulanterna har kraftigt ökat sin långa nettoposition och är nu ungefär lika positiva som i mars.
+ En förlängd OPEC neddragning med 9 månader till 31/3-18.
+ Situationen i Venezuela är fortsatt mycket skakig.
+ Tekniskt sett en försiktig positiv vy så länge junis botten håller.
– OPEC/ icke OPEC uppfyllde bara ~75 % av utlovade neddragningar i juli vilket gör att man överproducerar CA. 470 kfpd.
– STEO kommer troligen att revidera upp US prod. 2018/19.
– Libysk produktion nu uppe i över 1m fpd.
– Forcadoterminalen ökar Nigerias export med ~200k fpd och prognosen för Nigeria är att nå 2m fpd i augusti.
– Hur OPEC’s exitstrategi ska se ut.
– Förslag att sälja halva den amerikanska strategiska reserven, som redan nu krympt en hel del visar statistiken.
– Tekniskt så är det negativt att vi befinner oss under den fallande topplinjen och att vi regelbundet har vänt ned därifrån.
Tillgängliga certifikat:
BULL OLJA X1, X2, X4, X5, & X10 S
BEAR OLJA X1, X2, X4, X5 & X10 S
ALUMINIUM
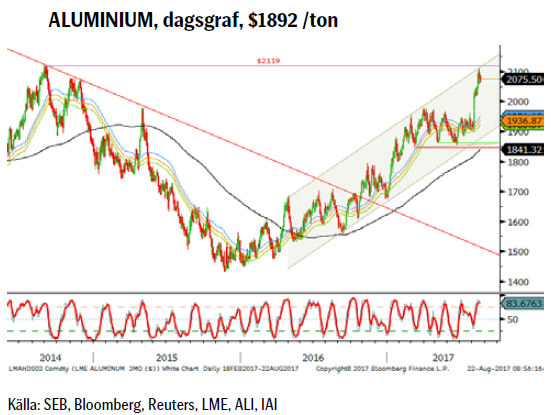 Trots att priset nått nivåer som inte riktigt kan försvaras ur en fundamental synvinkel så fortsätter marknaden att handla starkt. Fokus ligger fortsatt på kinesiska neddragningar och nu senast på nyheter att man i provinsen Shangdong beordrat nedstängning av kapacitet motsvarande drygt 3miljoner ton, något mer än marknadens förväntningar. Här finns en detalj som möjligen kan göra marknaden besviken framöver, det här är i huvudsak beordrad stängning av ”illegal” kapacitet varför den inte kommer att synas i den officiella statistiken.
Konklusion: Dags för rallyt att ta en paus?
OBSERVATIONER
+ Kinesisk produktion var i juli lägre än i juni.
+ Stigande energipriser (kol) lyfter produktionskostnaderna.
+ Ytterligare produktion riskerar att tvingas att slå igen pga. otillåten verksamhet.
+ Fundamentala faktorer och inte positionering har drivit priset.
+ Den svagare dollarn.
+ Bilindustrin kommer att fortsatt att öka inslaget av alu.
+ LME lagren är relativt låga och i fallande.
+ Fortsatt stark men avsvalnande bostadsmarknad i Kina.
+ Tekniskt befinner sig aluminiumet i en positiv trend.
– Kinesisk industriproduktion blev lägre än förväntat i juli (så även konsumentförsäljning och investeringar).
– Höga lager i Kina (inför risken av framtvingade nedstängningar under perioden nov – mars).
– Oklarheten om vad resultatet blir av att USA dragit Kina inför WTO avseende kinesisk alu-export till USA (subventioner av elpriser).
– Likviditetssituationen i Kina, SHIBOR har efter en mindre rekyl åter börjat stiga.
– Kinesiska myndigheters ”kamp” mot skuggbanksektorn.
– Blir det några infrastruktursatsningar i USA.
– Tekniskt sett bör $2119 nu åtminstone vara ett temporärt tak.
– Tekniskt sett så visar veckografen på en möjlig negativ divergens (dvs.nya toppar i pris, lägre i indikator).
Tillgängliga certifikat:
BULL ALUMINIUM X1, X2 & X4 S
BEAR ALUMINIUM X1, X2 & X4 S
GULD
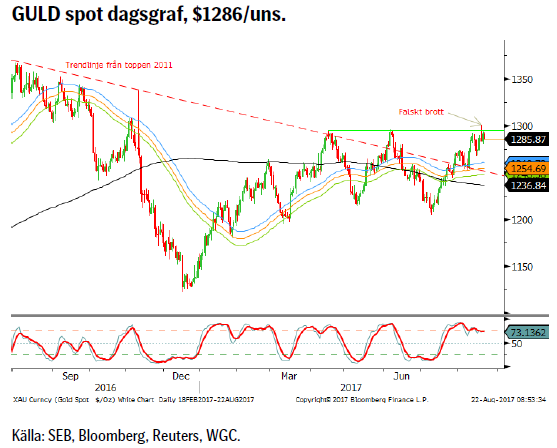 Sedan vår förra uppdatering den 11:e juli så har guldpriset stigit relativt kraftigt. Orsakerna är framför allt, den fallande dollarn (på baksidan av bakslag efter bakslag för Trump samt förväntningar på att ECB börjar minska QE), det amerikanska skuldtaket ($20 triljoner) och Nordkorea. Man kan nu eventuellt argumentera att marknaden nu till viss del prisat in dessa risker och att ytterligare press uppåt behöver ny information. ECB lär vara väldigt försiktiga med att ”prata” upp euron ytterligare, skuldtaket (egentligen nådde vi det i våras men diverse kreativ bokföring gör att man fortfarande håller sig flytande) är inte den katastrof media torgför, USA går inte i konkurs, skatter flyter in och förfallna lån kan återupptas dock inte nya för att täcka budgetunderskottet. Nordkorea är dock svårare att sia om.
Konklusion: Det falska brottet över $1296 bör oroa den som kortsiktigt är lång guld.
OBSERVATIONER
+ Dollarns försvagning.
+ Trump misslyckas med att få igenom sina frågor.
+ Förväntan på ECB om minskad QE.
+ Nordkorea problematiken.
+ Den spekulativa nettopositioneringen har ökat kraftigt (minskat antal korta och ökat antal långa kontrakt).
+ Asiatisk fysisk import fortsatt stark.
+ SPDR guld ETF godkända enligt den nya Shariastandarden.
+ Fallande produktion (peak-gold 2015), det är numera guldskrotet som täcker underskottet.
+ Fallande realräntor.
+ Tekniskt så är det positivt att vi åter är över 55d mv bandet och 233d mv samt trendlinjen från toppen 2011.
– Många centralbanker har på senare tid börjat låta betydligt mer hök-aktiga.
– Inflationen är fortsatt låg (utom Sverige, men det är temporärt drivet av semesterresor och elektronikskatt).
– Om dollarn skulle stiga kraftigt.
– Tekniskt väldigt mycket stöd $1260 – 1237 området.
Tillgängliga certifikat:
BULL GULD X1, X2, X4, X5 & X10 S
BEAR GULD X1, X2, X4, X5 & X10 S
DAX
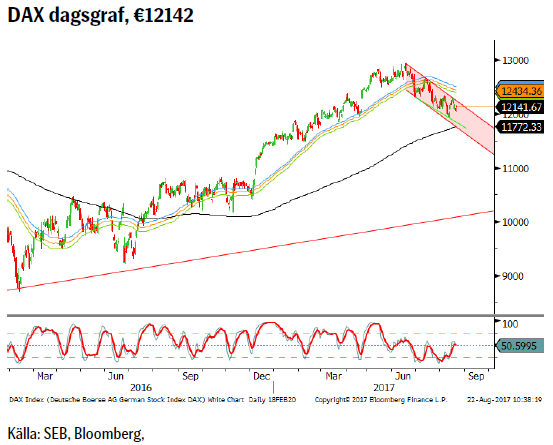 Den tekniska månadssäljsignalen i juni förstärktes i och med prisutvecklingen i juli. Sannolikt måste vi räkna med mer svaghet innan vi hittar fast mark under fötterna. En långsiktig vågräkning är dock fortsatt positiv varför vi fortsätter att etikettera nedgången som korrektiv. Givet den kraftiga förstärkningen av euron bör ECB vara ytterst försiktiga med uttalanden/åtgärder som skulle kunna stödja euron ytterligare. En återgång över 55d mv-bandet krävs för att vända till positiv igen.
Konklusion: En positiv reaktion förväntas inom kort.
OBSERVATIONER
+ ZEW för augusti blev både bättre än förväntat och högre än i juli.
+ IFO slog nytt rekord i juli.
+ Tysk arbetslöshet är rekordlåg.
+ ECB lär hålla räntorna låga för lång tid framöver.
+ De senaste bankkriserna i Spanien och Italien under juni har inte lett till några svallvågor snarare tvärtom.
+ Nästa viktiga stöd utgörs av 233d mv och den korta kanalbotten.
+ Det finns en liten men ändock positiv divergens mellan den senaste botten i pris och indikatorn (högre botten).
– Tysk BNP kom in något svagare än förväntat.
– Dieselgate (vi har inte sett slutet på detta än).
– Minskat inflöde från amerikanska investerare.
– Stigande räntor.
– President Trump’s handelspolitik, han har varnat tysk bilindustri.
– Den starkare euron utgör en motvind för hela eurozonen.
– Tekniskt så har månadsgrafen i juni signalerat för korrektion.
– Tekniskt så har vi brutit under den stigande 55d mv kanalen.
– Tekniskt sett så ligger vi i en kortare fallande kanal.
Tillgängliga certifikat:
BULL DAX X2, X5, X10 & X15 S
BEAR DAX X1, X2, X5, X10 & X15 S
NOK/SEK
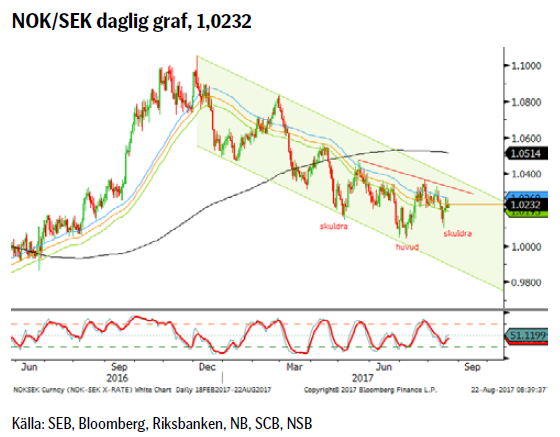 Denna vecka bjuder på en hel del ekonomisk statistik från Sverige men framför allt från Norge. Idag kom konsumentförtroendet för kv. 3 från Norge som blev 16.2 jämfört med 11.1 förra kvartalet. På onsdag kommer norsk arbetslöshet och på torsdag norsk BNP för andra kvartalet samt resultatet för den senaste oljeinvesteringsenkäten. Statistiskt uppvisar norsk BNP och EUR/NOK den högsta korrelationen för ekonomisk statistik och NOK-rörelser. För svensk del har vi arbetslöshetsstatistik på torsdag och PPI samt hushållsutlåningen på fredag. En eventuell NOK/SEK rörelse bör i all huvudsak vara föremål för utfallet av norsk statistik som i all huvudsak är viktigare än svensk denna vecka. Den tekniska analysen pekar på ett ökande efterfrågetryck i NOK/SEK.
Konklusion: Bättre än förväntad norsk BNP statistik på torsdag kan få NOK/SEK att ta fart uppåt.
OBSERVATIONER
+ Oljepriset har repat sig från de lägsta nivåerna under sommaren.
+ Norges Bank har en positiv styrränta (0,5 %).
+ Norsk ekonomi återhämtar sig från oljeprisfallet.
+ Riksbanken är fortsatt mycket expansiv.
+ Vår modell för positionering visar på att spekulanterna är korta NOK vilket riskerar att utlösa stoppar vid en NOK förstärkning.
+ NOK/SEK ser ut att eventuellt kunna göra eventuell inverterad huvud/skuldra bottenformation.
+ EUR/NOK ser ut att forma en björnflagga.
– Vår modell för positionering visar att spekulanterna är korta och förväntar sig en svagare NOK.
– Sve ekonomi är stark (ek.överraskningsindex högsta på 11 år)
– Om Riksbanken snabbare än förväntat blir mer hökaktig vilket vi är lite skeptiska till givet den senaste SEK-förstärkningen.
– Lägenhetspriserna i Oslo har under de senaste månaderna fallit
– Tekniskt sett befinner vi oss fortfarande i en fallande kanal men de senaste bottnarna kommer allt längre från botten av denna vilket är ett svaghetstecken i trenden.
Tillgängliga certifikat:
BULL NOKSEK X4 S
BEAR NOKSEK X4 S
OMX (TEKNISK ANALYS)
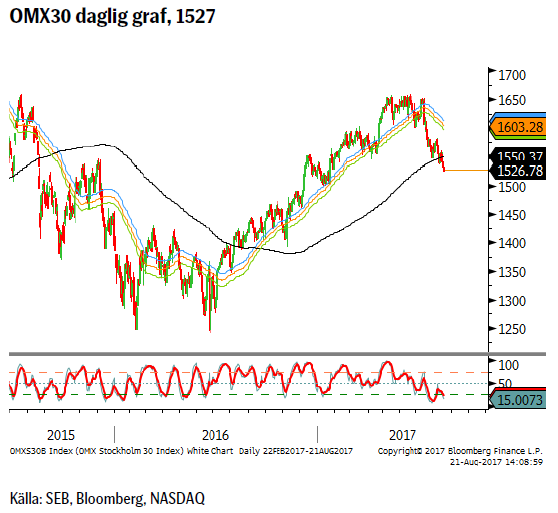 Utvecklingen under sommaren, sedan vår varning om att marknaden verkade misslyckas att ta sig tillbaka över 55dagars medelvärdesbandet (efter att juni utvecklats till en vändningsmånad), är helt klart oroväckande. I och med brottet under både 55dagars bandet och under 233d glidande mv så är den korta trenden bekräftad negativ. I skrivande stund testar vi nu 55veckors medelvärdesbandets nedre del och skulle även detta stöd ge vika öppnar vi upp för 233v mv som just nu ligger vid 1428. Dock finns det indicier i dagsgrafen om att vi nu börjar närma oss åtminstone en kortare positiv rekyl (men frågan är om vi inte får se nya bottnar därefter).
Konklusion: En mindre positiv korrektion ser trolig ut i närtid. På lite längre sikt är risken fortfarande på nedsidan.
OBSERVATIONER
+ Ekonomisk statistik fortsätter att vara positiv.
+ Det långsiktiga vågmönstret är positivt.
+ Kortsiktigt så är marknaden översåld och har en tendens till en positiv divergens mellan pris och indikator.
– Stigande räntor (mer uppgång efter innevarande konsolidering/korrektion).
– Månadsvändningssignal per sista juni.
– 55d mv band brutet och priset kvarstår i/under detta.
– 233d mv brutet.
– En ”överdrivet” lång uppgångssekvens (11 månader i sträck) bröts i och med nedgången in juni.
– Vecko och månadsgraferna är överköpta. På veckobasis har vi inte varit så här överköpta sedan inför toppen 2015.
– Fem vågor ned från toppen är illavarslande.
Tillgängliga certifikat:
BULL OMX X5, X10 & X15 S
BEAR OMX X1, X5, X10 & X15 S
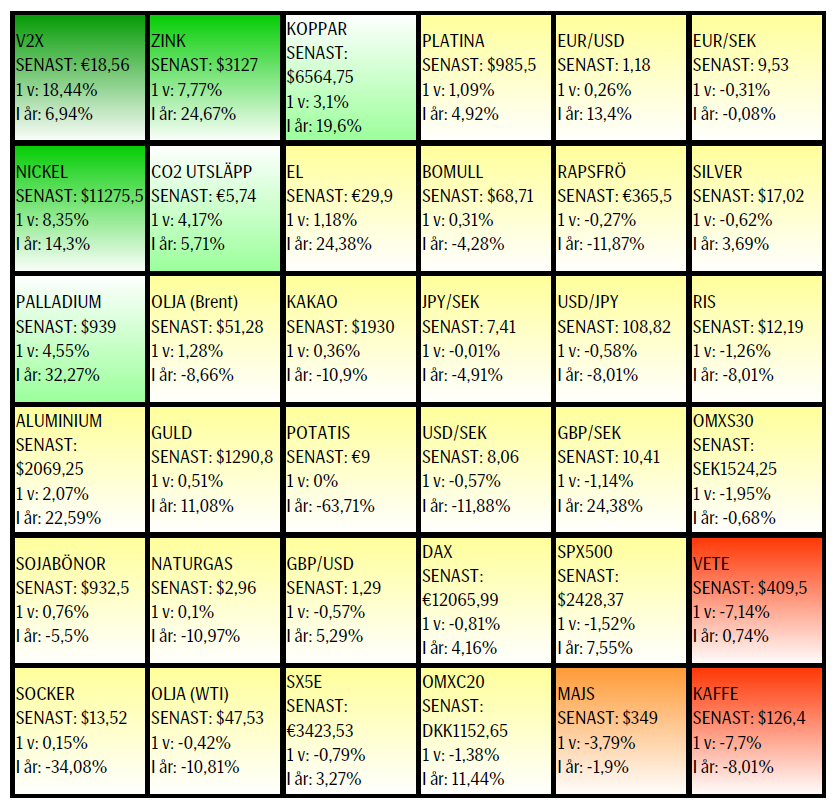
UTVECKLING SENASTE VECKAN SAMT SEDAN ÅRETS BÖRJAN
[box]SEB Veckobrev Veckans råvarukommentar är producerat av SEB:s Commodities Sales desk och publiceras i samarbete och med tillstånd på Råvarumarknaden.se[/box]
KÄLLOR
Bloomberg, Reuters, SEB
VILLKOR
För varje enskilt certifikat/mini future finns Slutliga Villkor som anger de fullständiga villkoren. Slutliga Villkor finns tillgängligt på kurssidan för respektive certifikat/mini future på www.seb.se, Börs & finans, fliken Strukturerade placeringar.
RISKER
En sammanfattning av de risker som är förknippade med Börshandlade certifikat generellt finns i Produktbroschyren för respektive certifikat eller mini future som är tillgängligt på seb.se/cert respektive seb.se/mini. För en fullständig bild av riskerna behöver du ta del av SEB:s offentliggjorda Grundprospekt för Certifikat- och Warrantprogram som är publicerat på www.seb.se/cert respektive seb.se/mini.
DISCLAIMER
Detta marknadsföringsmaterial, framtaget av SEB:s Commodities Sales desk, har upprättats enbart i informationssyfte.
Även om innehållet är baserat på källor som SEB bedömt som tillförlitliga ansvarar SEB inte för fel eller brister i informationen. Den utgör inte oberoende, objektiv investeringsanalys och skyddas därför inte av de bestämmelser som SEB har infört för att förebygga potentiella intressekonflikter. Yttranden från SEB:s Commodities Sales desk kan vara oförenliga med tidigare publicerat material från SEB, då den senare hänvisas uppmanas du att läsa den fullständiga rapporten innan någon åtgärd vidtas.
Dokumentationen utgör inte någon investeringsrådgivning och tillhandahålls till dig utan hänsyn till dina investeringsmål. Du uppmanas att självständigt bedöma och komplettera uppgifterna i denna dokumentation och att basera dina investeringsbeslut på material som bedöms erforderligt. Alla framåtblickande uttalanden, åsikter och förväntningar är föremål för risker, osäkerheter och andra faktorer och kan orsaka att det faktiska resultatet avviker väsentligt från det förväntade. Historisk avkastning är ingen garanti för framtida resultat. Detta dokument utgör inte ett erbjudande att teckna några värdepapper eller andra finansiella instrument. SEB svarar inte för förlust eller skada – direkt eller indirekt, eller av vad slag det vara må – som kan uppkomma till följd av användandet av detta material eller dess innehåll.
Observera att det kan förekomma att SEB, dess ledamöter, dess anställda eller dess moder- och/eller dotterbolag vid olika tillfällen innehar, har innehaft eller kommer att inneha aktier, positioner, rådgivningsuppdrag i samband med corporate finance-transaktioner, investment- eller merchantbanking-uppdrag och/eller lån i de bolag/finansiella instrument som nämns i materialet.
Materialet är avsett för mottagaren, all spridning, distribuering mångfaldigande eller annan användning av detta meddelande får inte ske utan SEB:s medgivande. Materialet riktar sig inte till personer vars medverkan kräver ytterligare prospekt, registrerings- eller andra åtgärder än vad som följer av svensk rätt. Det åligger var och en att iaktta sådana restriktioner. Materialet får inte distribueras i eller till land där distribution kräver ovan nämnda åtgärder eller strider mot reglering i sådant land. Materialet riktar sig således inte till fysiska eller juridiska personer hemmahörande i USA eller i något annat land där publicering eller tillhandahållande av materialet är förbjudet eller strider mot tillämpliga bestämmelser i landet.
Oaktat detta får SEB tillåta omfördelning av materialet till utvald tredje part i enlighet med gällande avtal. Materialet får inte spridas till fysiska eller juridiska personer som är medborgare eller har hemvist i ett land där sådan spridning är otillåten enligt tillämplig lag eller annan bestämmelse.
Skandinaviska Enskilda Banken AB (publ) är ett publikt aktiebolag och står under tillsyn av Finansinspektionen samt de lokala finansiella tillsynsmyndigheter i varje jurisdiktionen där SEB har filial eller dotterbolag.
Market is starting to take US/Iran headlines with a pinch of salt. Brent crude rose $2.8/b yesterday to an official close of $112.1/b. But after that it traded as low as $108.05/b before ending late night at around $109.7/b. Through the day it traded in a range of $106.87 – 112.72/b amid a flurry of news or rumors from Iran and the US. ”US temporary sanctions during negotiations” (falls alarm). ”We will bomb Iran” (not anyhow),… etc. While the market is still fluctuating to this kind of news flow, it is starting to take such headlines with a pinch of salt.

We’ll see. Maybe, maybe not. The Brent M1 contract is trading at $110.2/b this morning which very close to the average ticks through yesterday of $110.4/b.
Trump with bearish, verbal intervention whenever Brent trades above $110/b it seems. What seems to be a pattern is that Trump states something like ”very good negotiations going on with Iran”, ”New leaders in Iran are great,..”, ”Great progress in negotiations,…”, ”Deal in sight,..” etc whenever the Brent M1 contract trades above $110/b. An effort to cool the market. These hot air verbal interventions from Trump used to have a heavy bearish impact on prices, but they now seems to have less and less effect unless they are backed by reality.
As far as we can see there has been no real progress in the negotiations between the US and Iran with both sides still standing by their previous demands.
Iran is getting stronger while the cease fire lasts making a return to war for Trump yet harder. Iran is naturally in constant preparation for a return to war given Trump’s steady threats of bombing Iran again. Iran is naturally doing what ever is possible to prepare for a return to war. And every day the cease fire lasts it is better prepared. This naturally makes it more and more difficult and dangerous for the US to return to warring activity versus Iran as the consequences for energy infrastructure in the Persian Gulf will be more and more severe the longer the cease fire lasts. Israel seems to see it this way as well. That the war is not won and that current frozen state of a cease fire gives Iran opportunity to rebuild military and politically.
Global inventories are drawing down day by day. How much? In the meantime the Strait of Hormuz stays closed. There is varying measures and estimates of how much global inventories are drawing down. Our rough estimate, back of the envelope, is that global inventories are drawing down by at least some 10 mb/d or about 300 mb/d in a balance between loss of supply versus demand destruction. Other estimates we see are a monthly draw of 250-270 mb/d. The IEA only ’measured’ a draw in global observable stocks of 117 mb in April with oil on water rising 53 mb while on shore stocks fell 170 mb. But global stocks are hard to measure with large invisible, unmeasured stocks. As such a back of the envelope approach may be better.
Oil products is what the world is consuming. Oil product prices likely to rise while product stocks fall. Strategic Petroleum Reserves (SPR) are predominantly crude oil. Discharging oil from OECD SPR stocks, a sharp reduction in Chinese crude imports and a reduction in global refinery throughput of 6-7 mb/d has helped to keep crude oil markets satisfactorily supplied. But global inventories are drawing down none the less. And oil products is really what the world is consuming. So if global refinery throughput stays subdued, then demand will eventually have to match the supply of oil products. The likely path forward this summer is a steady draw down in jet fuel, diesel and gasoline. Higher prices for these. Then, if possible, higher refinery throughput and higher usage of crude in response to very profitable refinery margins. And lastly sharper draw in crude stocks and higher prices for these. But some 6 mb/d of oil products used to be exported through the Strait of Hormuz. And it may not be so easy to ramp up refinery activity across the world to compensate. Especially as Ukraine continues to damage Russian refineries as well as Russian crude production and export facilities.
Watch oil product stocks and prices as well as Brent calendar 2027. What to watch for this summer is thus oil product inventories falling and oil product premiums to crude rising. Another measure to watch is the Brent crude 2027 contract as it rises steadily day by day as the Strait of Hormuz stays closed and global oil inventories decline. The latter is close to the highest level since the start of the war and keeps rising.
The Brent M1 contract and the Brent 2027 prices and current price of jet fuel in Europe (ARA). All in USD/b

Our back of the envelope calculation of the global shortage created by the closure of the Strait of Hormuz. Note that 3.5 mb/d of discharge from SPR is also a draw. Note also that ’Forced demand loss’ of 2.5 mb/d is probably temporary and will fall back towards zero as logistics are sorted out leaving ’Price demand loss’ to do the job of balancing the market. Thus a shortfall of at least 9 mb/d created by the closure. More if SPR discharge is included and more if Forced demand loss recedes.

Brent is climbing higher. Front-month is at USD 106.3/bl this morning, close to a weekly high and a USD 9/bl jump from Mondays open. This is the move we flagged as a risk earlier in the week: the market shifting from ”a deal is around the corner” to ”this is going to take longer than we thought”.

Analyst Commodities, SEB
During April, rest-of-year Brent remained remarkably stable around USD 90/bl. A stability which rested on one single assumption: the SoH reopens around 1 May. That assumption is now slowly falling apart.
As we highlighted yesterday: every week of delay beyond 1 May adds (theoretically) ish USD 5/bl to the rest-of-year average, as global inventories draw 100 million barrels per week. i.e., a mid-May reopening implies rest-of-year Brent closer to USD 100/bl, and anything pushing into June or July takes us meaningfully higher.
What’s changed in the last 48 hours:
#1: The US military has formally warned that clearing suspected sea mines from SoH could take up to six months. That is a completely different timescale from what the financial market is pricing. Even a political deal tomorrow does not immediately reopen the strait.
#2: Trump has shifted his tone from urgency to ”strategic patience”. In yesterday’s press conference: ”Don’t rush me… I want a great deal.” The market is reading this as a president no longer feeling pressured by timelines, with the naval blockade running in the background.
#3: So far, the military activity is escalating, not de-escalating. Axios reports Iran is laying more mines in SoH. The US 3rd carrier strike group (USS George H.W. Bush) is arriving with two countermine vessels. Trump yesterday ordered the US Navy to destroy any Iranian boats caught laying mines. While CNN reports that the Pentagon is actively drawing up plans to strike Iranian SoH capabilities and individual Iranian military leaders if the ceasefire collapses. i.e., NOT a attitude consistent with an imminent deal!
Spot crude and product prices eased off the early-April highs on a combination of system rerouting and deal optimism. Both now weakening. Goldman estimates April Gulf output is reduced by 14.5 mbl/d, or 57% of pre-war supply, a number that keeps getting worse the longer this drags on.
Demand-side adaptation is ongoing: S. Korea has cut its Middle East crude dependence from 69% to 56% by pulling more from the Americas and Africa, and Japan is kicking off a second round of SPR releases from 1 May. But SPRs are finite.
Ref. to the negotiations, we should not bet on speed. The current Iranian leadership is dominated by genuine hardliners willing to absorb economic pain and run the clock to extract concessions. That is not a setup for a rapid resolution. US/Israeli media briefings keep framing the delay as ”internal Iranian divisions”, the reality is more complicated and points toward weeks and months, not days.
Our point is that the complexity is large, and higher prices have only just started (given a scenario where the negotiations drag out in time). The market spent April leaning on the USD 90/bl rest-of-year assumption; that case is diminishing by the hour. If ”early May reopening” is replaced by ”June, July or later” over the next week or two, both crude and products have meaningful room to reprice higher from here. There is a high risk being short energy and betting on any immediate political resolution(!).
Down on Friday. Up on Monday. The Brent June crude oil contract traded down 5.1% last week to a close of $90.38/b. It reached a high of $103.87/b last Monday and a low of $86.09/b on Friday as Iran announced that the Strait of Hormuz was fully open for transit. That quickly changed over the weekend as the US upheld its blockade of Iranian oil exports while Iran naturally responded by closing the SoH again. The US blew a hole in the engine room of the Iranian ship TOUSKA and took custody of the ship on Sunday. Brent crude is up 5.6% this morning to $95.4/b.
The cease-fire is expiring tomorrow. The US has said it will send a delegation for a second round of negotiations in Islamabad in Pakistan. But Iran has for now rejected a second round of talks as it views US demands as unrealistic and excessive while the US is also blocking the Strait of Hormuz.
While Brent is up 5% this morning, the financial market is still very optimistic that progress will be made. That talks will continue and that the SoH will fully open by the start of May which is consistent with a rest-of-year average Brent crude oil price of around $90/b with the market now trading that balance at around $88/b.
Financial optimism vs. physical deterioration. We have a divergence where the financial market is trading negotiations, improvements and resolution while at the same time the physical market is deteriorating day by day. Physical oil flows remain constrained by disrupted flows, longer voyage times and elevated freight and insurance costs.
Financial markets are betting that a US/Iranian resolution will save us in time from violent shortages down the road. But every day that the SoH remains closed is bringing us closer to a potentially very painful point of shortages and much higher prices.
The US blockade is also a weapon of leverage against its European and Asian allies. When Iran closed the SoH it held the world economy as a hostage against the US. The US blockade of the SoH is of course blocking Iranian oil exports. But it is also an action of disruption directed towards Europe and Asia. The US has called for the rest of the world to engaged in the war with Iran: ”If you want oil from the Persian Gulf, then go and get it”. A risk is that the US plays brinkmanship with the global oil market directed towards its European and Asian allies and maybe even towards China to force them to engage and take part. Maybe unthinkable. But unthinkable has become the norm with Trump in the White House.


Sommarväder skapar prisrally på elbörsen
Oil product price pain is set to rise as the Strait of Hormuz stays closed into summer

Solkraften pressar elpriserna dagtid

Michel Gubel ger sin syn på oljemarknaden